Gold Forecast: Looking For Next Key Low


 Recapping Last Week
Last week's action saw gold forming its high in Monday's session, here doing so with the tag of the 1853.00 figure. From there, a sharp decline was seen into Wednesday's session, with the metal dropping all the way down to a low of 1780.00 - before bouncing off the same into the weekly close. Note: we now move to the February, 2022 contract for our numbers.
Gold Market, Short-Term
For the near-term action, as mentioned last weekend the downward phase of the 10 cycle was deemed to be in force, with the additional weakness off the top now favoring the same to also be true for the larger 20-day wave.
The chart below shows the smaller 10-day component:
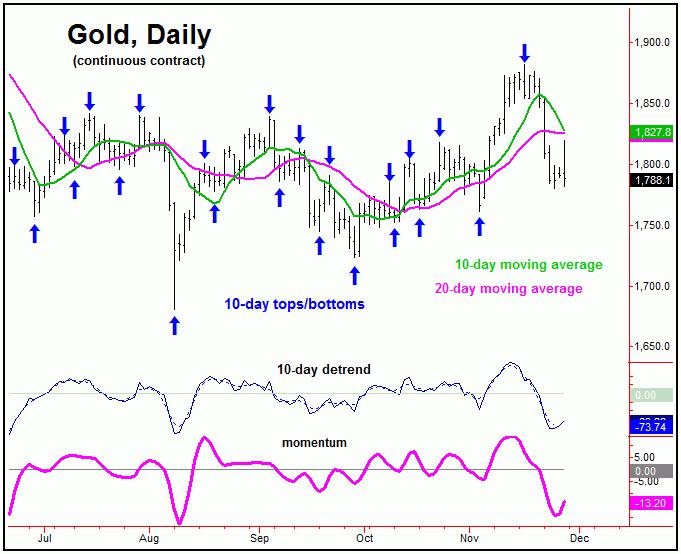
With the above said and noted, the next short-term trough should now come from the combination of 10 and 20-day cycles. In terms of time, these waves are each at some 17 trading days along, which is in the back-end range for a 10-day bottom - and the early-end window for a trough with the larger 20-day component.
Once the next 10 and 20-day cycle combination bottom is complete, then gold should see a quick rally of a few days, though with at least the potential for something bigger to play out. In terms of price, the probabilities should favor the next upward phase of these waves to see a quick rally back to the 9-day moving average, at minimum.
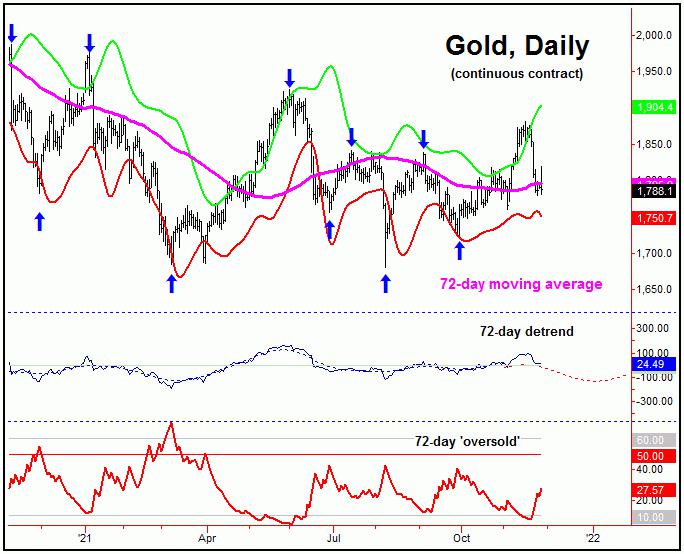
From the comments made in my prior articles (and reports), our ideal path was for gold to remain above the 1818-1832 region (December, 2021 contract numbers), then to push back to higher highs into late-November/early-December, before topping our 72-day cycle. However, the depth of the recent decline seems to lean the odds in favor of the downward phase of this 72-day wave to be already in progress, with this larger wave shown again on the chart below:
The good news is that - in a special e-mail alert to our Gold Wave Trader subscribers - we were able to exit our recent open long position in the GLD, doing at the 1854-1860 level for gold - and doing so with a tidy profit from entry.
We did this, due to the fact that each of our price targets had been met for the recent upward phase - as well as due to the fact that our 72-day 'oversold' indicator had spiked below its lower reference line, something seen near tops with this wave. We have handily beaten the gold market this year with our ETF trades.
Stepping back then, if the downward phase of the 72-day cycle is back in force - as earlier suggested - then what we would expect to see in the days ahead is for the next rally phase of the 10 and 20-day cycles to end up as a countertrend affair - holding below the 1882.10 swing top. From there, a drop back to lower lows again into December, before completing the next key low, coming from this same 72-day cycle.
Stepping back further, until proven otherwise, the upward phase of the larger 154-day cycle is still deemed to be in force, with this wave shown again on the chart below:
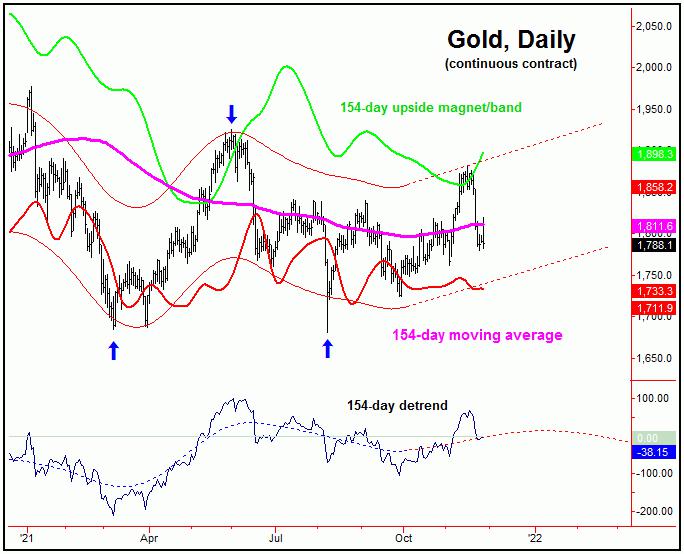
If the assessment with this 154-day cycle is correct, the correction phase of the smaller 72-day component should be expected to end up as a countertrend affair, with a December bottom giving way to higher highs into early next year - which is also near the end of the bullish seasonal period for gold.
The Bottom Line
The overall bottom line with the above is that the next short-term low is due to materialize, now coming from the combination of 10 and 20-day cycles. Once complete, a quick rally of a few days should be expected, though one which ends up as a countertrend affair. From there, a drop back to lower lows would be expected into December, with more exact details on how we expect this to play out noted in our Gold Wave Trader market report. Stay tuned.
Jim Curry
The Gold Wave Trader
http://goldwavetrader.com/
http://cyclewave.homestead.com/
**********


