Gold & Gold Equities Pop and Oil Has A Drop


Gold and gold equities have performed well over the past two months climbing in value as the broad market drifts sideways waiting for buyers or sellers to step up to the plate. I am hearing traders in a panic saying they think gold is going to start moving $100 per day and are jumping on the band wagon, and that gold's going to $3500 per ounce soon. While that is possible I just don't see it happening right now and that we need to jump on the band wagon and chase this high price. I provided three charts of gold and gold equities to show you how I see things right now.
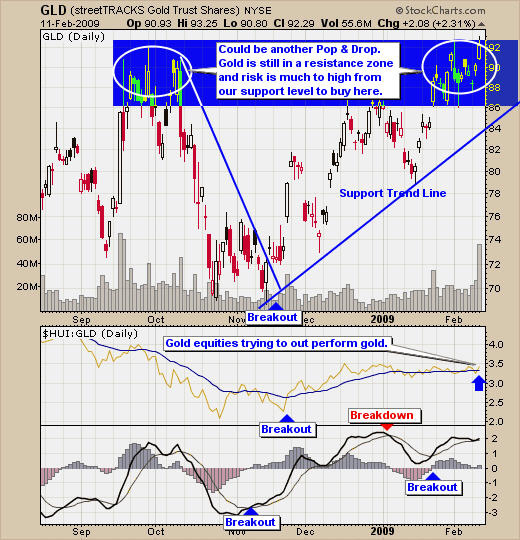
Gold Bullion Trading Fund - GLD
Gold has been trading up here in this range for the past 3 weeks and to me it is looking very unstable and toppy. I expect to see some type of pullback towards our support trend line as profit takers step. I like to buy during pullbacks but unfortunately we had the news with the recover/bailout plan and that scared investors and they dumped a bunch of money back into gold the past 2 days giving gold a nice move higher. This heightened fear level could push gold higher for a couple days, but a retrace will eventually have to happen. I also want to point out the huge volume today. The last time we saw this type of volume was when gold made a huge move higher and almost marked the high for the previous rally in Sept. I am not reading into this much but it's something to note.
Gold Bullion Trading Fund - GLD Daily Chart
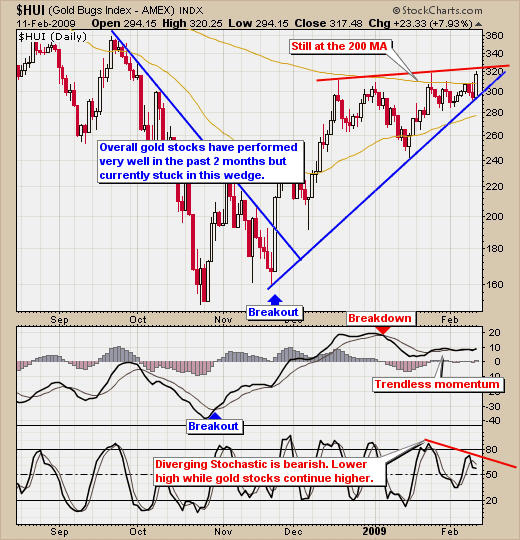
Gold Bugs Index - Gold Equities
Gold equities posted a nice move higher today as they move closer to their ascending wedge pattern. While this is a bullish pattern and stocks of all types are starting to have buyers push them higher, I do want to mention that this bullish pattern looks a little weak. As you can see in the chart it is battling the 200 moving average, momentum looks to be diverging as well as the stochastic indicator. The one really good thing gold equities have going for them is that if the broad market is bottoming and start to move higher which could pull gold down as investors dump their money into growth stocks, these gold stocks will benefit as investors put their money into gold stocks as well pushing them higher.
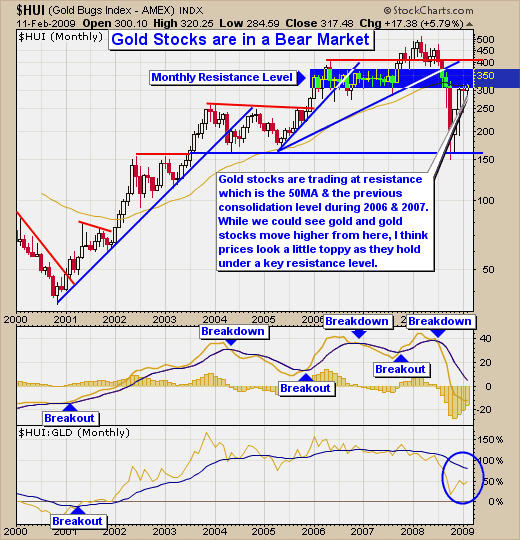
Gold Bugs Monthly Chart
As you can see on the monthly chart, gold stocks are currently under long term resistance and the 50 moving average. Like I mentioned earlier gold stocks should perform well when the market bottoms giving them an extra boost if gold continues higher. I thought that this monthly chart shows the bearish trend and that gold stocks are at resistance looking from a distance.
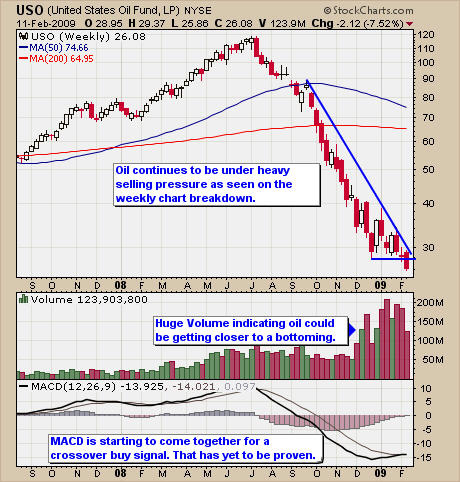
Crude Oil Trading Fund - USO
Crude oil traders continue to see the downward selling pressure which has haunted oil prices for the past 7 months as oil hits a multi year low again.
USO Crude Oil Trading Fund
Gold and Oil Trading Conclusion
Both gold and gold equities are on a buy signals, if you are long or decide to buy here remember to place stop orders to protect yourself in case things rollover. Its better to break even or have a small loss than it is to hold BIG losing position for a long time. You can always buy it back if things look bullish even if it happens to be the next day.
The broad market is starting to look like its bottoming as buyers stepped back in today as we reached the bottoms for the SP500 and Dow. We won't see a big rally until oil bottoms and turns up lifting energy stocks, and we need the financial stocks to start moving higher as well. Once they start moving up then I expect we will see some exciting gains in stocks as investor will have confidence again. Looking at oil I expect we will see lower prices over the next week or so as it hopefully flushes out the last of the sellers.
Because the market looks to be bottoming I will be looking at some speculative stocks which are showing signs of strength and have big potential. Most of these stock plays are explosive. Trades will last anywhere from 3 days to 2 months. The down side risk on some of these could be 15%, but potential reward will be 25+%. This is a stock pickers market now and finding the individual stocks at times like this can be life changing.

Chris Vermeulen has been involved in the markets since 1997 and is the founder of Technical Traders Ltd. He is an internationally recognized technical analyst, trader, and is the author of the book: 7 Steps to Win With Logic
Through years of research, trading and helping individual traders around the world. He learned that many traders have great trading ideas, but they lack one thing, they struggle to execute trades in a systematic way for consistent results. Chris helps educate traders with a three-hour video course that can change your trading results for the better.
His mission is to help his clients boost their trading performance while reducing market exposure and portfolio volatility.
He is a regular speaker on HoweStreet.com, and the FinancialSurvivorNetwork radio shows. Chris was also featured on the cover of AmalgaTrader Magazine, and contributes articles to several financial hubs like MoneyShow.com.


