Gold Looks A Better Bet Than UK Property


Dominic Frisby of Money Week looks at the historical relationship between UK house prices and gold (including some great charts), and concludes that your money is better off in the yellow metal than bricks and mortar.

Source: Money Week
Today we return to a subject that has been a favourite of mine over the years: UK house prices – but with a twist.
We don’t consider them in the debased, devalued currency that is the pound. Rather, we measure them in the eternal currency that is gold.
What is the use of money?
Money has three functions: to be a medium of exchange, a store of value, and a unit of account.
Sterling functions well as a medium of exchange within the confines of our national borders (though it is less effective overseas).
As a store of value, it’s been awful. Every year it loses purchasing power, and the interest that is paid does not compensate the loss. Real inflation is much higher than the Bank of England’s traditional measures – RPI and latterly CPI – show.
Indeed, sterling has lost more than 95% of its value over the last 100 years, which measures sterling’s purchasing power, shows.
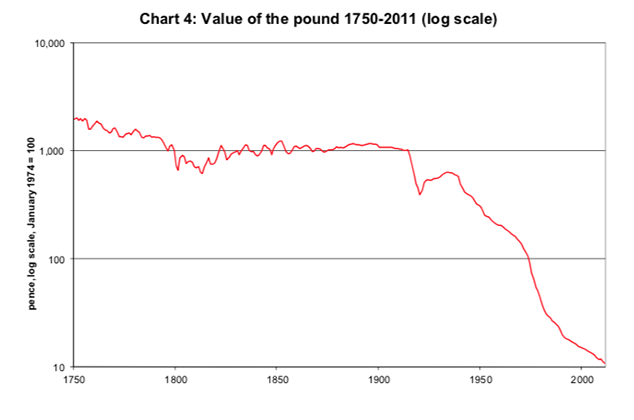
(Irony of ironies, this chart – which is based on a range of official inflation measures – comes from a Bank of England paper. The Bank of England is supposed to be sterling’s steward.)
A few years ago, Lloyds Bank showed how sterling had lost more than 90% of its purchasing power in the last 40 years alone, and no doubt over the next 40 years, it will have lost 90% of the purchasing power it has today.
When money loses its purchasing power like this it also means that its value as a unit of account is brought into doubt.
A good unit of account must maintain its value, which sterling does not. As a result, if we want to measure prices over an extended period of time, we must resort to “inflation-adjusted” prices and the like, which are extremely arbitrary.
By way of illustration, let’s start with UK house prices, in sterling, since 1953.
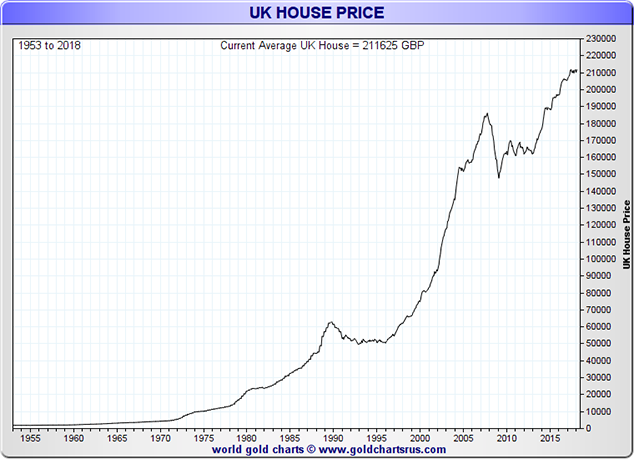
(All of these charts, by the way, come courtesy of my main man, Nick Laird, over at goldchartsrus.com.)
You can see it’s a virtually never-ending climb higher, with two interludes – one in the 1990s, and the other following the global financial crisis of 2008.
However, this inexorable rise is as much due to sterling’s loss of purchasing power as it is to rising UK house prices. It could never have been allowed to happen if house prices had been included in the Bank of England’s measures of inflation, but they were deliberately ignored.
The easiest way for ordinary people to hedge against the debasement of their money has been housing – and that’s probably the main reason that buy-to-let grew to become so popular (although new tax laws look like they have killed that particular game).
Gold, which cannot be printed or debased, is all but useless as a medium of exchange. But it has made for a much better store of value and a much better unit of account than sterling.
Thus we consider UK house prices in gold.
Gold – a much more reliable financial measuring tape
As of now, one ounce of gold is worth around £960. The average UK house is, according to the Nationwide, worth £211,625 – or 220 ounces of gold.
(By the way, I’m fully aware these ratios don’t take into account the utility of a house; the yield if you let it out; the fact that mortgages have been so dirt cheap these last ten years; the tax costs of selling gold at a profit and so on. Comparing the ratio between two markets is nevertheless a useful exercise in determining relative value.)
Here are UK house prices measured in gold, going back to 1953.
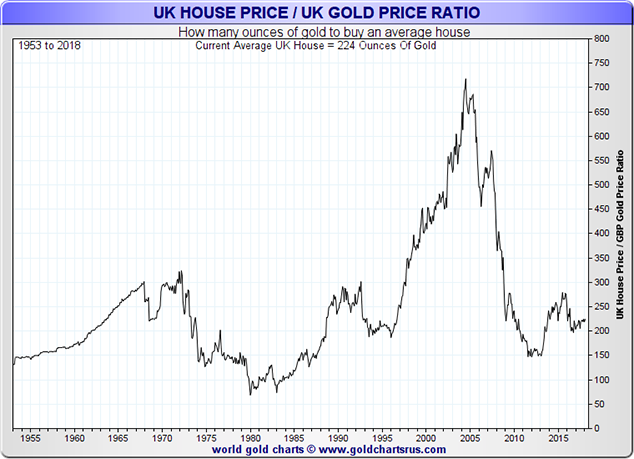
Comparing those two charts – house prices in sterling and house prices in gold – the story is quite different. When you look at the journey UK house prices have been on measured in gold, you also get a clearer idea of just how much sterling has been debased, particularly since 2008.
(And, by the way, the received wisdom is that currency debasement most hurts savers. Actually, the hardest hit are the asset-light, salaried classes – usually the under 35s).
Measured in gold, from 2005, house prices fell for six years, so that by 2012, at 150oz for the average UK home, they were briefly back to where they were in 1987. It’s astonishing.
Even today, at 220oz for the average UK home, we are only at mid-1990s prices.
You can see the rally that housing has enjoyed post-2012, from 150oz to around 275oz in 2016 (which now looks like it was the peak of the market, in gold terms at least), which was as much to do with gold’s decline as it was housing’s appreciation. Post-Brexit, gold had a good rally against sterling, and house prices have fallen in gold terms.
It’s also amazing to look at how low housing got in gold terms back in the 1980s – to less than 100oz. Will we ever go back to those levels? Possibly.
A crisis in the bond market; inflation; rising interest rates; a rush to gold; all coupled with the fact that, with a generation priced out, it is no longer politically desirable to prop up house prices in the way that it once was.
It looks far-fetched just now, but it really wouldn’t take that much to get us there.
What’s next for London house prices?
So to London. London and the rest of the UK are two very different beasts when it comes to house prices.
First, here’s Greater London since 1968 in sterling terms.
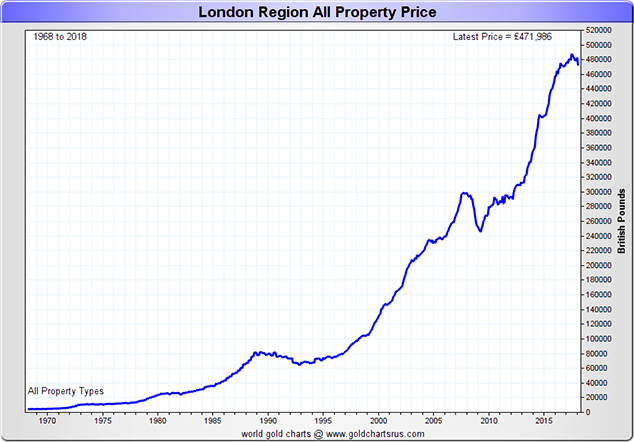
Up, up and away.
And now here’s Greater London in gold.
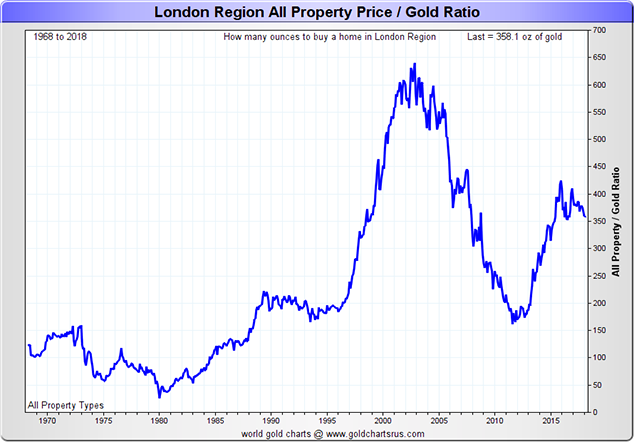
Where London has differed from the rest of the UK (perhaps with the exception of the likes of Oxford, Cambridge, Bristol and Brighton) is in the breathtaking rally it has enjoyed since 2012, whether in sterling or gold. The average London house went from 150oz to almost 450oz. From low to high it nearly tripled.
The market got massively overheated by about 2015-16 and has since pulled back. We now have atrophy at the top of the market, thanks to George Osborne’s higher stamp duty, and central London, agents report, appears to have pulled back by 10% or 15%. In gold terms, we are back at 350oz.
Unlike the rest of the UK, we are nowhere near the early 1990s levels of around 200oz.
Where London goes next depends, to my mind at least, on the current chancellor. Stamp duty is punitively high: it’s 10% above £925,000 and 13% above £1.5m – even more for second homes. It’s killed the top of the market.
But despite lower transactions levels, revenue to the Treasury is also high, so that will be a deterrent to any chancellor wishing to reduce it. If stamp duty stays high, London property heads lower. If it doesn’t, then the outlook is brighter.
As for gold, meanwhile, my outlook remains as it’s been for a while: that we will range trade. Out on the horizon, the dominoes are slowly lining up for another bull market in gold – excuse the mixed metaphor – but we are just not there yet.
In all, of the two, gold – trading in a range – looks a better bet than property, which looks as though it’s heading lower.
PS Nick Laird has put together charts for each region in London. I’ll post them on on my twitter feed later today.
********
 Mark O'Byrne is executive and research director of www.GoldCore.com which he founded in 2003. GoldCore have become one of the leading gold brokers in the world and have over 4,000 clients in over 40 countries and with over $200 million in assets under management and storage.We offer mass affluent, HNW, UHNW and institutional investors including family offices, gold, silver, platinum and palladium bullion in London, Zurich, Singapore, Hong Kong, Dubai and Perth.
More from Gold-Eagle


