Is The Gold Market Finally Ready To Breakout?


Throughout 2016, we stated we did not expect much from gold, and we stuck to this forecast, even though many experts went out of their way to report that gold was ready to soar to the Moon or even to the next Galaxy. In fact, since 2011, we have continuously said that until the Trend turns positive, it would be best to play other lucrative markets, such as the general equities market, the US dollar, etc. During this time several experts stated that gold was ready to surge and some issued insane targets ranging from $20,000-$50,000. Under no circumstance can we ever see gold going to $20,000 or $50,000 and even if drank a whole bottle of scotch or any other toxic compound it would still be very hard to visualise such a target. Issuing such targets is perfect for fear mongering, and we find that tactic to be unpleasant and distasteful.
You would think that experts would try to release targets that made some sense. After all, gold has not even traded past $2,000, so it makes one wonder how any individuals with a shred of common sense could issue a target of over $5,000. Even this target is quite high, and we only envision it being struck under extreme conditions. Don’t fixate on these preposterous targets for such targets are only for those who live in Lala land and have plenty of time to ponder over rubbish. Gold would need to trade past $1990 on a monthly basis to indicate significantly higher prices. Until that occurs, focus on targets that are below $2,000.
Having said that gold has for the time in many years issued a confluence of bullish signals. The trend is still neutral but moving closer and closer to the bullish zone.
Let's Examine These bBullish Factors
Panic in the gold Camp; we spotted a surge in frustration in the gold camp when gold traded below 1200 after creating the illusion that It was ready to take off in Nov 2016; this frustration soared when it broke below 1150, and it reached a screeching point when it traded below 1130
Many Technical Indicators, including several of our custom indicators are trading in the extremely oversold ranges on the weekly charts. Weekly charts, infers that each bar on the chart represents one week’s worth of data
8 out of the top 10 sectors based on relative strength are commodity based industries; Gold comes in at number 10.
Some speculative stocks such as GSS have taken off; GSS, for example, is several hundred percentage points since Jan of 2016. GSS did its own thing completely ignoring the price of gold. Individually, this is not a big deal, but collectively it takes on more weight.
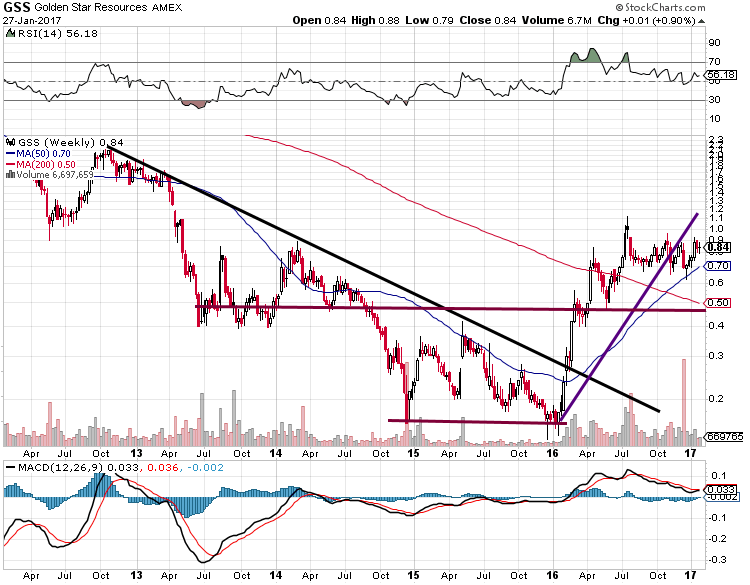
If you look at the weekly chart of GSS, you would not think this stock is in the gold sector given the strong performance. When small caps stocks start to take off before the metal, it is usually a sign of good things to come. Markets are forwarded looking beasts so stocks like GSS could be pricing a future that is more favourable to gold.
Technical Outlook
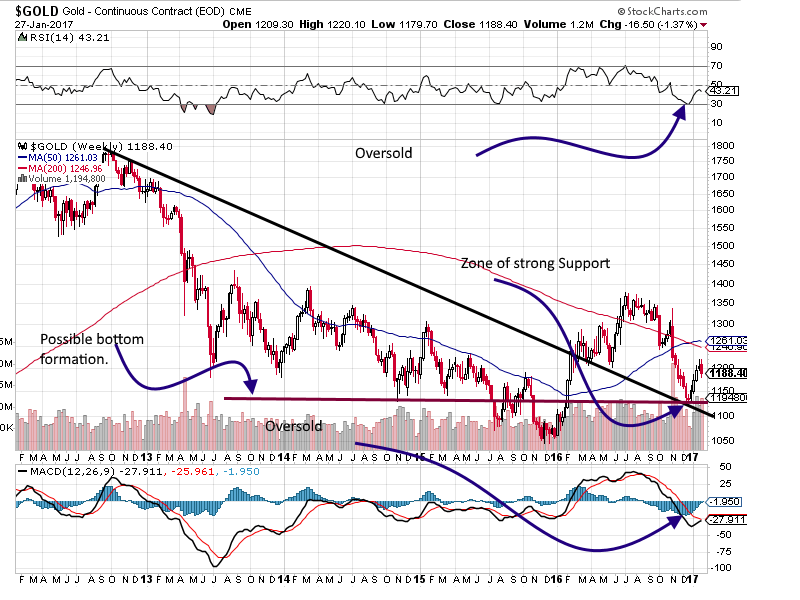
This Is A Weekly Chart Of Gold…And There Are Several Interesting Developments
- Gold appears to have put in a double bottom formation.
- Gold bottomed almost precisely where the downward trending line and the line of support intersect. This is a case of former resistance turning into support, and when combined with aforementioned factors, it has to be viewed through a bullish lens.
- MACD’s are trading in the oversold ranges and are close to experiencing a bullish crossover
- Gold has a strong layer of support in the $1130-$1140 ranges, and as long as it does not close below this level on a weekly basis, the outlook will remain favourable
Very Strong Intra Market Positive Divergence Signal
Gold bottomed on the 15th of Dec 2016, but the dollar continued to trend higher for several more days and Gold reacted in a positive way to this development. The dollar has been on a tear since Trump won, so Gold should have continued trending lower, but it did not. In Dec 2015, gold dropped to the $1050 ranges, but the dollar was trading below 100, but in 2016 the dollar was trading well above 100 and gold refused to take out the lows set back in 2015. This is a very strong intra-market positive divergence signal and has to be viewed through a bullish lens.
Conclusion
Gold has now given the first signal that it is getting ready to test the $1360 ranges with a possible overshoot to the $1380 ranges. A weekly close above $1380 will set up the path for a test of and potential challenge of the 2011 highs. As a result of these developments, gold no longer needs to trade down to the mid to high $1000 ranges. The downside risk is limited from here, and if you do not have a position in bullion, it might be prudent to deploy some funds into gold and or silver bullion.
We do not try to predict tops or bottoms; we focus on trends. We are not concerned with getting in at the absolute bottom or top because that is endeavour best reserved for fools with plenty of time. For every top or bottom you might catch, there are ten that you will miss. When there is a trend change, you have plenty of time to get in. Most of the bottom fishers will close their positions very early in the game as they will be so happy with the quick gains they locked in after years of suffering. Only when the markets take off and soar to heights they once imagined but did not have the courage to play will they realise the folly of their actions.
This is the first time since 2011 that we are viewing the Gold market through a positive lens. Keep in mind; there is no such thing as the perfect investment. The market by nature is imperfect; therefore you should never put all your eggs in one basket.


