Gold Market Update


We are very close to or at a major bottom in gold and silver now, regardless of the potential for another short term downleg. This is made plain by the charts we are going to look at in this update. COTs and sentiment are now at extraordinary extremes not seen in the entire history of this bullmarket. This means that when the turn really comes we are likely to see a scorching rally which will be driven by massive short covering that will leave most investors standing, mouths agape.
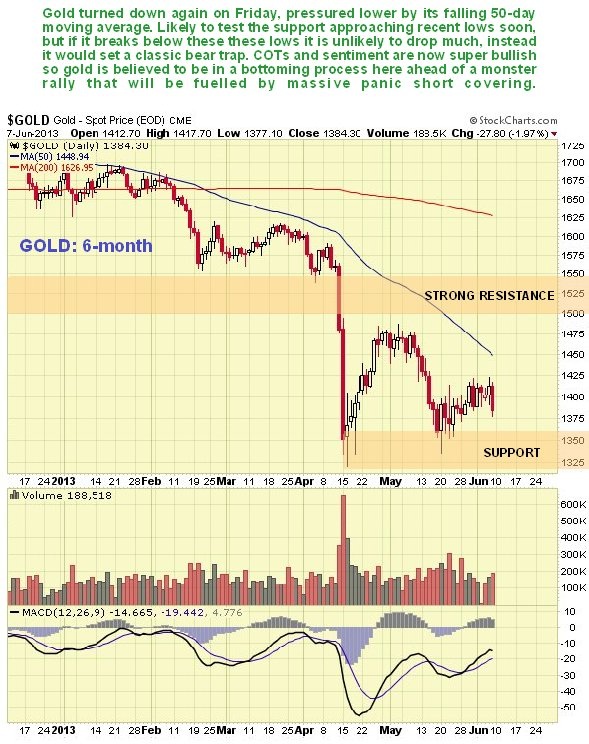
On its 6-month chart we can see gold starting to be pressured lower again by its falling 50-day moving average, after a feeble recovery rally. Although it looks set to continue lower short-term probably into the support approaching its April panic lows, for reasons that we will come to later there is considered to be a fair chance that these lows will hold, or that if the price does break to new lows, it won’t be by much before it reverses to the upside after setting a bear trap. The position of the MACD indicator, which has largely neutralized following oversold extremes, certainly allows for further downside, but at the same time gold’s overall oversold condition is shown by the large gap that has opened up between the price and its 50-day moving average, and the 200-day moving average quite far above.
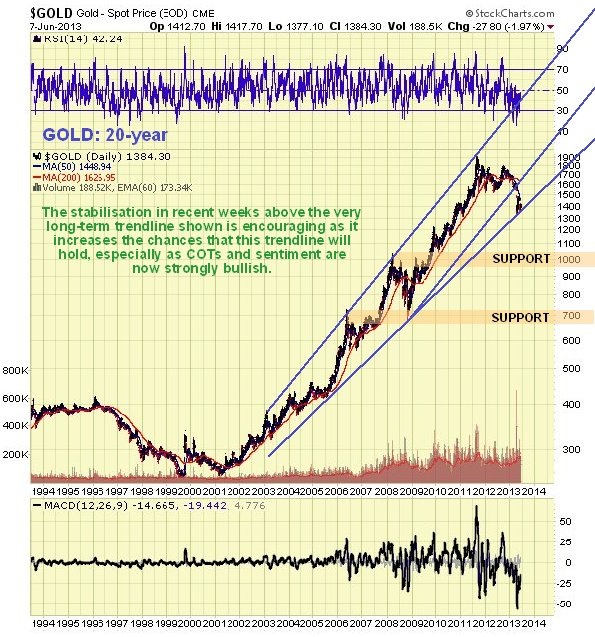
Gold’s 20-year chart is interesting as it shows that a very long-term trendline is in play that is supporting the price at about the current level. Given the now strongly bullish COTs and sentiment there is considered to be a fair chance that this trendline will cause the price to reverse to the upside very soon now. If it breaks down from this uptrend it will open up the risk of a drop to the strong support in the $1000 area, but this is considered unlikely because of the aforementioned positive COTs and sentiment.
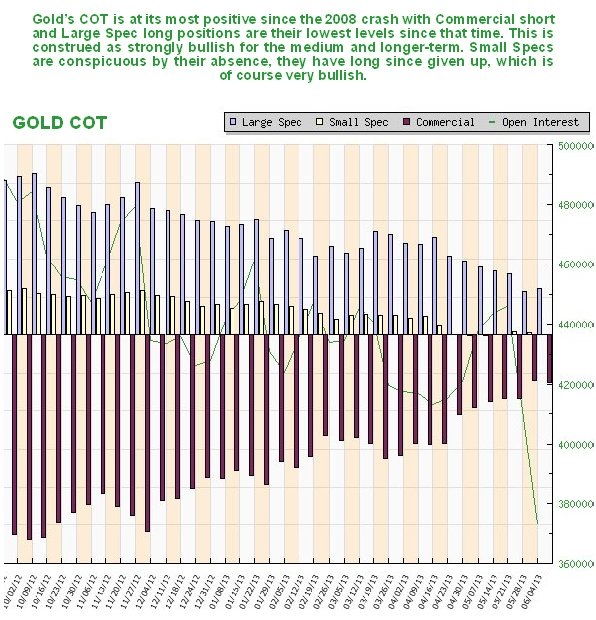
Gold’s COT structure is little changed from last week. It is still strongly bullish with the Commercials having scaled back their short positions to a very low level, and Large Spec long positions having dropped back to a low level, while Small Specs have given up on the game altogether, which is a very positive sign. The slight uptick in Commercials’ short positions last week is thought to be evidence of some position taking ahead of Friday’s drop.
The long-term COT chart looks very bullish indeed, with the Commercials having scaled back their short positions to the lowest level since the bullmarket began. Meanwhile Large Spec long positions have been reduced to their lowest level since 2008, indicating general despondency typical of a market bottom, and Small Specs have abandoned all hope, with their long positions disappearing altogether. This all pervasive negativity on the part of traders is the stuff of which important bottoms are made.
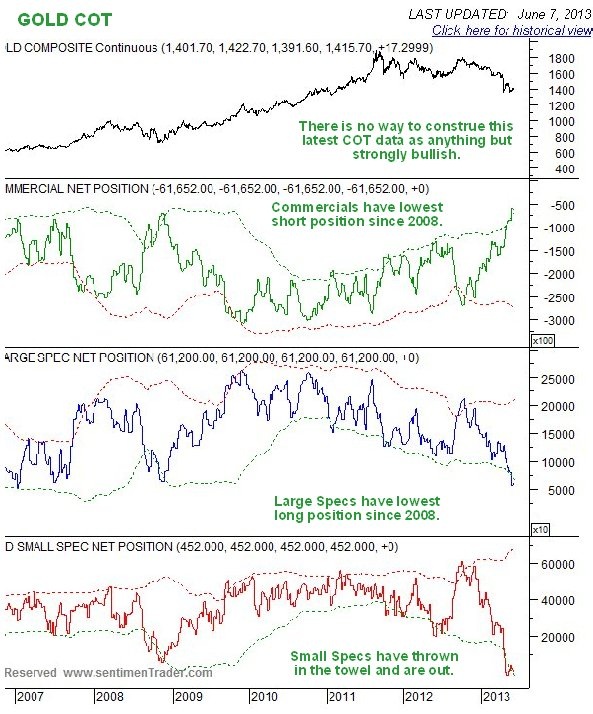
Chart courtesy of www.sentimentrader.com
Meanwhile, Hulbert Gold Sentiment is in the basement, which is bullish…
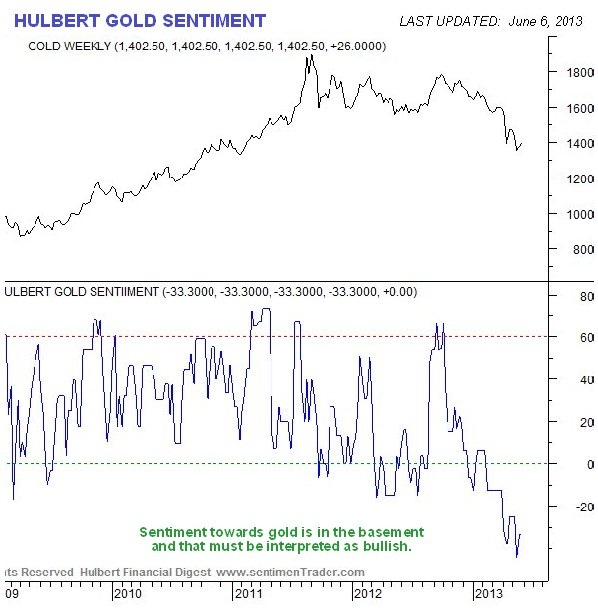
Chart courtesy of www.sentimentrader.com
The public have a low opinion of gold, another positive, as the time to buy is when most investors aren’t interested…
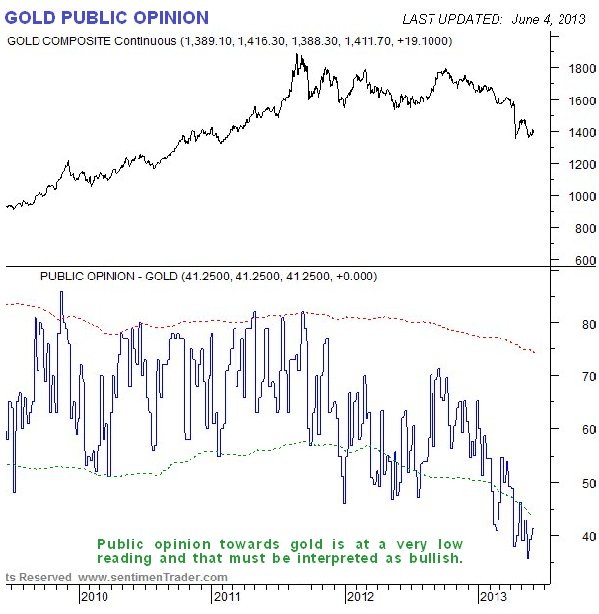
Chart courtesy of www.sentimentrader.com
The Precious Metals assets of the Rydex traders are at a very low level, which is a good sign, as they make a science of being wrong…
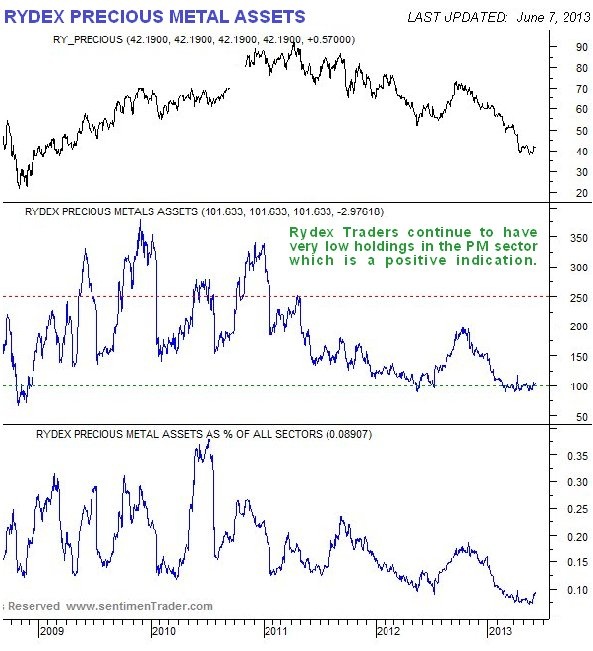
Chart courtesy of www.sentimentrader.com
The seasonal chart for gold shown below reveals that while June is overall a negative month, the best time of the year seasonally speaking is just around the corner, with August and September being the best months. The script this year could therefore involve a selloff over the short-term into a final bottom, and then a reversal and big rally in the ensuing months.
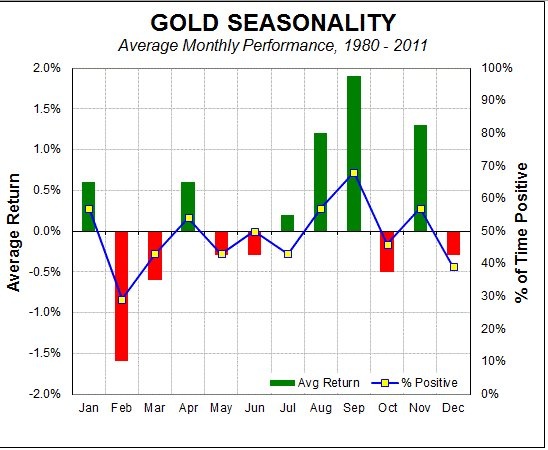
Chart courtesy of www.sentimentrader.com
The dollar’s rally reversed as predicted in the last update. After forming a choppy top area, it went into a steep decline which stopped abruptly right at important support near to its 200-day moving average on Thursday. Given the magnitude of the dollar’s decline it is surprising that gold did not fare better, and this does not bode well for gold short-term, as the dollar now looks set to bounce back, although longer-term the outlook for it is bleak.
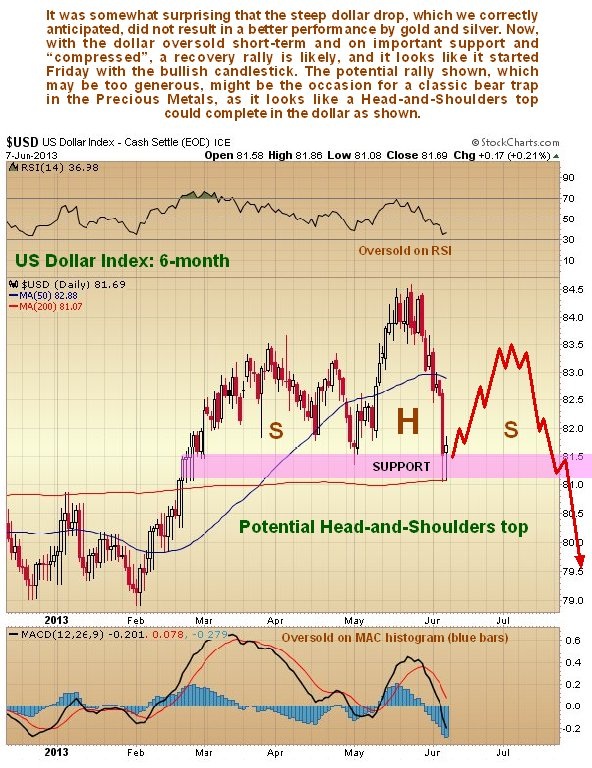
While we can all chortle with mirth at Japan’s laughable attempt to imitate the Fed by printing money recklessly – laughable because they do not have the comfy cushion of being in possession of a global reserve currency - and how they drove straight at a brick wall leading to the distinctive sound of rapidly crumpling metal. What happened in Japan to the Yen and then to the stockmarket should serve as a dire warning to the Fed of what could happen if it continues to abuse the dollar relentlessly as it has been doing. The dollar chart now looks very scary, and although it does look set to bounce back short-term from oversold, which could clobber gold and silver one last time, what looks likely to happen is that it will rally up to form the Right Shoulder of the potential Head-and-Shoulders top shown on our 6-month chart for the dollar index below. Use this as your guide for when to reverse positions – dump the dollar when it tops out at the prospective Right Shoulder high, we’ll offload our “insurance” PM sector Puts for a nice profit and we’ll go aggressively long the PM sector across the board – ETFs, better producing gold and silver miners with low or no debt, and Calls. Note here that the dollar rally up to mark out the Right Shoulder of our prospective H&S top may not get as far as shown on our chart - we could see a stunted Right Shoulder. COTs for the dollar are still extremely bearish, with Small Specs being insanely bullish, which is a huge negative.
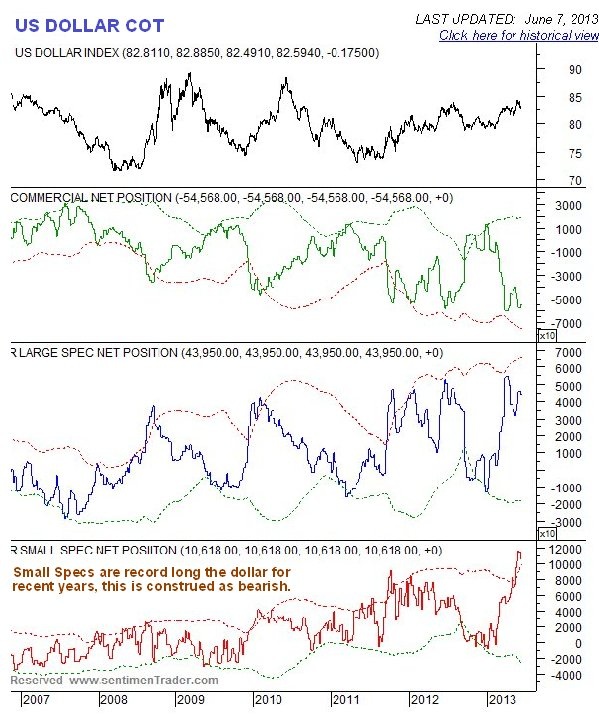
Chart courtesy of www.sentimentrader.com
US dollar Public Opinion has moderated from its earlier positive extreme which also called for the recent drop. This moderation has created room for the expected short-term relief rally to develop.
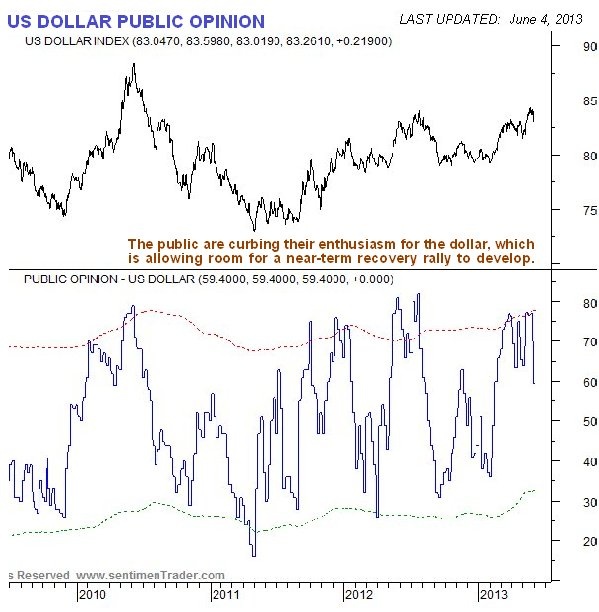
Chart courtesy of www.sentimentrader.com
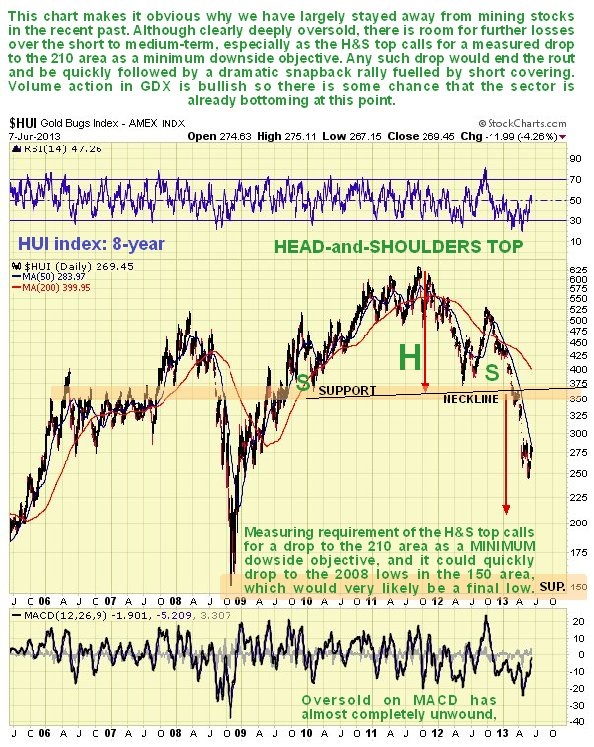
Although obviously cheap compared to last year it may still be a little early to buy PM stocks aggressively, which could easily fall victim to another short-term downleg, for reasons that are made plain by the 8-year chart for the HUI index shown below. This index broke down from a Head-and-Shoulders top earlier this year, whose minimum downside target on an equal move basis is about 210. If gold and silver drop short-term in response to a dollar bounce, they could get clobbered again, particularly as the oversold condition has unwound as is shown by the MACD indicator at the bottom of the chart having neutralized. There is some risk of them plummeting back to the vicinity of their 2008 lows. One big fundamental reason for the dreadful performance of mining stocks relative to gold is the huge increase in mining costs. However, when the turn does come a dramatic recovery is to be expected that will likely be amplified by short covering.
While mining stocks are vulnerable to further short-term losses, there is plenty of evidence that they are close to putting in a major bottom. This includes of course the positive indications that we have already looked at above for gold and silver, but also various indications that the sector is way oversold already and approaching extremes that call for a reversion to the mean.
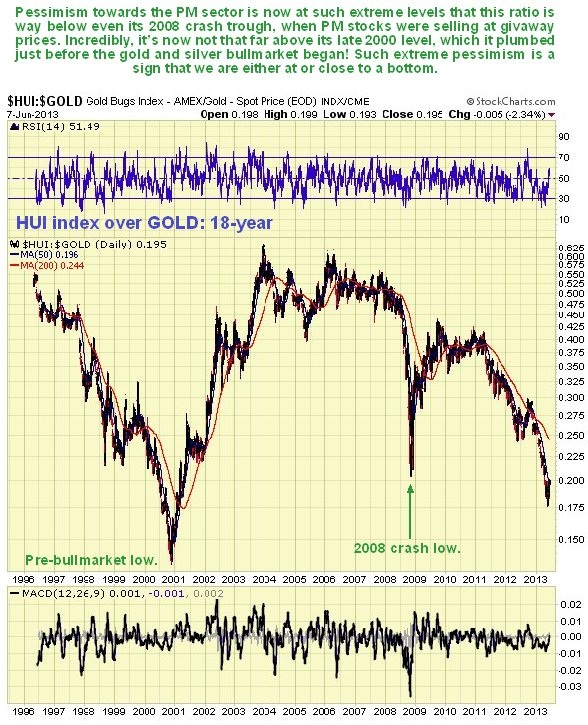
One powerful indication that the entire sector is close to a reversal is the chart below showing the ratio of the HUI index to gold. When this is at a very low level as now it shows over pessimism – when investors are scared and very negative towards the sector they favor bullion over stocks, and the more that this is the case, the more bullish it is. The situation is already really extreme, with this ratio already way below its low readings at the depths of the 2008 crash, and amazingly it is even approaching the dismal levels plumbed in late 2000 before the Precious Metals bullmarket even began. This is surely a sign that a bottom is close at hand.
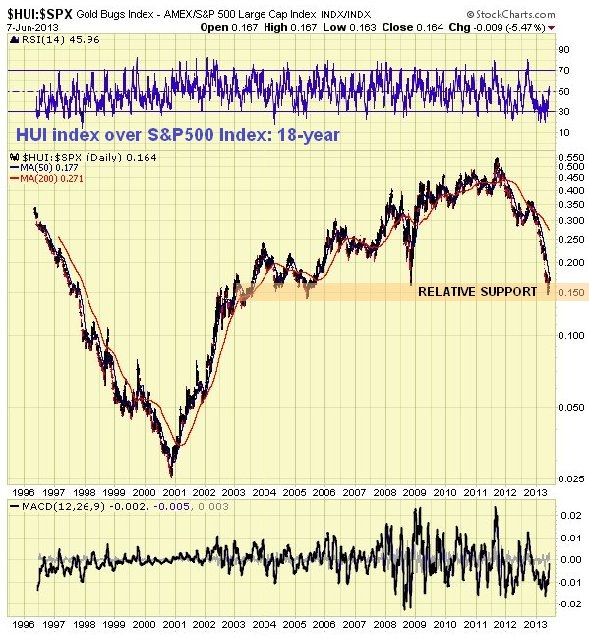
The recent rotten performance of the Precious Metals sector is made plain by the chart below showing the ratio of the HUI index to the S&P500 index over an 18-year timeframe. This chart shows that the PM sector outperformed for most of the time from late 2000 right through to 2011, only really going into reverse since the late 2011 peak. However, the dreadful performance of recent months has brought it down close to an important relative support level, where there is a strong probability that it will reverse to the upside, and thus outperform the broad market once again.
Conclusion: all of the indications are that a major PM sector reversal is imminent, but we might see one last down first, particularly by stocks. Any such drop will be viewed as throwing up a rare opportunity to buy the sector at ridiculously low prices.
Silver Market Update
Clive Maund
While silver is on the defensive short-term there is plenty of evidence that over the medium and longer-term it is setting up for a powerful rally. COT’s and sentiment are already very bullish indeed, which means that when the turn does come, the rally is likely to be accentuated by panic short covering.
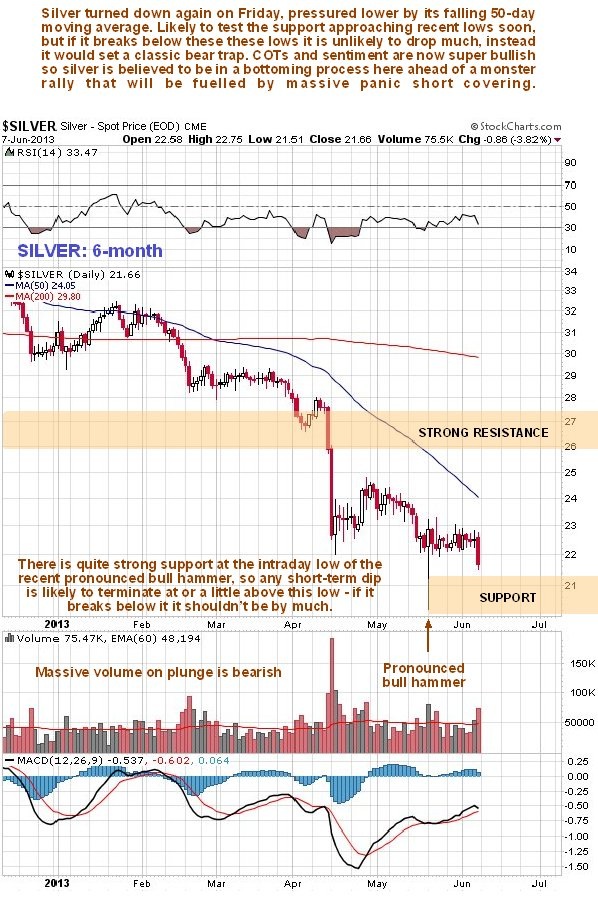
On its 6-month chart we can see how silver is being pressured lower by its falling 50-day moving average coming into play overhead, although the increasingly large gap between the 50 and 200-day moving averages is indicative of an oversold state that increasingly calls for reversal. Volume is still predominantly negative, suggesting lower prices dead ahead. After that we can expect reversal. There was a pronounced bull hammer in silver in the middle of May towards the intraday low of which there is quite strong support – silver may drop no longer than the low of this hammer.
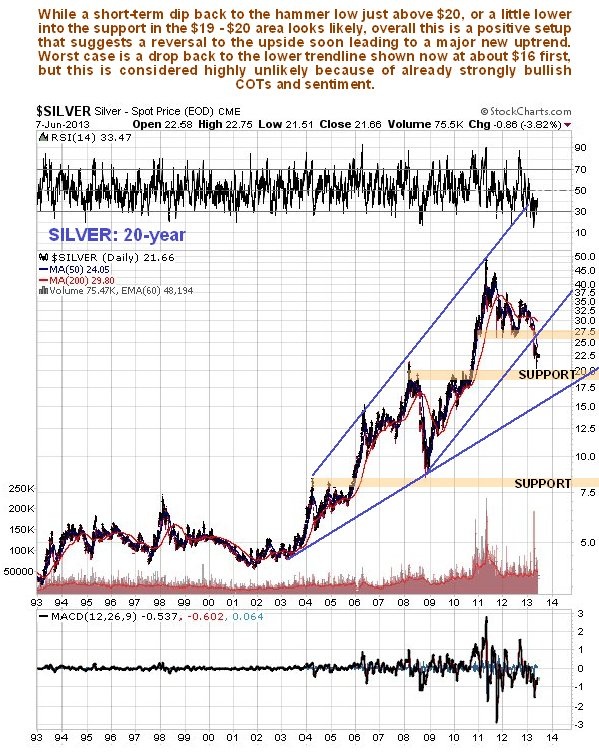
The long-term 20-year enables us to see the big picture to advantage and to determine where this correction is likely to stop. If the low of the hammer fails then the price may dip a little lower into the strong support in the extensive trading in the $17.50 - $20 zone that occurred in 2008, 2009, and the first half of 2010. There is really strong support in this zone that should turn the price back up. Worst case is a drop to the lower trendline shown now at about $16, but this is considered unlikely given the already strongly bullish COTs and sentiment.
The retreat this year has given Big Money, the Commercials and the like, the opportunity to cover almost all of their shorts for a nice fat profit, and has left the dumb Large Specs smarting from huge losses. The COT chart shown below reveals that the Commercials have almost completed the process of unloading their short positions. The media driven Large and Small Specs, the “victims”, are totally discouraged and largely out. These are the lowest readings we have seen since the Precious Metals bullmarket started in the early 00’s and needless to say this is now a powerfully bullish situation. It is now only a matter of time, and not much at that, before we see a dramatic reversal to the upside.
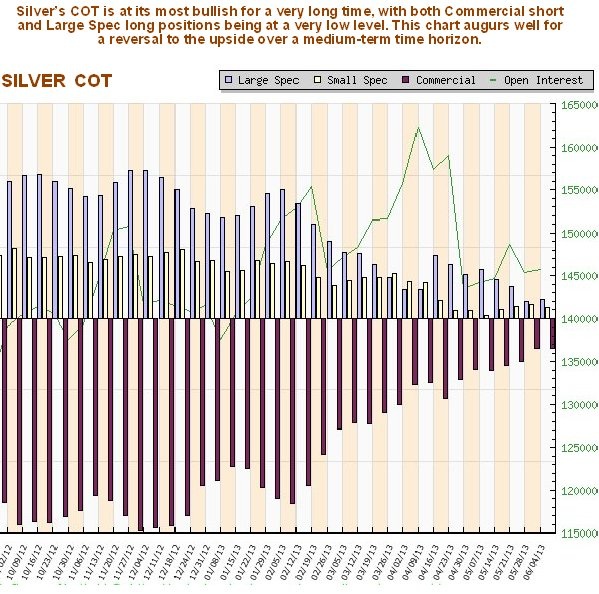
The longer-term COT chart shown below provides additional perspective and on it we can see that the Commercials’ short positions have dropped to a very low level indeed – even lower than the freak market crash low of 2008. Meanwhile the habitual losers, the Large and Small Specs, are cowering in the corner licking their wounds, beset with timidity having reduced their long positions to very low levels. We are back at the starting line again with the stage being set for another major uptrend.
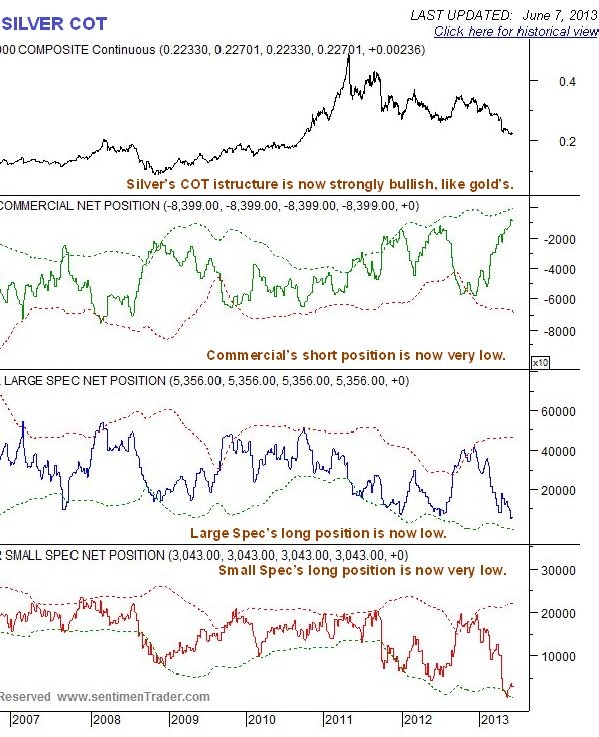
Chart courtesy of www.sentimentrader.com
Thus it should come as no surprise to see that Public Opinion on silver is now at a very low ebb.
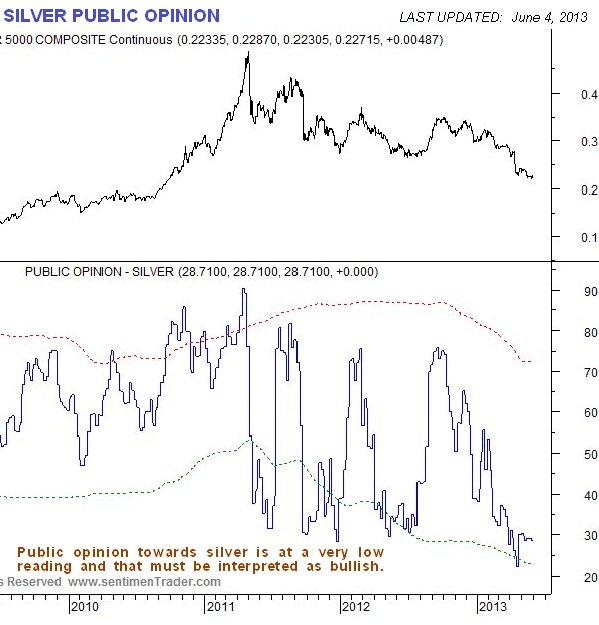
Chart courtesy of www.sentimentrader.com
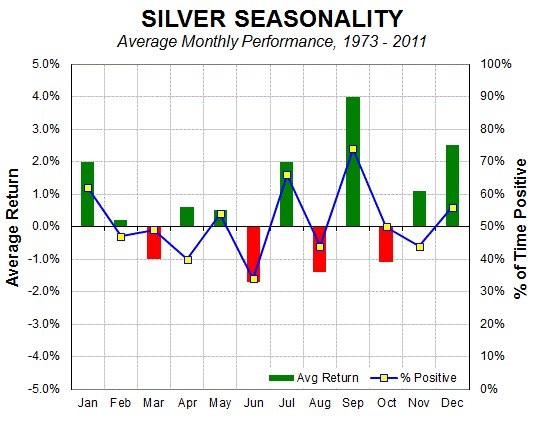
In the context of all that we have observed above, the silver seasonal chart is most interesting. For it reveals that June is the weakest month for silver, on a generalized seasonal basis, but after that, things look up in July and especially in September. What we can infer from this is that any short-term weakness over coming days and perhaps extending to 2 or 3 weeks should be seized upon as presenting a major buying opportunity. We will use this window of opportunity if it occurs as the perfect time to load up with a range of silver ETFs, better silver stocks – producers with little or no debt and Call options.
Clive Maund, Diploma Technical Analysis
No responsibility can be accepted for losses that may result as a consequence of trading on the basis of this analysis.

Clive P. Maund’s interest in markets started when, as an aimless youth searching for direction in his mid-20’s, he inherited some money. Unfortunately it was not enough to live a utopian lifestyle as a playboy or retire very young. Therefore on the advice of his brother, he bought a load of British Petroleum stock, which promptly went up 20% in the space of a few weeks. Clive sold them at the top…which really fired his imagination. The prospect of being able to buy securities and sell them later at a higher price, and make money for doing little or no work was most attractive – and so the quest began, especially as he had been further stoked up by watching from the sidelines with a mixture of fascination and envy as fortunes were made in the roaring gold and silver bull market of the late 70’s.
Clive furthered his education in Technical Analysis or charting by ordering various good books from the US and by applying what he learned at work on an everyday basis. He also obtained the UK Society of Technical Analysts’ Diploma.
The years following 2005 saw the boom phase of the Gold and Silver bull market, until they peaked in late 2011. While there is ongoing debate about whether that was the final high, it is not believed to be because of the continuing global debasement of fiat currency. The bear market since 2011 is viewed as being very similar to the 2-year reaction in the mid-70’s, which was preceded by a powerful advance and was followed by a gigantic parabolic price ramp. Moreover, Precious Metals should come back into their own when the various asset bubbles elsewhere burst, which looks set to happen anytime soon.
Visit Clive at his website: CliveMaund.com


