Gold Price Forecast – Gold's New High, USDX And Reversals


The gold hype is impossible to miss as its steep rise brought it above the 2011 all-time highs. But is the picture seen in precious metals one of universal strength? That, and the USD Index prospects, is what we'll examine in today's article.
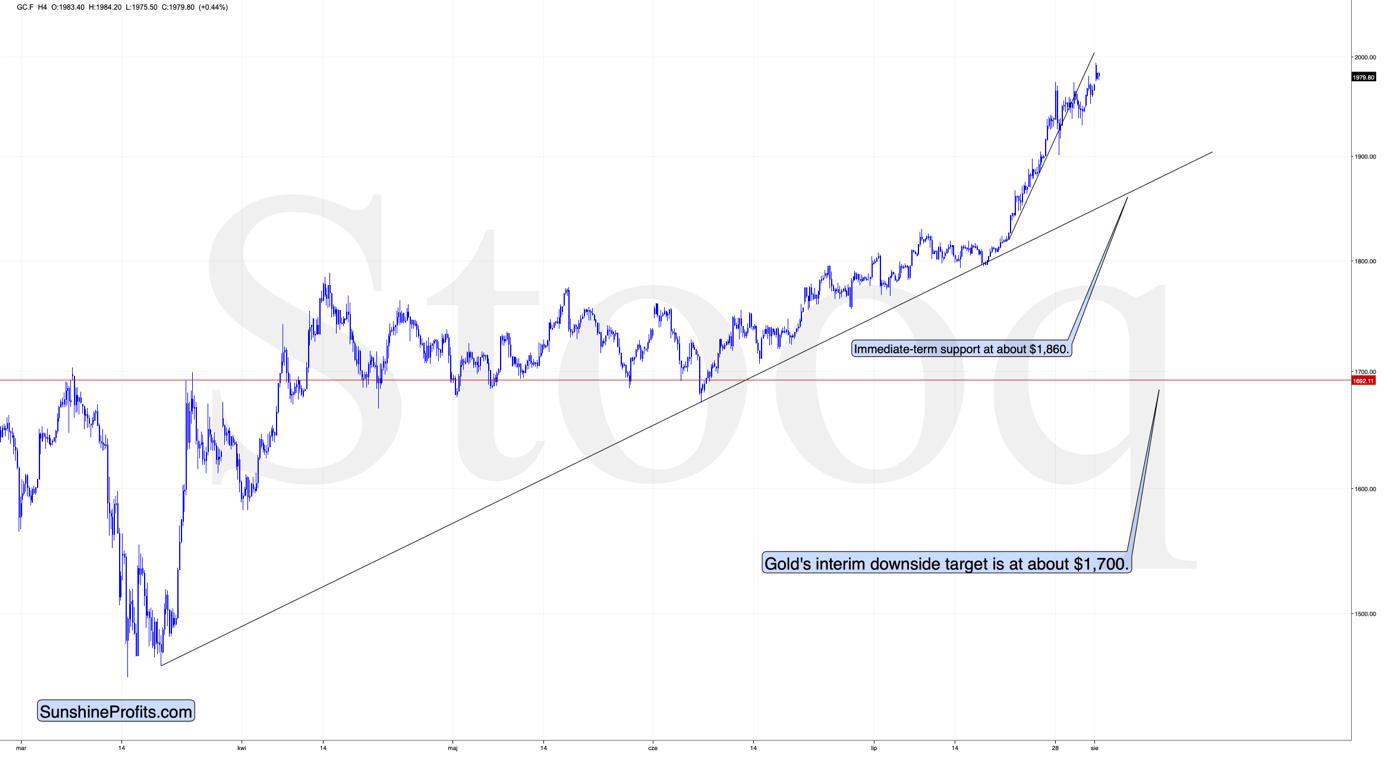
Gold just moved above its previous 2020 high in a volatile manner mere just minutes after writing this, the yellow metal moved back below this level, thus invalidating the breakout.
The invalidation of the breakout is a bearish sign, but at the same time, one should keep in mind that the breakout above the 2011 high was already confirmed. The latter is very bullish.
Still, given what’s going on in the USD Index – its own breakout – it seems that one should wait to see how gold really reacts to USD’s strength before predicting that there will be no corrective downswing based on gold’s breakout above the 2011 highs.
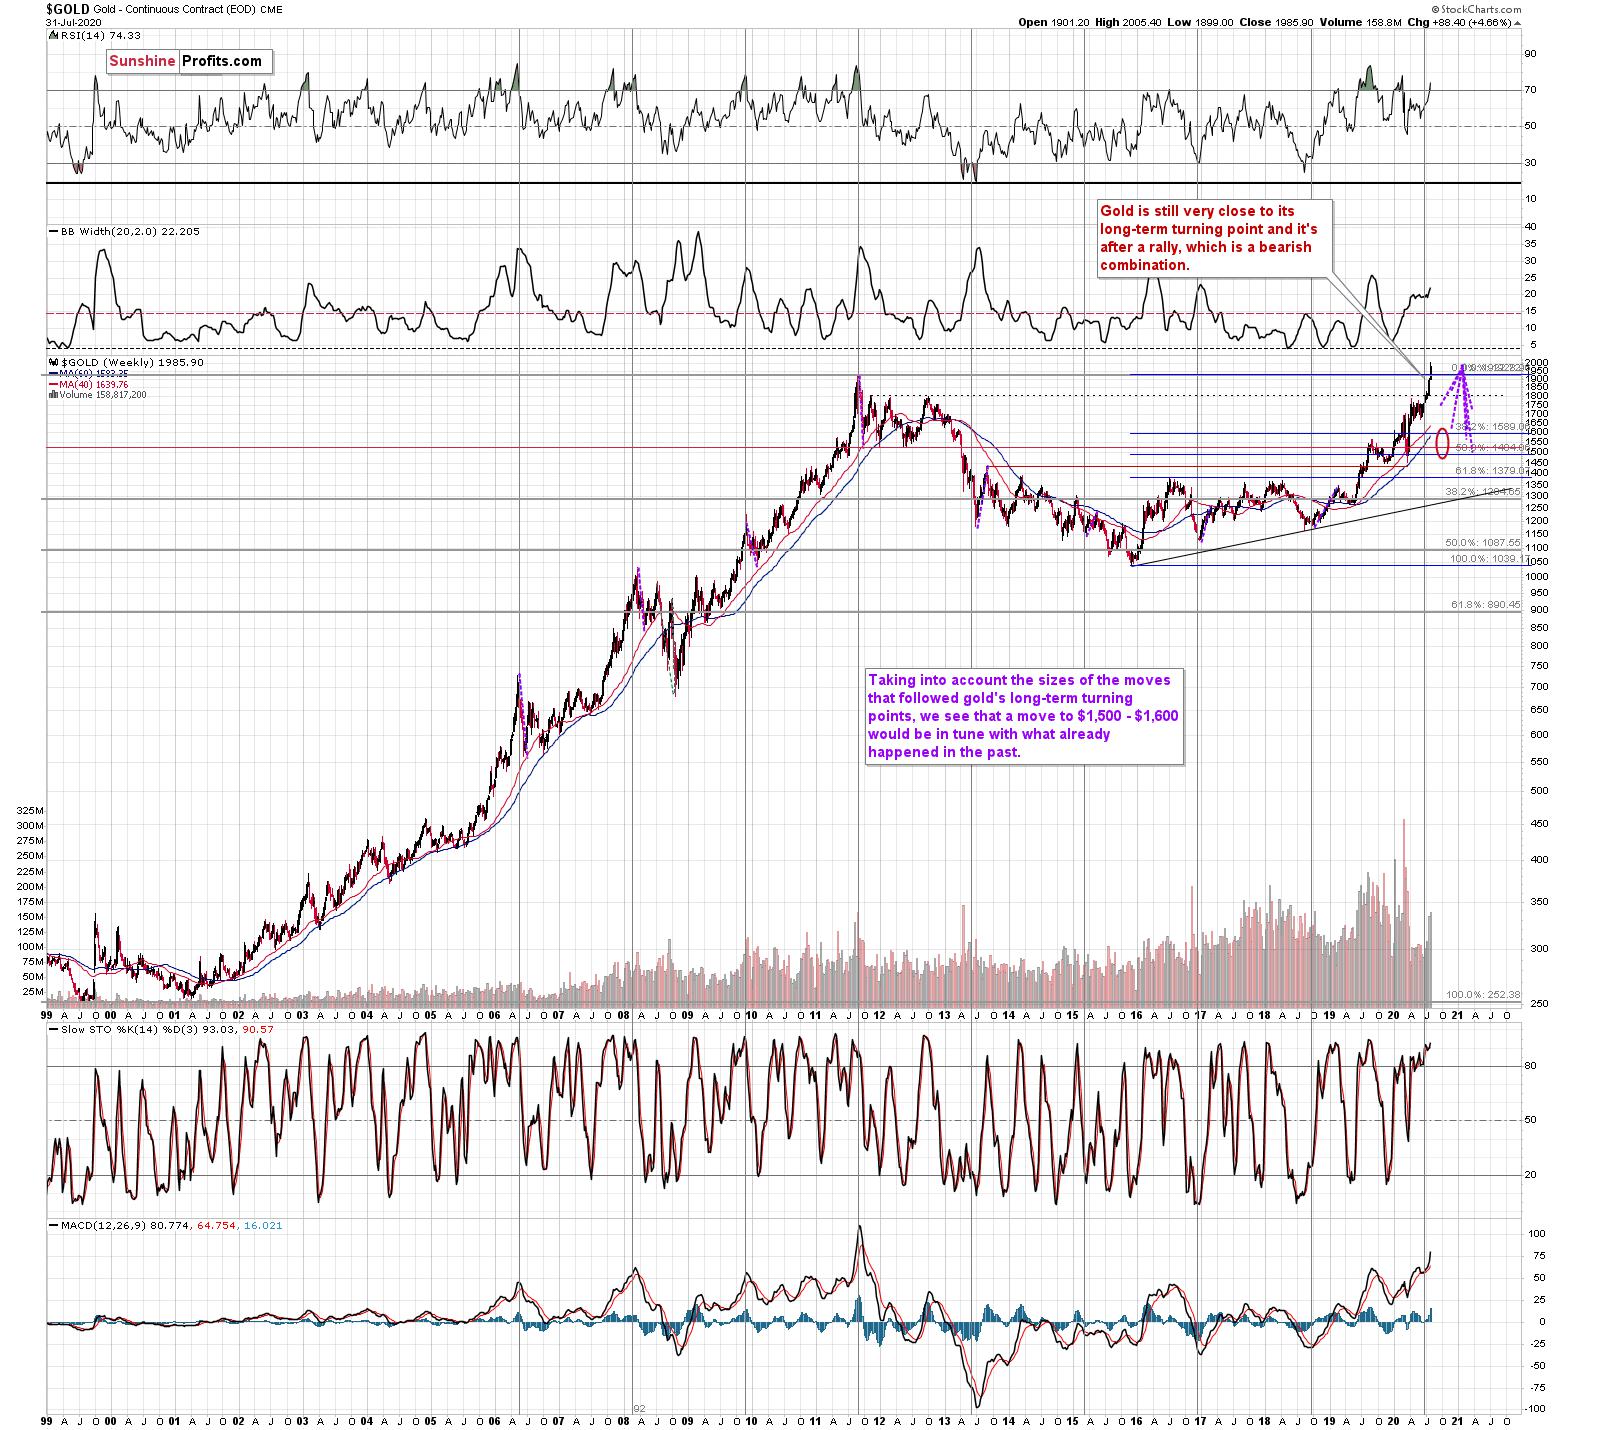
Gold’s very long-term turning point is here and since the most recent move has definitely been to the upside, its implications are bearish.
We used the purple lines to mark the previous price moves that followed gold's long-term turning points, and we copied them to the current situation. We copied both the rallies and declines, which is why it seems that some moves would suggest that gold moves back in time - the point is to show how important the turning point is in general.
The big change here is that due to gold’s big rally, we moved our downside target for it higher. Based on the information that we have available right now, it seems likely that gold will bottom in the $1,500 - $1,600 area. That’s very much in tune with how much gold moved after the previous long-term turning points. It’s also very much in tune with how low gold moved in 2011 after trying to break above $1,900.
Also, while we’re discussing the long-term charts, please note the most important detail that you can see on the gold, silver, and mining stock charts, is hidden in plain sight. Please note how much silver and miners rallied.
Gold just moved above its 2011 high. And silver?
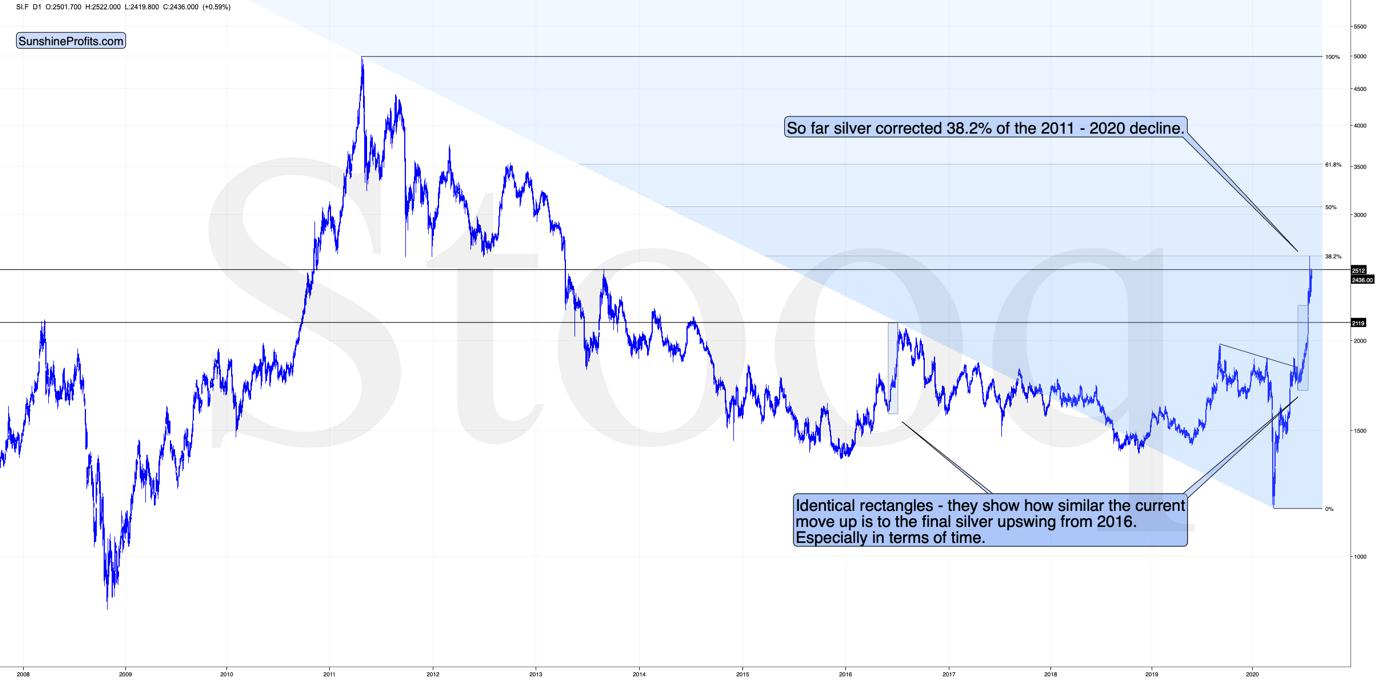
Silver corrected to the first of the classic Fibonacci retracement levels (38.2%) based on the entire 2011 – 2020 decline. And then it moved lower – back below its late-2013 high.
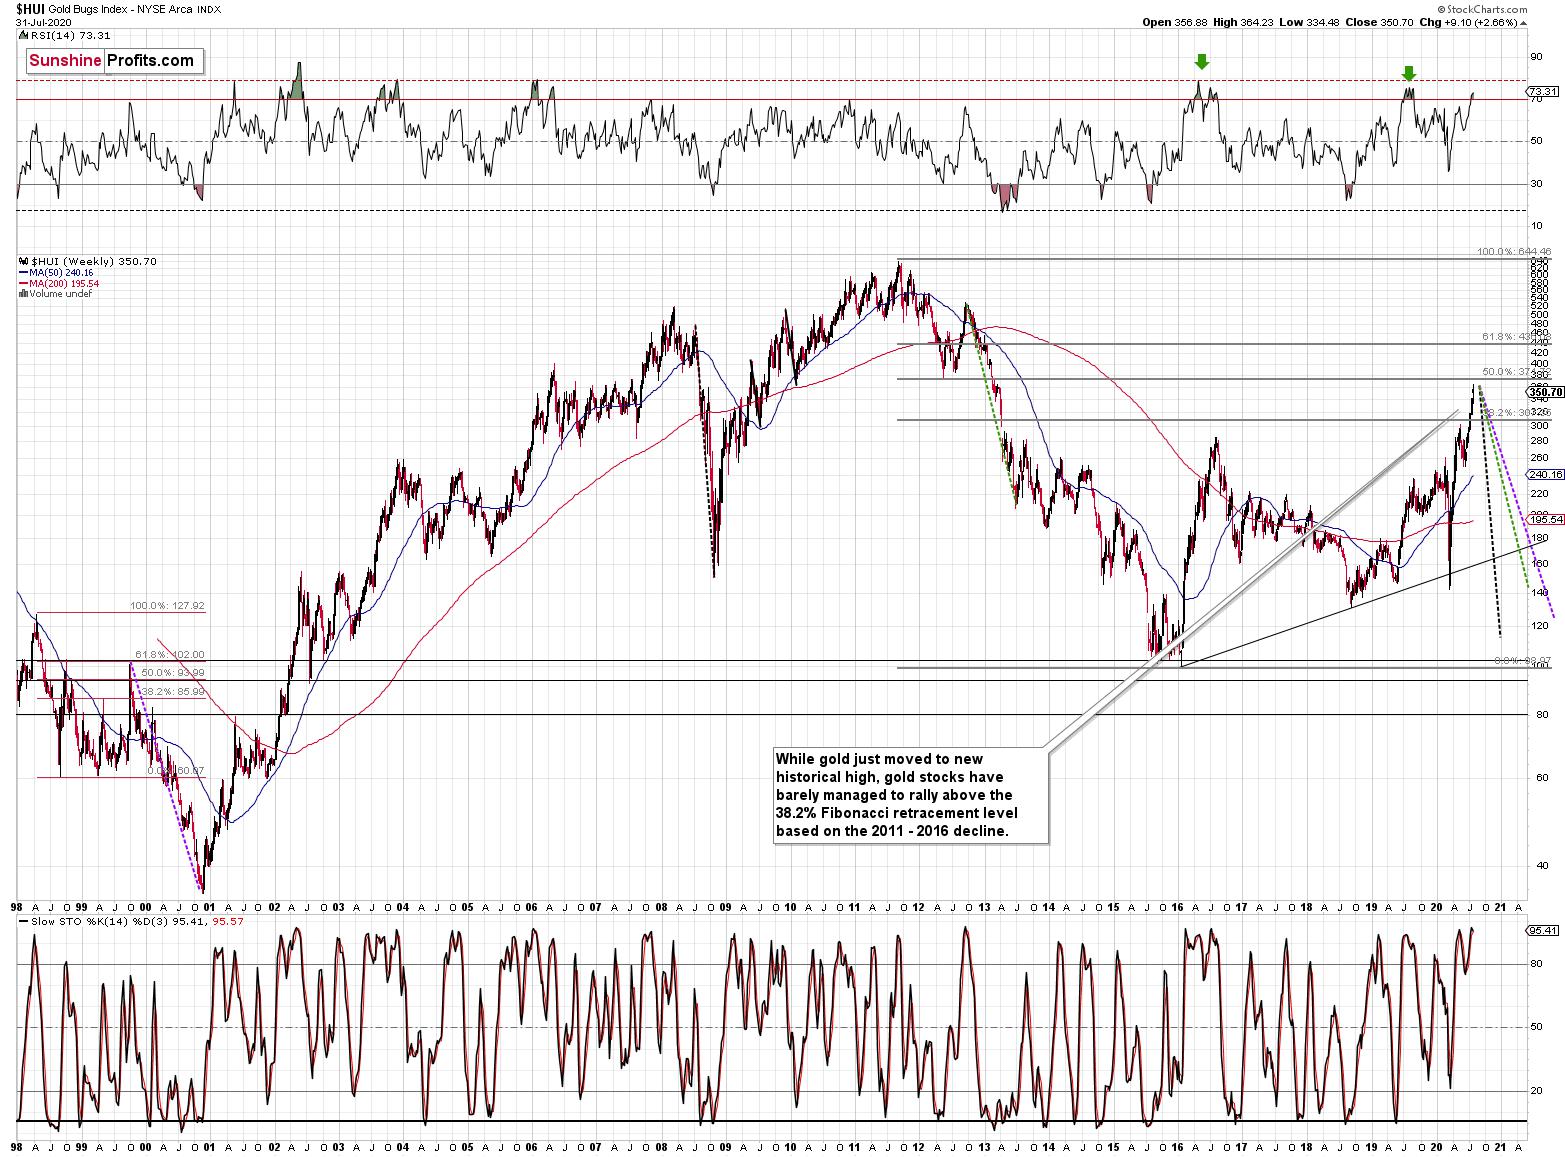
Meanwhile, despite their recent run-up, gold stocks – HUI Index – are just a bit above the 38.2% Fibonacci retracement based on the 2011 – 2016 decline. They didn’t correct half of the decline so far.
It’s mostly gold that is making the major gains – not the entire precious metals sector.
Moving back to silver’s forecast, it’s good to note that the time the current rally is taking, is still very similar to the time that the final part of the 2016 run-up took. The current move is bigger, but in terms of time, they are still very alike. This adds to the bearish implications of the situation in the USD Index and gold miners’ extremely overbought condition along with their vertex-based reversal that’s due today or tomorrow.
Summary
For all the animal spirits running high on gold's new all-time high, we better not ignore the situation in the greenback – it's ripe for an upside reversal. Also, beware of the turning points – gold's very long-term one is here.
The following days are not likely to be pleasant times for anyone who refuses to jump on the bullish bandwagon just because prices moved higher in the previous months. But what’s profitable is rarely the thing that feels good initially. As silver often moves in close relation to the king of metals, forecasting gold’s rally without a bigger decline first is thus likely to be misleading. The times when gold is trading well above the 2011 highs will come, but they are unlikely to be seen without being preceded by a sharp drop first.
Naturally, the above is up-to-date at the moment of publishing and the situation may – and is likely to – change in the future. If you’d like to receive follow-ups to the above analysis, we invite you to sign up to our gold newsletter. You’ll receive our articles for free and if you don’t like them, you can unsubscribe in just a few seconds. Sign up today.
Przemyslaw Radomski, CFA
Editor-in-chief, Gold & Silver Fund Manager
Sunshine Profits - Effective Investments through Diligence and Care
* * * * *
All essays, research and information found above represent analyses and opinions of Przemyslaw Radomski, CFA and Sunshine Profits' associates only. As such, it may prove wrong and be subject to change without notice. Opinions and analyses are based on data available to authors of respective essays at the time of writing. Although the information provided above is based on careful research and sources that are deemed to be accurate, Przemyslaw Radomski, CFA and his associates do not guarantee the accuracy or thoroughness of the data or information reported. The opinions published above are neither an offer nor a recommendation to purchase or sell any securities. Mr. Radomski is not a Registered Securities Advisor. By reading Przemyslaw Radomski's, CFA reports you fully agree that he will not be held responsible or liable for any decisions you make regarding any information provided in these reports. Investing, trading and speculation in any financial markets may involve high risk of loss. Przemyslaw Radomski, CFA, Sunshine Profits' employees and affiliates as well as members of their families may have a short or long position in any securities, including those mentioned in any of the reports or essays, and may make additional purchases and/or sales of those securities without notice.
 Przemyslaw Radomski, CFA, is the founder, owner and the main editor of SunshineProfits.com. You can reach Przemyslaw at: http://www.sunshineprofits.com/help/contact-us/.


