Gold Silver Ratio Update


 It’s time to check on how the venerable gold-silver ratio is doing since we last spoke on it. A look at the monthly OHLC price over the last twenty years is shown below with its 20 month moving average as well as the line chart of silver.
As you can see, the formula for the last fifteen years is almost robotic. When the ratio hits around 80 and drops below its 20 month moving average, a silver (and gold) bull market is upon us. When the ratio stays above the 20 month moving average, a silver bear market persists.
The ratio hit 79.9 back in August 2015 and ever since a line of resistance has ensued as the ratio drew back to the 20 month moving average, failed to drop below it and then went back up to retest the 80 level.
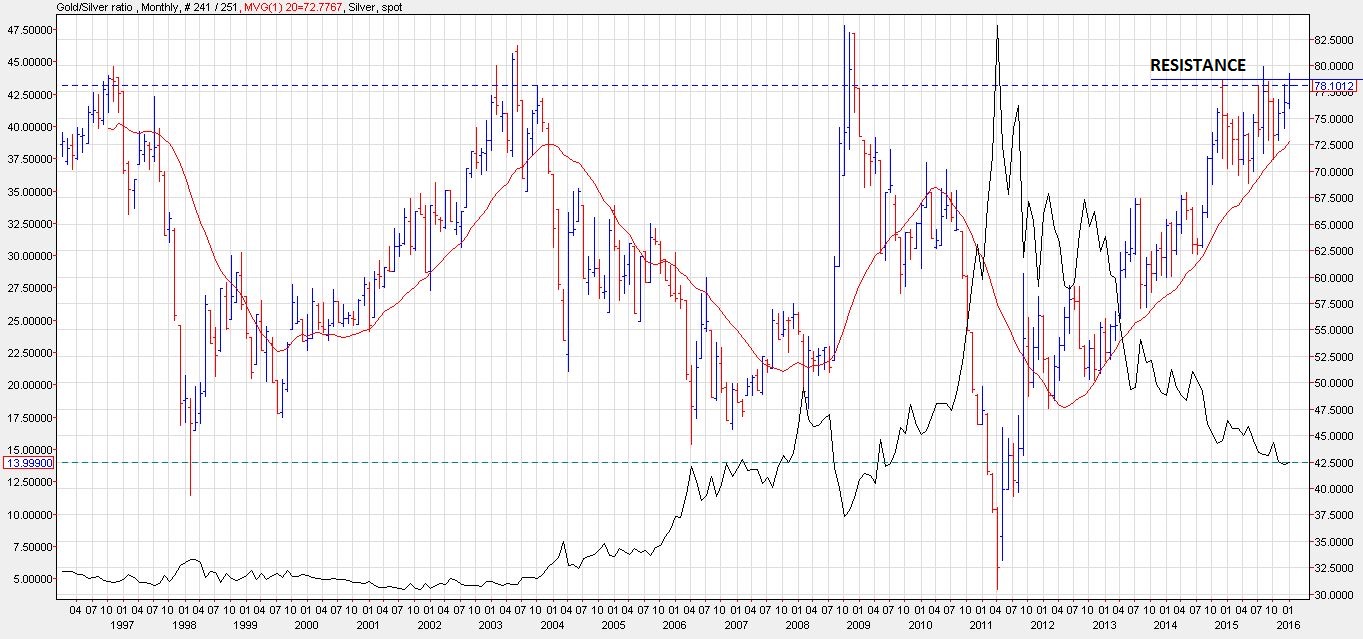
This time of retrenchment is somewhat of a frustration as gold and silver inch lower in proportion (hence the tight range of the ratio) with no resolution either way in terms of a climatic drop or a heraldic surge announcing the new precious metals bull market which shall suitably distract us into the next decade.
Nevertheless, this long line of resistance shown in the chart is something of an encouragement as a breakout would be bearish for silver. Having thus far tested the line again this month at 79.26, it is our anticipation that it will again drop back towards the moving average somewhere in the low 70s and again raise the anticipation of a silver surge.
Further analysis of silver can be had by going to our silver blog at http://silveranalyst.blogspot.com where readers can obtain subscription details for the Silver Analyst newsletter. Comments and questions are also invited via email to [email protected].
More from Gold-Eagle


