Gold & Silver Update


Arguments for lower prices
- Gold overall still in a downtrend. US$1,525 is the line in the sand. Gold will need much more time to break through this heavy resistance.
- MACD sell signal on monthly chart still active.
- MACD sell signal on the daily chart active since early September.
- RSI on the weekly chart rolling over
- Fibonacci support from the rally into the highs in late august around US$1,270.00 more or less broken.
- HUI Gold Bugs Index did not confirm Gold´s recent high at US$1,432.00.
- HUI Gold Bugs Index testing the June lows already.
- Seasonality for October is not good. As well during bear market years rally attempts tend to be muted in autumn.
- ETF Gold demand continues to be very weak.
- The Indian government continues to fight against Gold.
- Despite a weak US-Dollar and positive seasonality Gold was not able to rally.
- CoT-Report from 09/24/13 for the Euro: Commercials heavily increased Euro short-position during the last couple of weeks.
Arguments for higher prices
- MACD buy signal on the weekly Gold chart still active.
- Last Friday Gold closed below lower Bollinger-Band (US$1,270.13). This a situation where professional traders cover their shorts as prices tend to stay below Bollinger Band only 2,5% of the time.
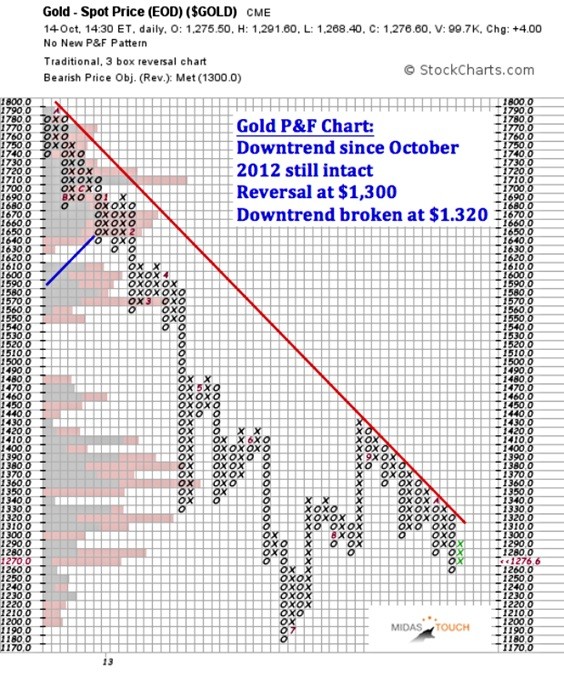
- P&F-Chart for Gold does not look that bad. A daily close above US$1,320.00 and the downtrend since October 2012 is broken.
- There was no COT report this week and last week, but commercial short position should be even lower now and therefore bullish.
- Extreme constellation in sentiment towards Gold and Silver. Gold is hated. As my colleague Alan Micik (The Micik Market Letter ) pointed out: "On a Long-term and/or Intermediate-term basis Gold is now in the final psychological “low” phase of despondency and depression based on the cycle of market emotions".
- Despite seasonal cycle for precious metals remaining down until end of October the lows in bear-market years often come in around October/November in Gold.
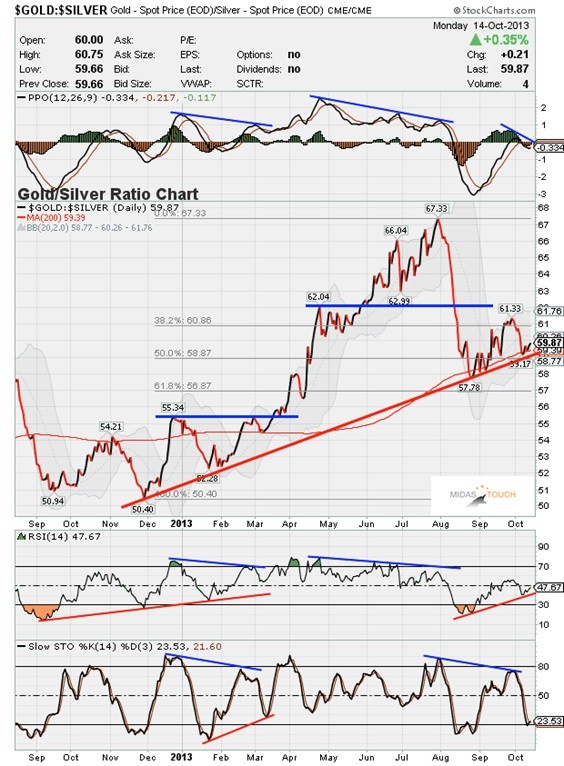
- Silver stronger than gold. Silver topped 4 months before Gold in 2011. Silver still maintains a pattern of higher lows and a rising 50 day MA even after two months of downtrend, so it is not beyond the realm of possibility that silver ends up dragging gold back up. Gold/Silver Ratio Chart looks promising. A break below 58.80 gives a new buy signal for the whole sector.
- Today HUI Goldbugs index stronger than Gold and with potential W-Double-Bottom-Formation.
- US-Dollar trading below its 50-MA (81.15) and below its 200-MA (81.78). Death cross now clearly in place on the daily US-Dollar chart.
- US-budget theatre continues.
- The Fed will continue with QE and might even increase it.
Conclusion
- Despite the long-term positive fundamentals for Gold & Silver the technical picture continues to be quite challenging.
- The chances for a surprising turnaround and a new rally are pretty high due to the extraordinary depressive sentiment in Gold. But there is no indication on the charts so far. A daily close above US$1,320 would be extremely bullish and a clear buy signal on the P&F chart.
- A daily close below US$1,265 instead would signal that the bear-market continues and would point to a test of the June-lows at US$1,180.
- Short-term this continues to be a tricky situation. My advice for traders would be to wait patiently at the sidelines until the picture becomes clearer. Focus on the buy trigger at US$1,320 and as well on the sell trigger at US$1,265. In the meantime be patient.
- Investors with a long-term perspective should continue to accumulate physical Gold and Silver while they are hated and cheap.
Long-Term
- Nothing has changed
- Precious Metals bull market continues and is moving step by step closer to the final parabolic phase (could start in summer 2014 and last for 2-3 years or maybe longer)
- Price target Dow Jones/Gold Ratio approaching 1:1
- Price target Gold/Silver Ratio approaching 10:1
- Fundamentally, Gold is now starting to move into the final 3rd phase of this long-term bull market. 1st stage saw the miners closing their hedge books, 2nd stage continuously presented us news about institutions and central banks buying or repatriating gold. The evolving 3rd and finally parabolic stage will end in the distribution to small inexperienced new investors who will be subject to blind greed and frenzied panic.
********
Germany
E-Mail: [email protected]
Website: www.goldnewsletter.de
 Florian Grummes (born 1975 in Munich) has been studying and trading the Gold market since 2003. In 2008 he started publishing a bi-weekly extensive gold analysis containing technical chart analysis as well as fundamental and sentiment analysis. Parallel to his trading business he is also a very creative & successful composer, songwriter and music producer. You can reach Florian at: [email protected].
More from Gold-Eagle


