Gold’s Rise Irrespective Of Deflation-Inflation In 2020


Gold’s Rise Is Cyclical
There has been lots of discussion on rise of gold price as related to inflation or to deflation. In this article, we will state our own firm belief based on our technical analysis both for near term and for long term.
Here are our conclusions:
- Gold’s rise since 2020 is inevitable and cannot be stopped. On a high level, gold’s rise over the past century is truly cyclical in nature.
- On a near term basis, gold’s rise can be attributed principally to the printing press of our Federal government. The recent Covid-19 virus pandemic just triggered the trend.
This week Fed chair Jerome Powell admitted at his press conference that the recovery will take a long time. So he will keep the interest rates low and will continue to use the monetary tool kit, i.e. resort to the printing press. Let us examine how effective is the printing press so far.
Solving Printing Mystery
Chart 1 – Money Circulation (M2V) Coming to Halt
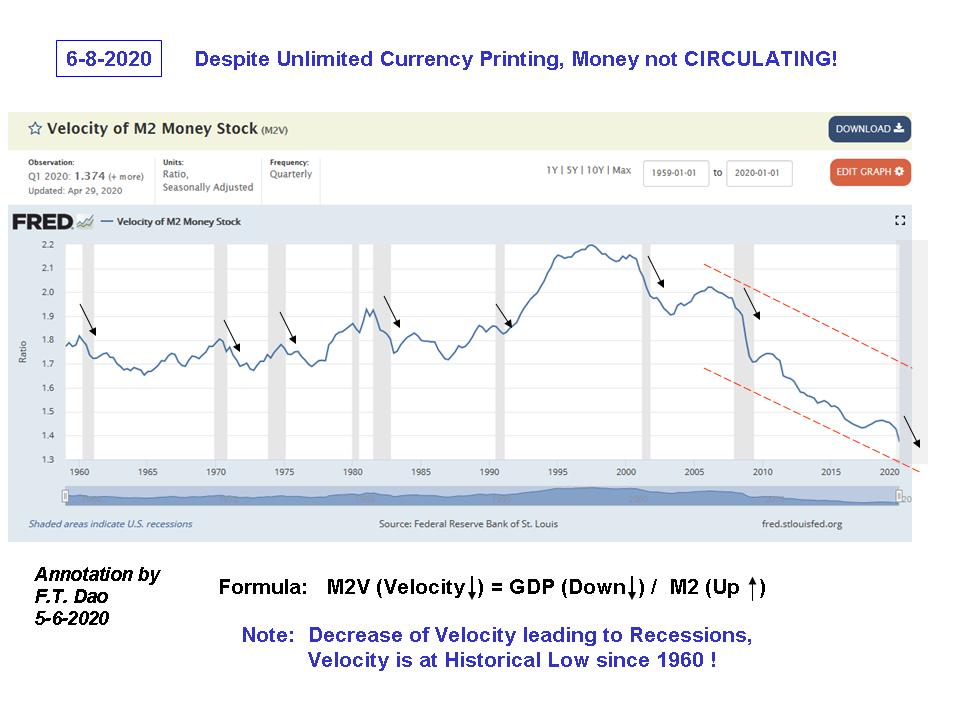
Clearly the printing process is not effective, as measured by the slowing rate of currency circulation. This showed an environment of depression and not inflation we are facing.
Next we examine two historical charts on the Velocity of Money, along with another measure on the total Monetary Base (M2).
Broad Perspective A: Money Velocity
We first compare WPM and the silver miner SIL ETF. Since 2016, WPM has out-performed SIL. There are 2 red lines of demarcation: 2016 line when the gold and silver price started to rise; and 2019 line when Convid-19 pandemic started to spread from Wuhan, China.
Chart 2 – Century View of Money Velocity: 1910 - 2020
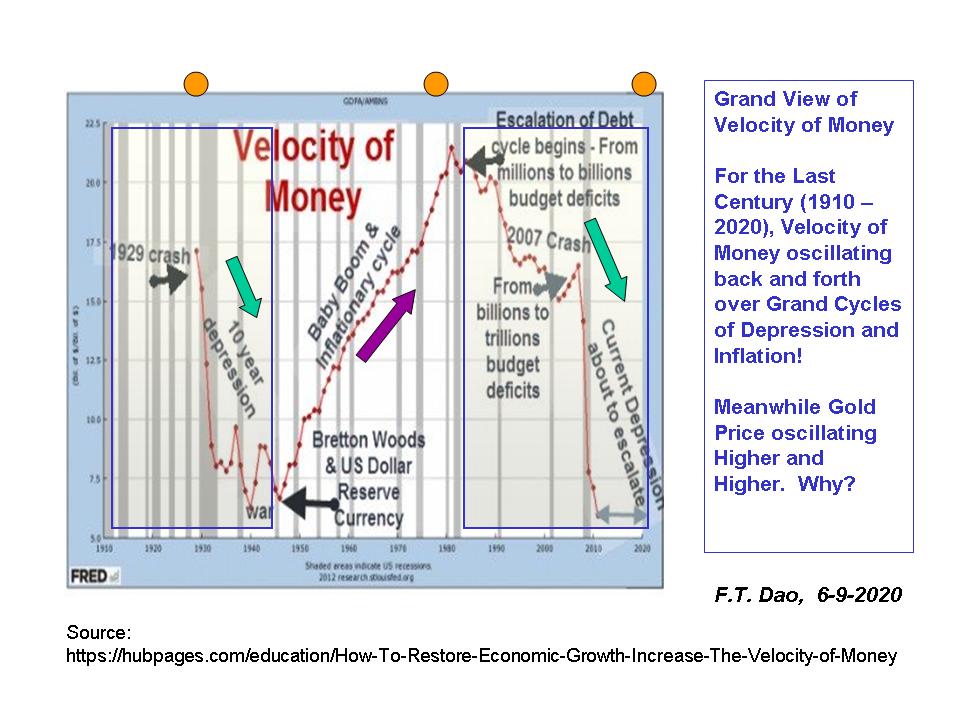
The above chart clearly showed the big cyclical nature of depression and inflation over the last century. We are currently in the same depression cycle as that of 1929 time period.
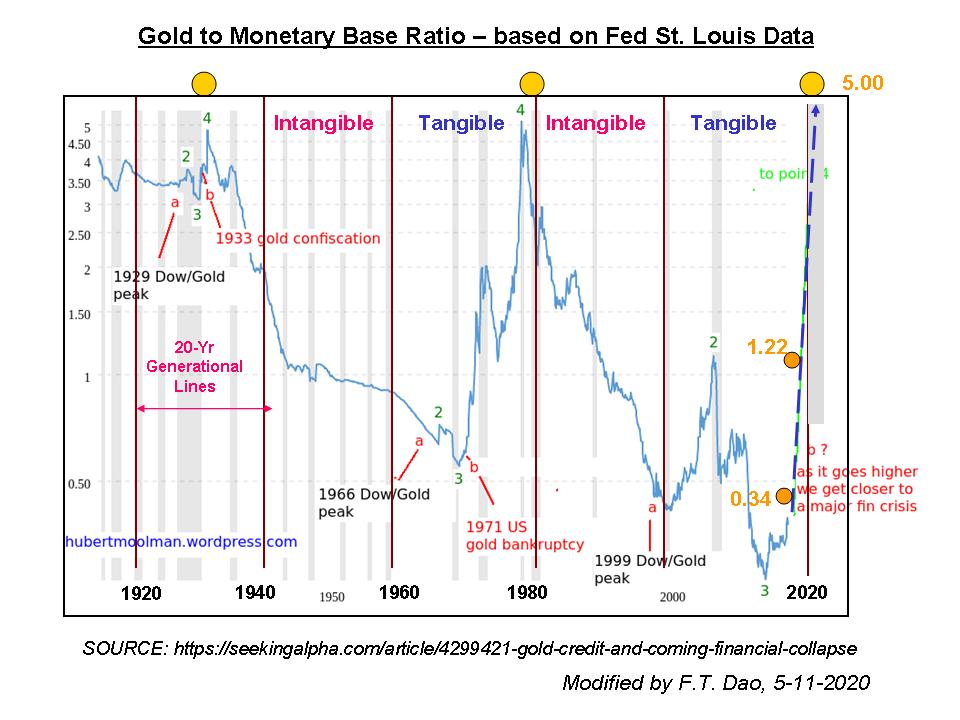
Broad Perspective B: Money Printing Base
The following chart compared the printing volume, adjusted by the total gold inventory base. The orange circles marked the same periods as those in the Velocity of Money chart in the above section.
Do we find an interesting dichotomy in that one keeps printing and the money circulating less and less?
Chart 3 – Century of Gold & Money Printing: 1910 - 2020
Analyzing Gold Price over Time
As we mentioned earlier, the gold price is destined to rise higher and higher in foreseeable future. Our analyses are presented in two following charts.
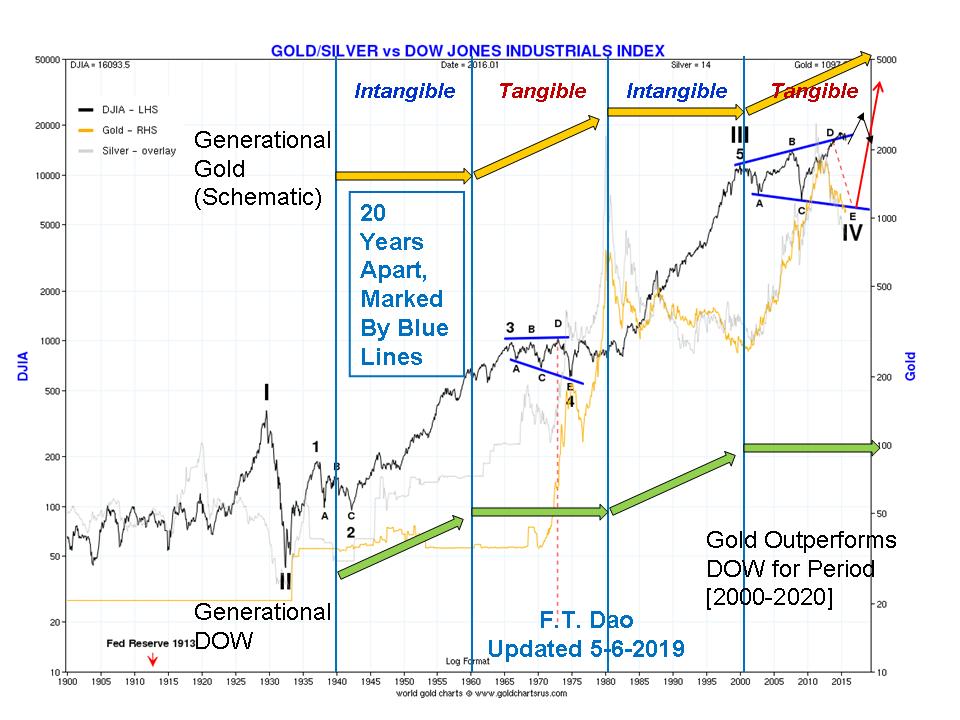
Chart 4 – Generational Cycles of Tangible & Intangible Assets
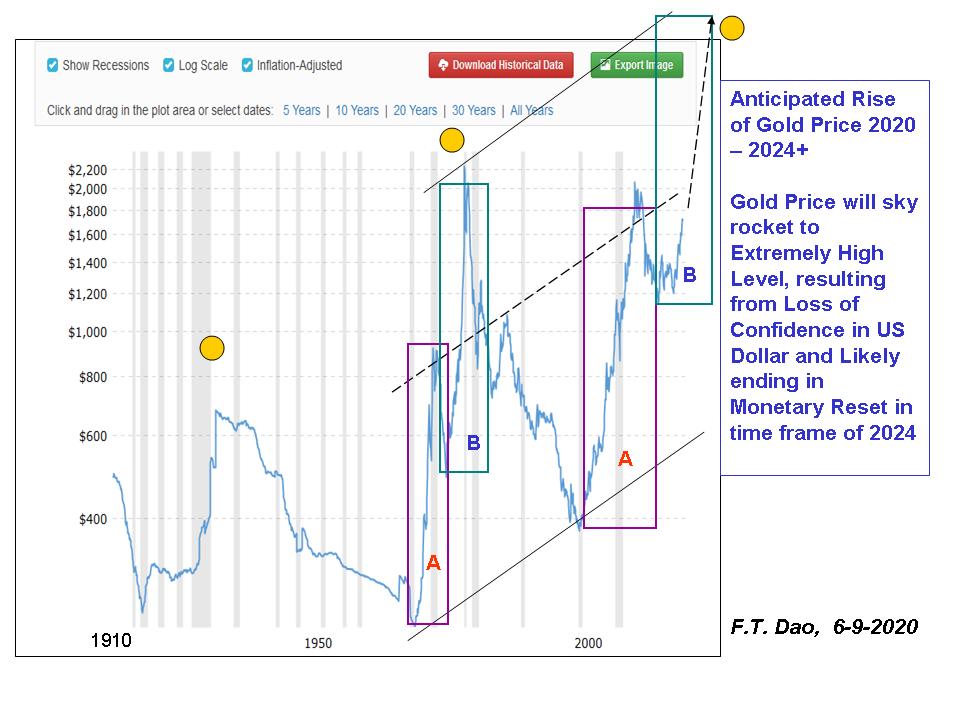
Forecasting Gold Price in 2020-2024
It is inevitable that Gold price will continue to rise for years, until the global economy returns to normal and a monetary reset is in place. This is in accordance with the big cycle thesis stated in the beginning of this article. Note again the three orange circular marks.
Chart 5– Rise of Gold Price from 2020 Onward
Summary
Nature has a way to adjust itself. We label this Nature’s cycles. Gold tends to be a tool in Nature’s kit, unlike Jerome Powell’s tool kit.
We now have a choice in investing in Dow equity or real money Gold. We prefer Gold, trusting in the One who demands our faith.
“Therefore I love your commandments above gold, above fine gold.”
We are not certified or qualified financial advisors. Please consult your certified financial advisors for actual trading and investing.
*********
More from Gold-Eagle


