Growing Market Weakness in Stocks and Bonds


Last week, we wondered whether the Dow Jones would next cross its BEV -5% or -10% lines. This week we know – it closed below its BEV -10% line, and that isn’t good for the bulls.
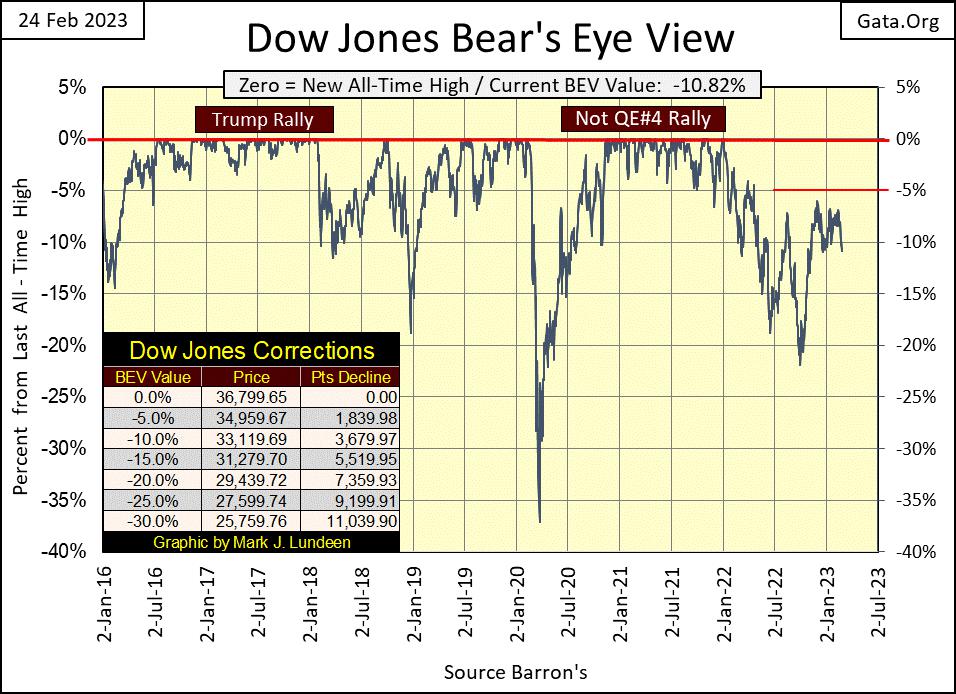
For what’s it’s worth, this is how I see it; it’s been over a year (04 January 2022) since the Dow Jones saw a new all-time high; a BEV Zero in its BEV chart below. Also, since last summer, it has on too many occasions struggled to close above its BEV -5% line, and failed that too. If this was a horse race, the Dow Jones in February 2023 is a horse I’d never risk my money on.
Of course, with a little help from friends in high places, the Dow Jones could once again resume its winning ways. But since last summer, for the past eight months, every week the FOMC has relentlessly pulled “liquidity” from the financial system with their ongoing quantitative tightening (QT).
So far, the stock market has successfully shrugged off that loss of almost a half a trillion dollars from the financial system. Successfully in the sense that we’ve not seen a panic in the market so far in this QT. Also, NYSE margin debt is also down by a third of a trillion dollars since its high of October 2021.
How much longer can the Dow Jones sustain its current lofty levels seen in the BEV chart below – only 10.82% below its last all-time high, as an ocean of “liquidity” supporting it is drained?
How will we know when the Dow Jones is ready to trade at a more rational level of valuation? Will this pending decline in valuation be an easy descent to much lower levels, or a violent break-down in valuation? In the 21st century, the Dow Jones has seen violent valuation deflations three times already; three nasty bear market declines in the past twenty-three years.
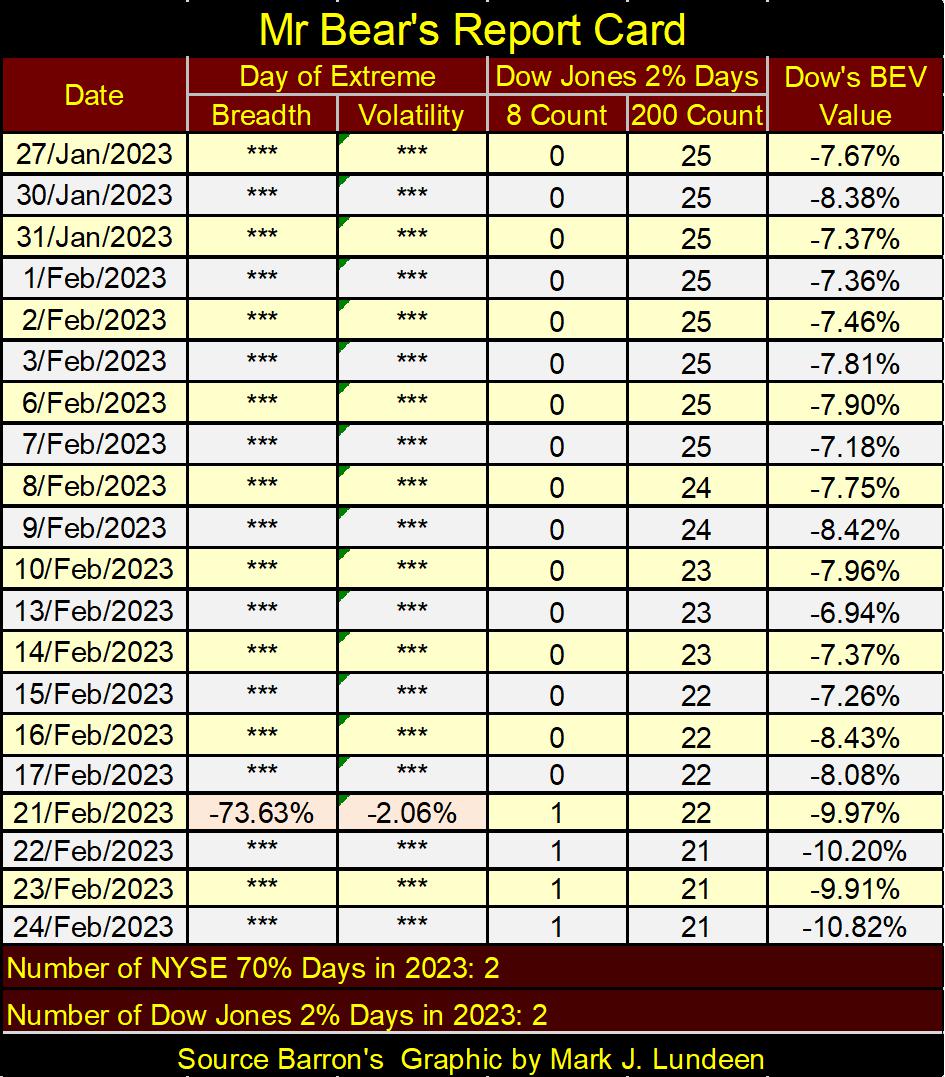
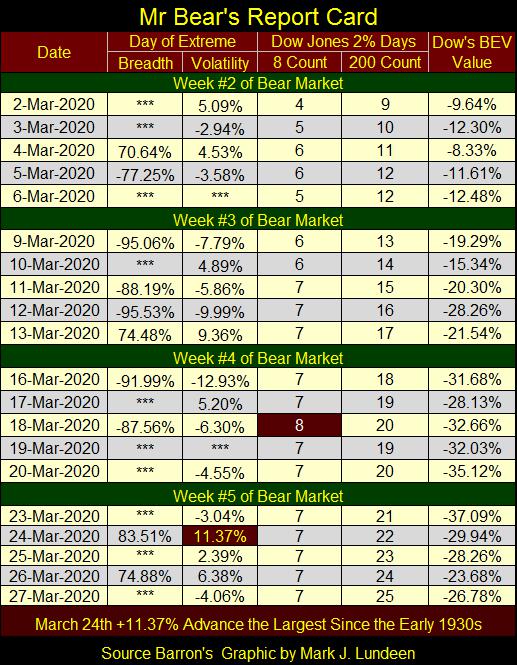
What do I think, how the Dow Jones will deflate to lower valuations? I’m leaning towards the Dow Jones deflating downwards in a violent fashion, maybe sometime in the next few months, simply because on Tuesday, Mr Bear left his calling card at the NYSE, with his second NYSE 70% A-D day for the year. As did the Dow Jones, with its second 2% day for the year (Mr Bear’s Report Card below).
These are extreme market events, and extreme market events are almost exclusively bear market events. In good markets, we see such market extremes once every few years. But 2023 isn’t even in March, yet the market has seen two of each. Not good, not good at all!
Looking at my table of Major Market Indexes BEV values below, since last Friday, these major market indexes have each lost a couple percentage points in their valuation. One market fact that’s becoming obvious, to me anyway, is that this is a market that’s beginning to find that it’s easier going down than going up.
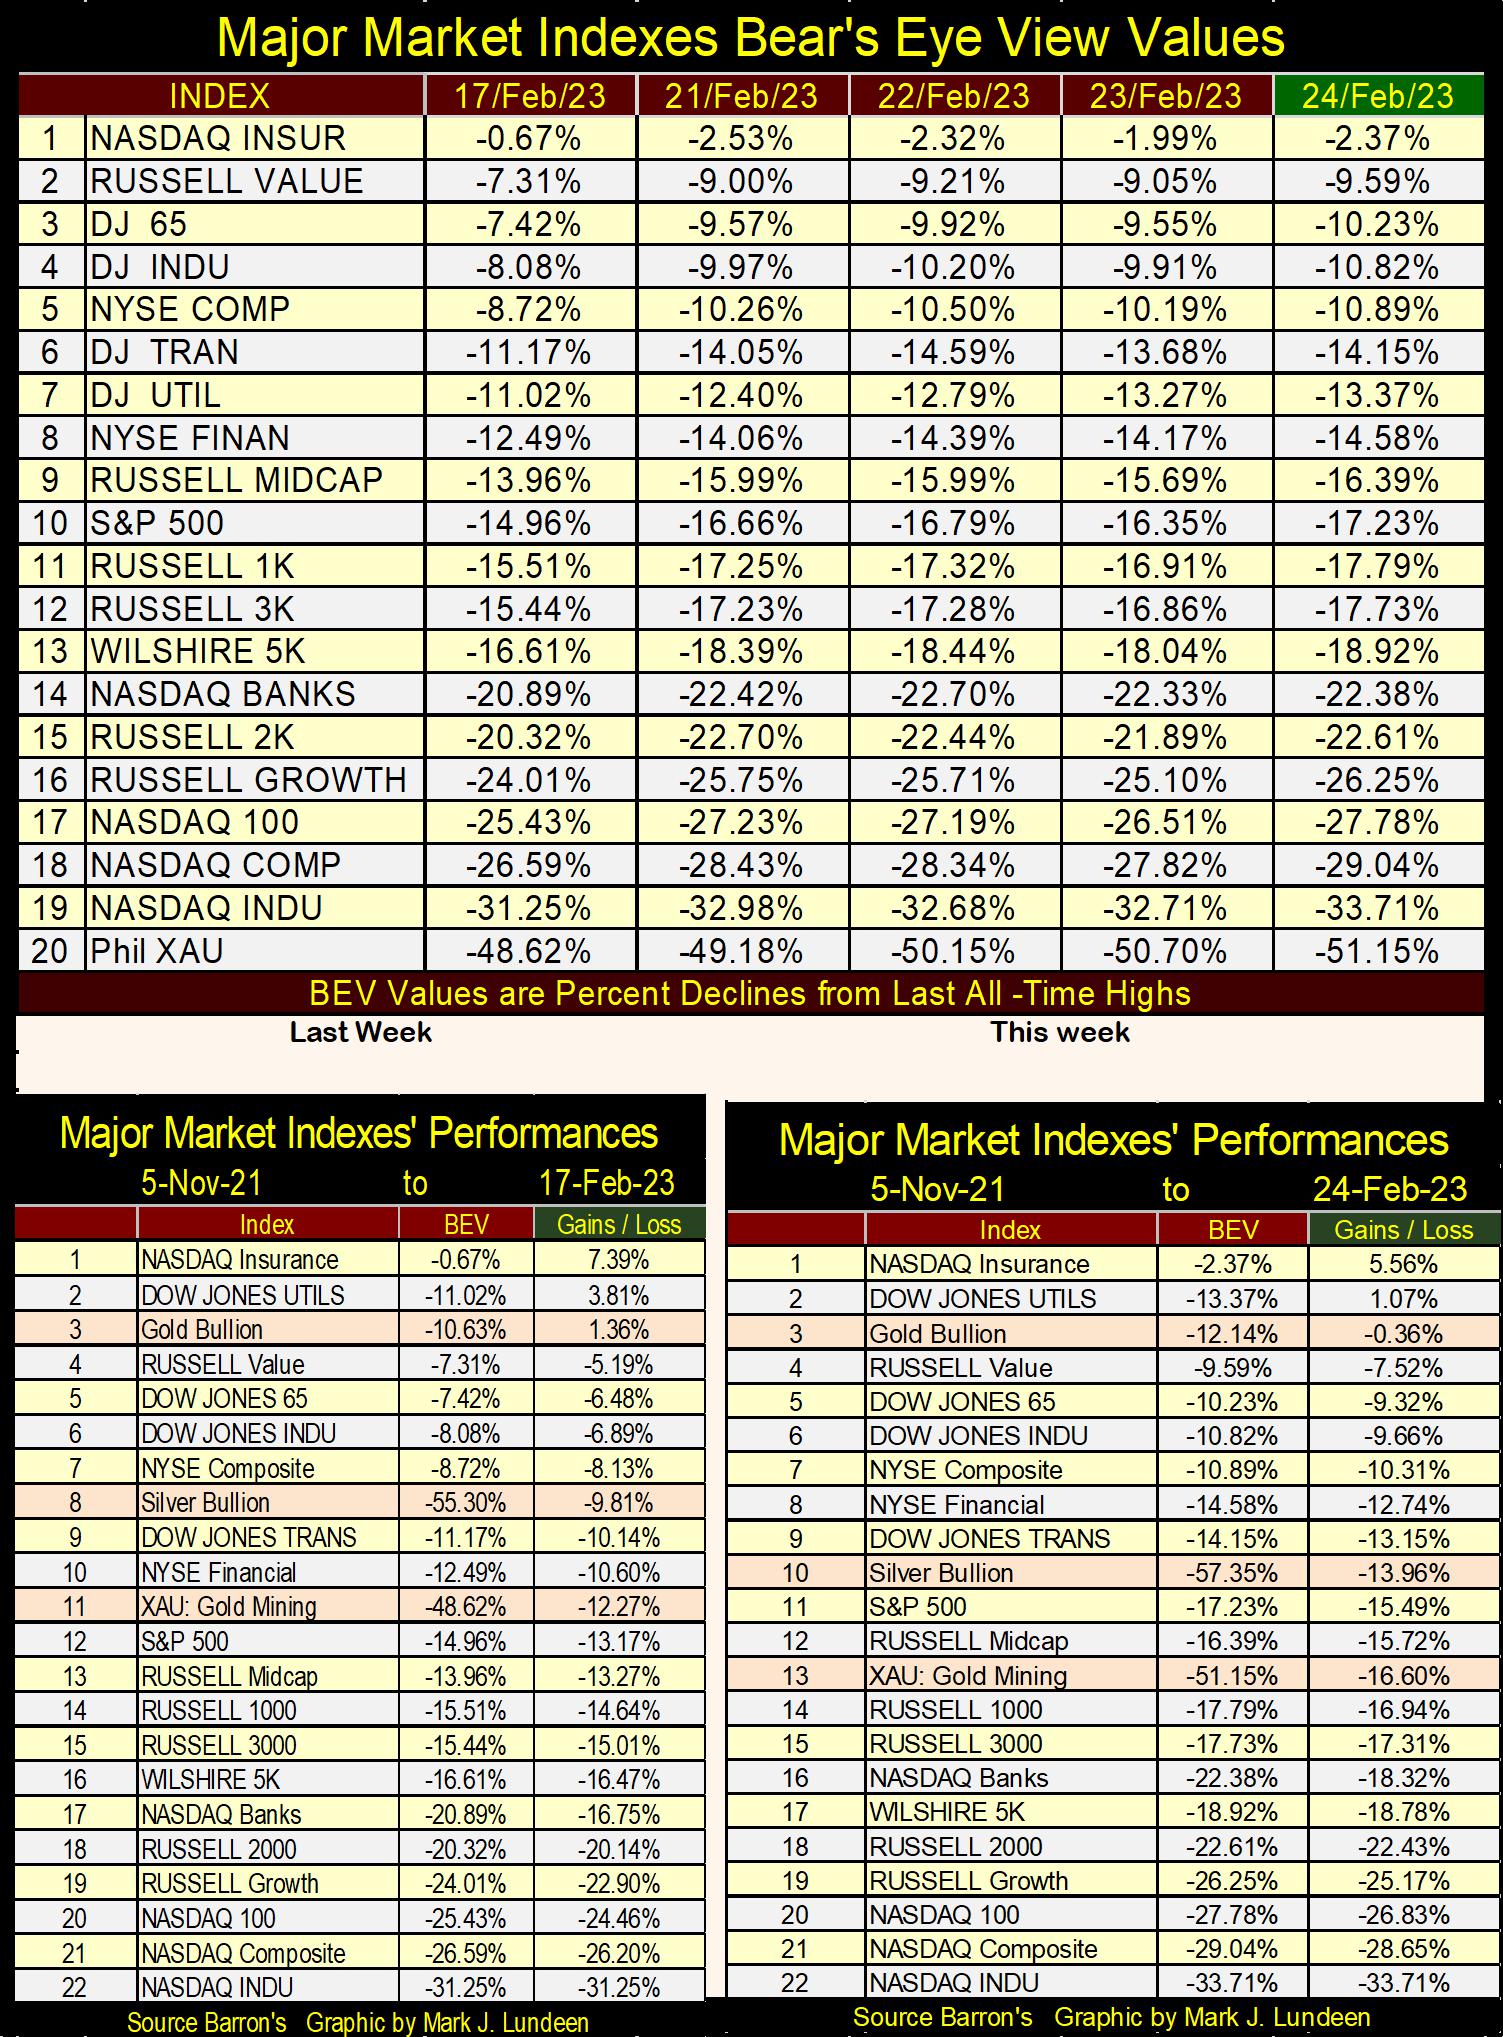
In the performance table above for this week, gold, silver and the XAU all lost ground with the rest of the market. But gold is holding on to its #3 position, and has for weeks. This is not so for silver and the XAU. When these precious metal assets once again become countercyclical to the stock market, when a bad day for the Dow Jones is a good day for gold, silver and the XAU, we’ll know their bull market has once again begun in earnest.
But right now, that isn’t true. Give it time. We still have a lot of time left in 2023, and then there is always 2024 or 2025. I remember reading Richard Russell’s Dow Theory Letter in the 1980s, and he’d say “gold, gold, your making me old.” I didn’t really understand that then, but four decades later I do now. Gold and silver are going to do fine. I just don’t know if I’ll live long enough to see the sun rise on the day that happens.
But I think I will; 2023 is looking up for the gold and silver markets, if down for everything else. How so? First of all, the Federal Reserve system, with the global central banking cartel has enabled the global economy to take on too much consumptive debt. This is debt that doesn’t yield an economic return, but rather consumes economic output for the servicing of its principal and interest payments. In the next economic recession, expect a good amount of this debt to be defaulted on.
Gold and silver, are assets with zero counterparty risk, and so can’t be defaulted on. People currently don’t think of gold and silver in these terms. However, as the bear market in debt continues; as bond yields continue to rise, investors and institutions will eventually figure that out, and that is when precious metal assets will outperform the stock and bond markets, in a historical way.
Next is the Dow Jones in daily bars, and for the bulls the chart below is not a pretty sight to see. Last week the Dow Jones made an attempt to close above its line of resistance at 34,250. This week, it made an attempt to close below its line of support at 32,500. If in the weeks to come, the Dow Jones closed below this critical line of support (32,500), and then go on to close below 32,000; things for the bulls could get ugly really fast.
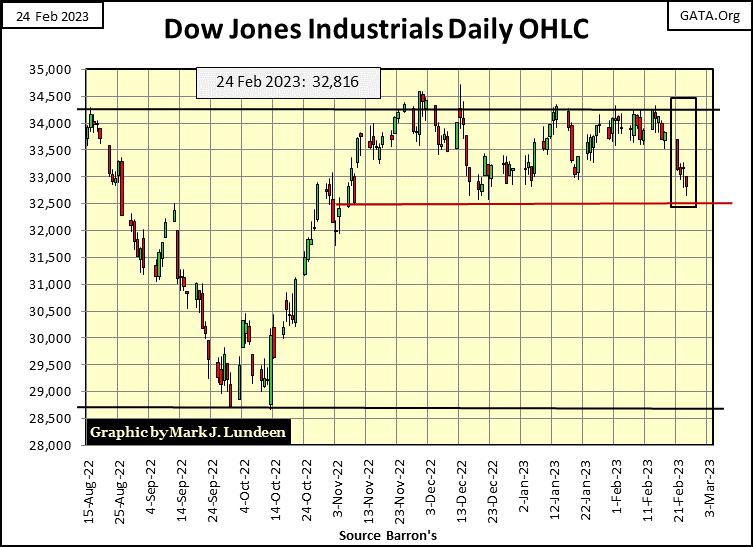
I have to make an observation here; so far 2023 appears to be making a reprise of the last market unpleasantness – the March 2020 flash crash. This isn’t a prediction on my part. Just an observation from recent history, that things in the market that can go really wrong, really quick. Should we continue seeing NYSE 70% A-D days, and Dow Jones 2% days in the weeks to come, that will be really bad.
Here's Mr Bear’s Report Card from late March 2020. This is what Wall Street looks like when Fire & Brimstone rains down on it from on high. During the 1929 to 1932 Great-Depression Market Crash, Wall Street didn’t see four consecutive weeks of market hell, as seen below from just three years ago. Look at the Dow Jones 200 Day Count; the number of Dow Jones 2% days in a running 200-day sample. It went from a 9 to a 25 in only twenty NYSE trading sessions as the stock market was upchucking dollars!
Will Mr Bear’s Report Card for late March 2023 look like it did three years before? I sure hope not, and I doubt it will. But who knows what the future holds for any of us? Our “regulated markets” are a house-of-cards. When Mr Bear comes to clean up the many market excesses now trading daily at the NYSE and NASDAQ, what he and his cleanup crew have planned for Wall Street isn’t pretty.
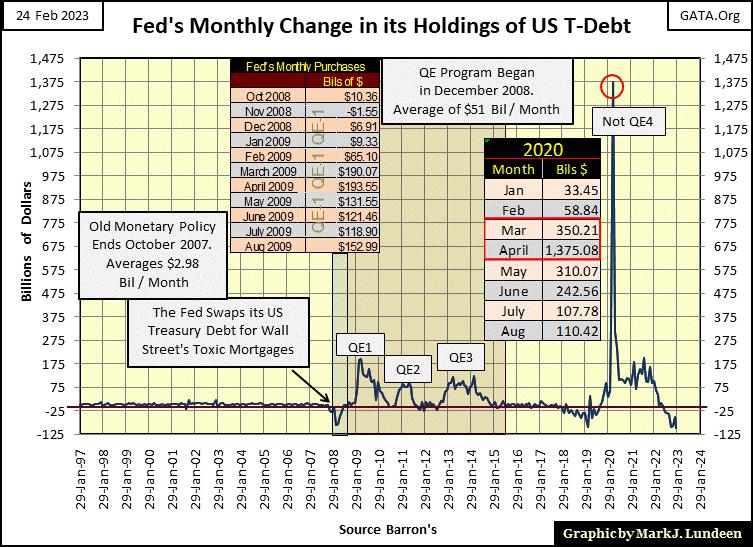
Here is a chart on the monthly changes in the Fed’s holding of US T-debt. I usually post this data in weekly format, but I like monthly data too.
In April 2020, the idiots at the FOMC “injected” $1.375 trillion dollars into the financial system. Apparently, they couldn’t take the pain Mr Bear was dishing out, as seen in his report card above. From March to May 2020, they “injected” $2.035 trillion. They didn’t do that because they wanted to. They did that to stop the pain seen above.
You may not think this is possible again, but I’d wager concerns of another such market panic in the stock and bond markets is a frequently discussed topic at the big table, where the idiots sit at the FOMC.
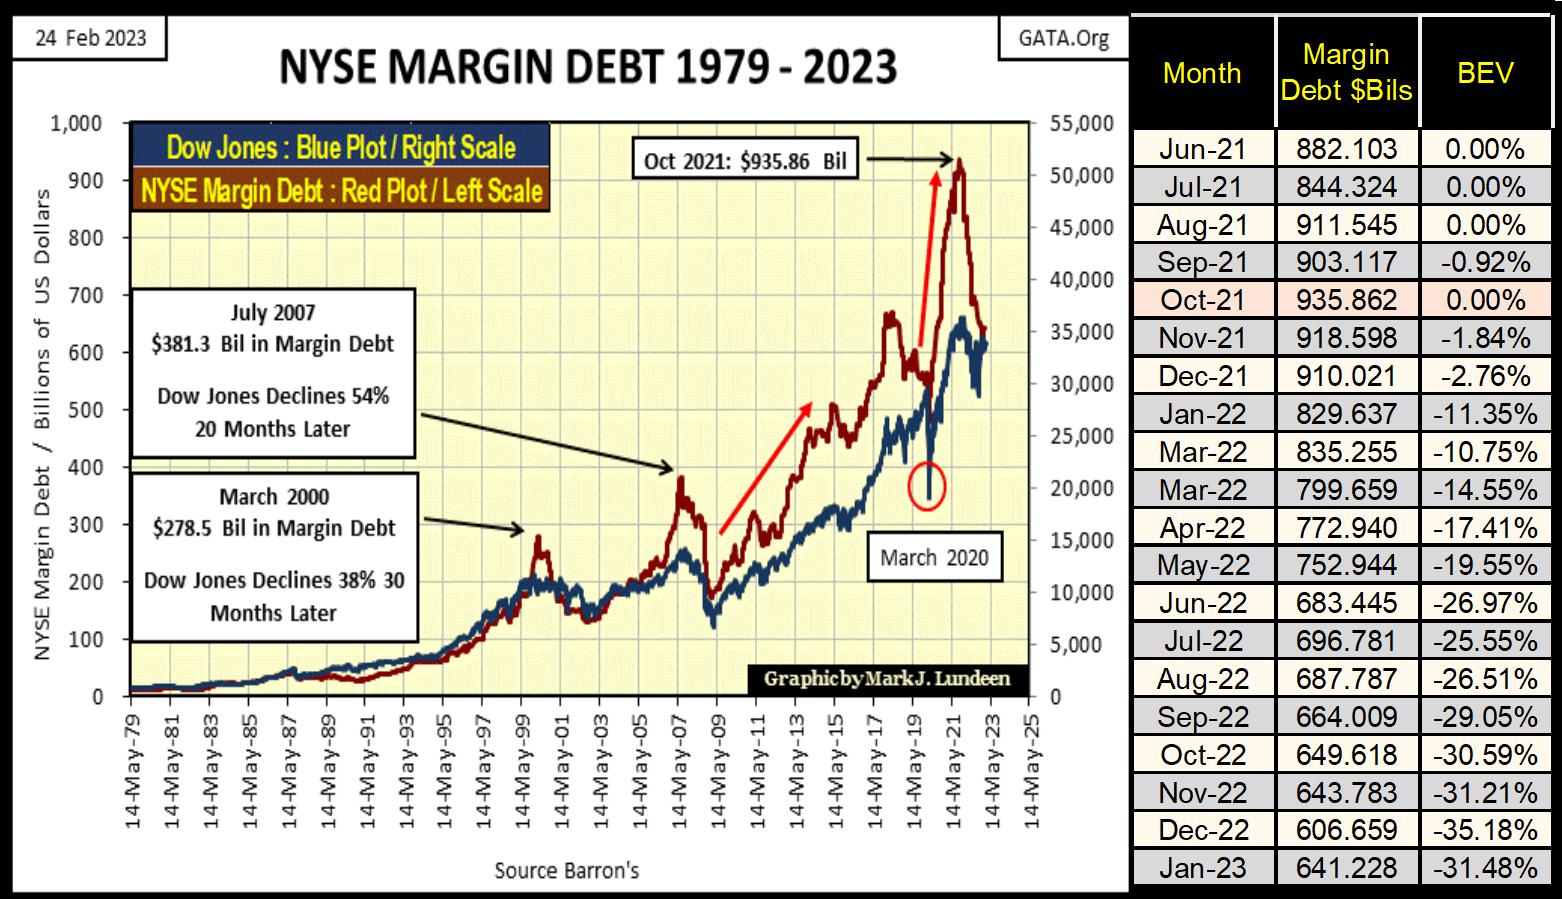
January 2023 saw money flow into NYSE margin debt (below), but not much. Margin debt is still 31.48% below its highs of October 2021.
Look at the huge decline in margin debt below, from its highs of October 2021. Since January 2000, every time margin debt peaked, and then saw a similar decline, a big bear market decline in the Dow Jones followed. Can the current decline in margin debt be any kinder to the stock market, especially now with the current decline happening as the FOMC is also conducting a QT concurrently with it?
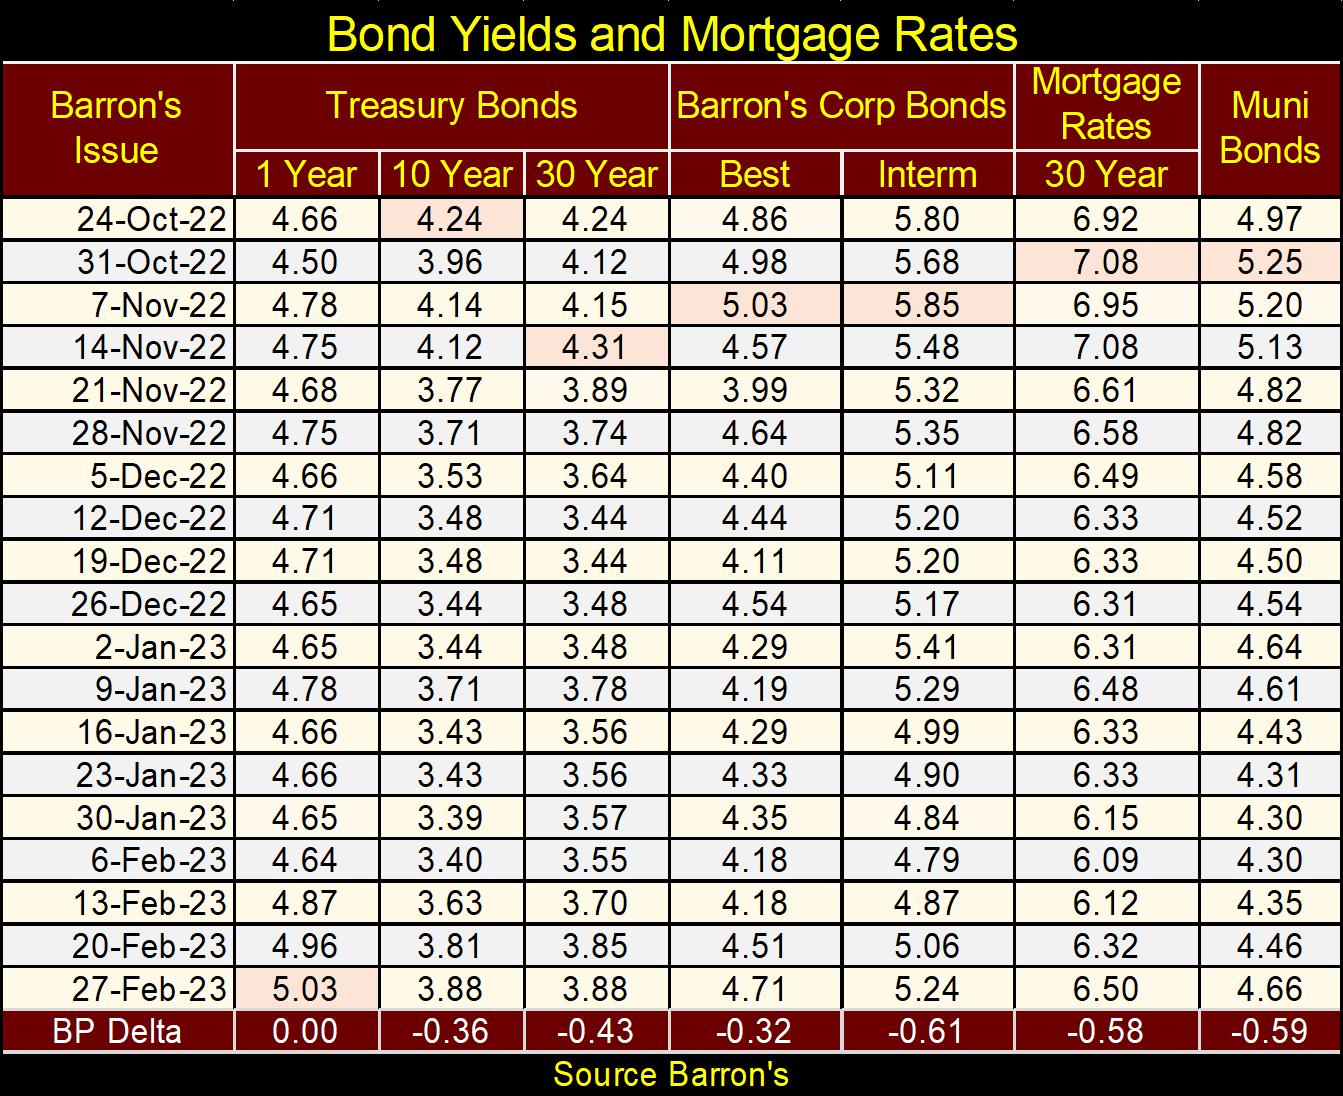
Corporate bond yields (below) continue rising off their lows of a few months ago, as seen in the table of yields to the chart’s right. Having these yields once again rising is a very disturbing trend to observe, as a bear market in debt is noted by rising rates and yields. And we aren’t going to have a bull market in stocks, when the bond market is in a bear market. Look at the spike in yields these bonds had from January to October / November 2022. What that tells me, is that something fundamental has changed in the bond market, fundamentally not good for the bulls.
What’s next? Another surge in the chart below towards 8% to 10% yields? We’ll know more as 2023 progresses.
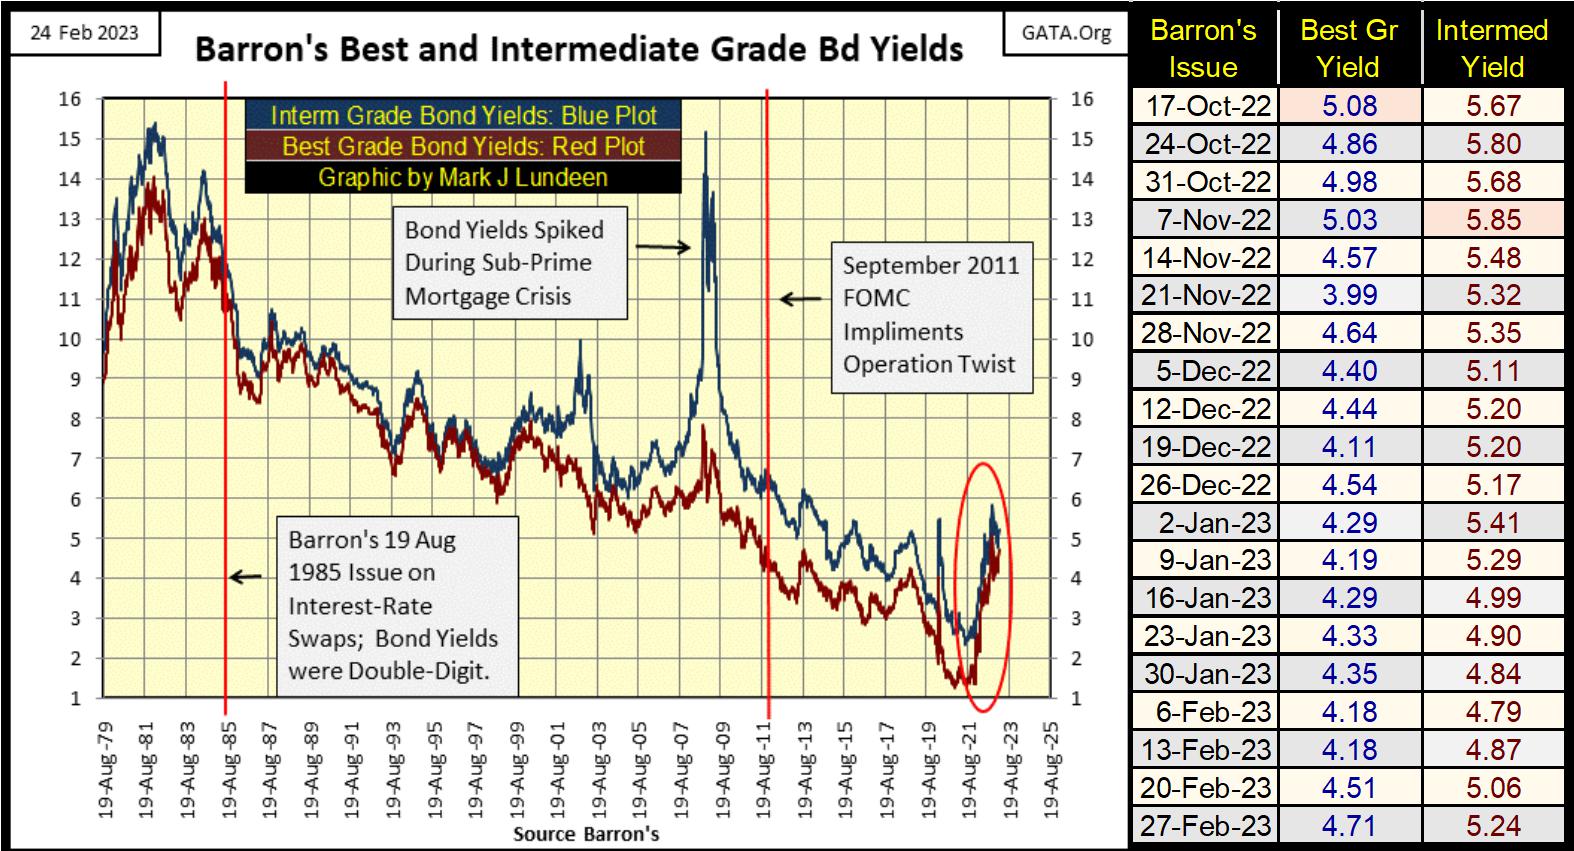
It’s not just corporate bonds suffering from rising yields (deflating valuations), as seen in the table below. The entire debt market is selling off. Not in a panic; not yet. But buyers in the debt markets are demanding discounts to current market valuations, and getting them.
All of these yields were double-digits in the early 1980s. Don’t think that can’t happen again.
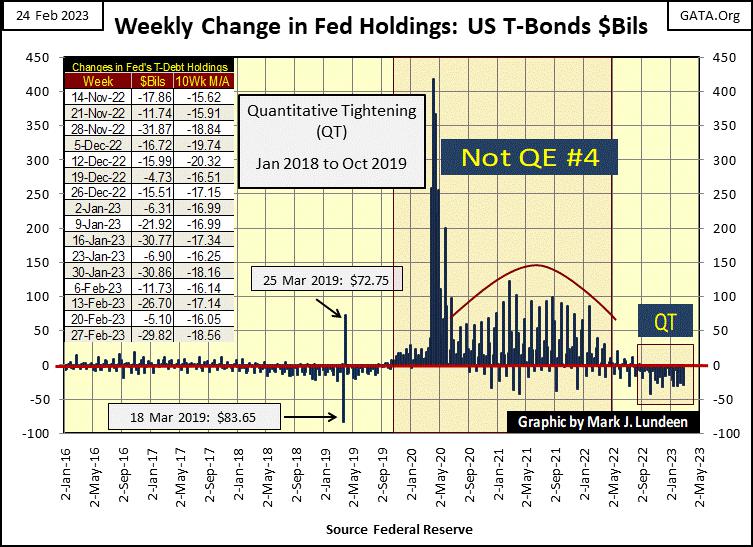
I may be beating a dead horse here, covering the FOMC’s QT via a weekly chart below, after covering it above with monthly data. But I have some details below that are not seen above, so let’s do it.
The last time the FOMC had a positive net weekly “injection” into the economy was the last week of last June. Since then, they’ve withdrawn “liquidity” from the market every week, as seen in the Red Box at the far right in the chart below. That is a total reduction of $479.7 billion of US Treasury Debt from the Federal Reserves’ balance sheet since last June. That seems like a lot to me, though that is only a small fraction of the total “injection of liquidity” the idiot savants at the FOMC “injected” into the financial system during their Not QE #4.
As the above QT is the FOMC’s second, their first from January 2018 to October 2019, what happened following the termination of their first QT?
The best chart for that is actually to look at the Federal Reserve’s balance sheet, below. The first time the idiots attempted to offload assets from their balance sheet from their QE #1-3, purchased with monetary inflation during and following the sub-prime mortgage crash, was during their first QT. Their first QT was terminated with the introduction of their Not QE#4, which was used to stem financial system’s descent into hell in March 2020.
An interesting point to note; March 2020 was the first time the FOMC was forced to monetize corporate debt, as corporate bond yields were then spiking.
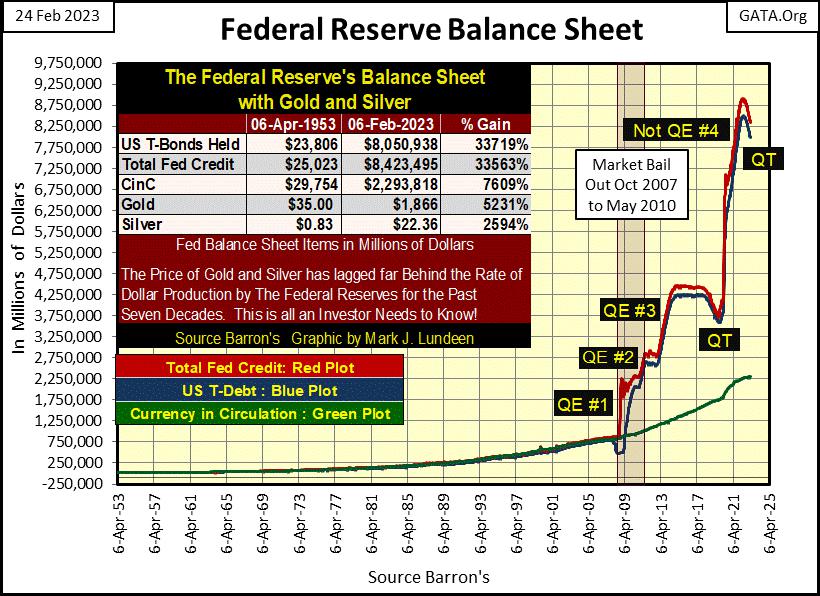
Keep in mind what happened in early 2020 above, where the balance sheet for the Federal Reserve was reduced by the FOMC’s first QT. I have to wonder how, and when this second QT will be terminated? Will it, like their first QT was, be terminated by chaos somewhere in the financial system? That’s what I’m thinking.
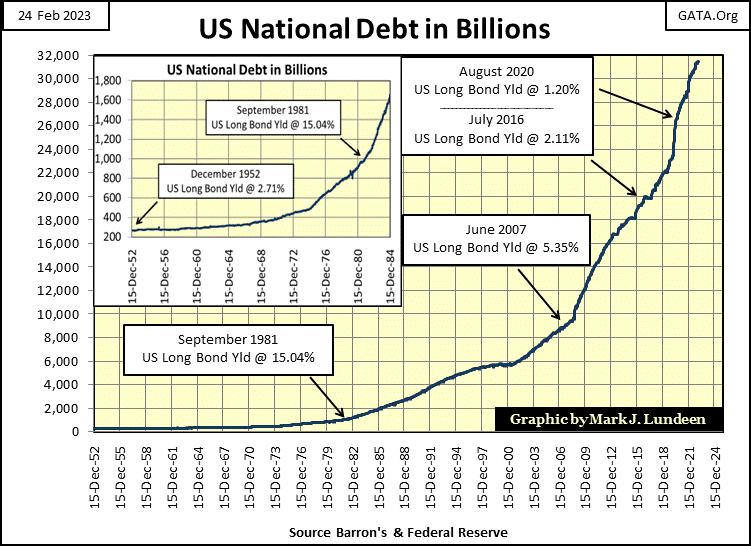
Here's a chart of the US national debt, which also notes some key US long T-bond yields. The national debt was around $300 billion in December 1952. This huge national debt of $0.3 trillion dollars was a point of concern at the time.
As the national debt crossed $1,000 billion ($1 trillion), bond yields peaked in September 1981, which makes a lot of sense. Any banker can attest to the fact that rising debt levels for people, corporations or governments are understood as a deterioration in their credit worthiness. That plus, the worsening of credit worthiness results in rising rates the credit market will demand from debtors.
But for the Federal Government, all that changed after September 1981. By August 2020, with the US national debt then above an unserviceable $26 trillion, 26 times greater than it was in September 1981, the yield for the US long T-bond declined to a pathetic 1.20%.
How was that possible? The first point to keep in mind is, America’s “free markets” haven’t been free for many decades. American markets are in fact “regulated markets”, regulated for the benefit of Wall Street bankers and Washington’s politicians and bureaucrats.
Back in the early years of the Obama mis-Administration, a bond rating agency, I believe Standard & Poors (?) wanted to down grade the US Treasury’s bond rating from AAA for the obvious reason seen above.
All hell broke loose at S&P (?), as government regulators and agents from this and that three letter Federal Agency stormed the offices of “the Son-of-a-Bitch” that wanted to downgrade the US Treasury’s debt to something below AAA. Phone land lines at S&P (?) must have glowed cherry red for all the heated communications between it, and Washington’s “regulators” and enforcers.
No bond rating agency has made that mistake again. And they won’t. But that won’t stop the Treasury’s junk AAA Rated T-bond yields from rising back to double digits in the years to come, for the obvious reason seen above.
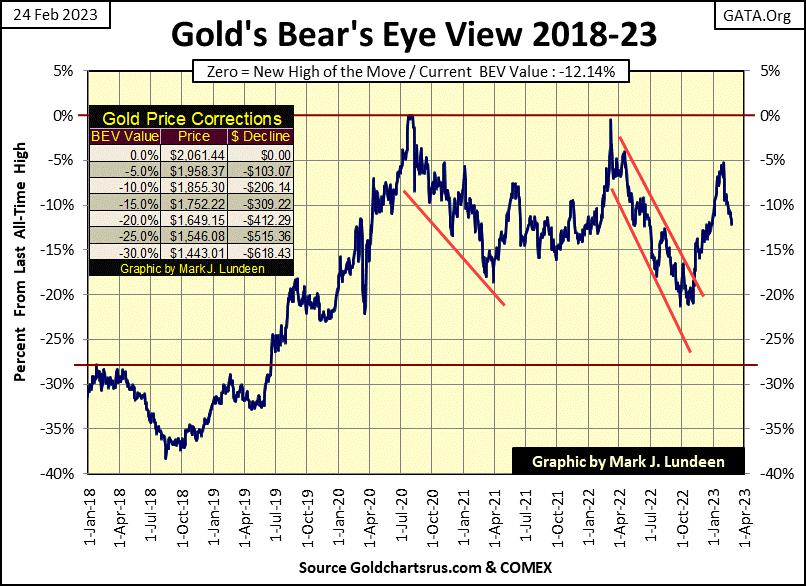
Which makes this a good point to look at gold’s BEV chart, which in ways appears similar to the Dow Jones BEV chart above. I mean their BEV -5% and -10% line thing, both closing below their BEV -10% lines this week, where a few weeks ago, they both appeared to be ready to break above their BEV -5% lines.
I don’t know, but I believe the current coupling of the gold market to the stock market is engineered, meaning it’s a “policy thing.” The “policy makers” can’t afford having gold entering a roaring bull market as the stock and bond markets deflate. That would only exasperate their nightmare situation, of the flow of refugee dollars fleeing deflating Wall Street, towards inflation in the precious metal markets.
At some point in the future, these markets will decouple, as deflation funnels flight capital flowing from Wall Street, towards inflating gold and silver valuations. It should be quite a sight to see, and I’m looking forward to it.
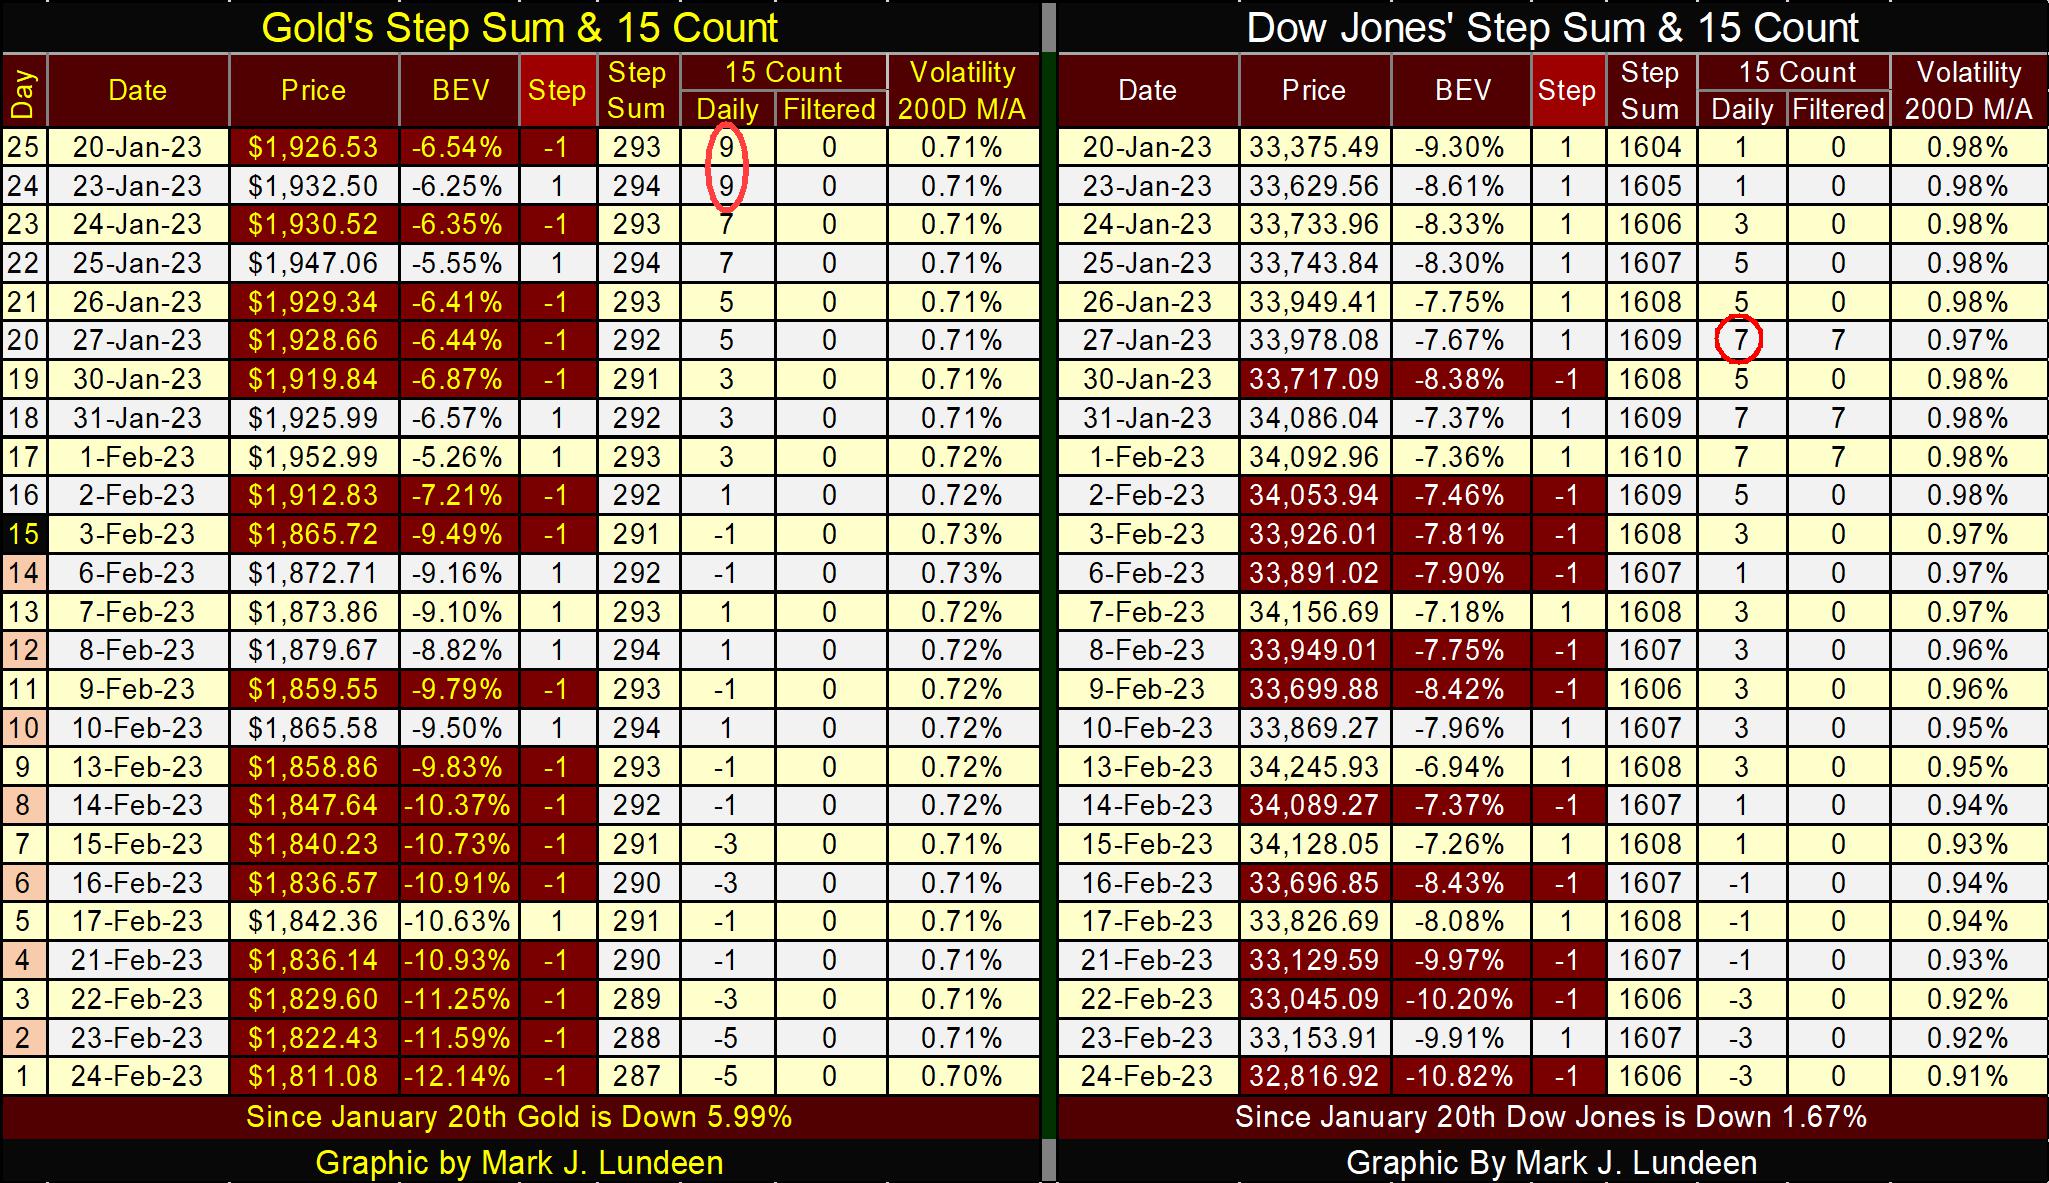
Moving down to gold’s step sum table below, gold with its 15-count of +9 was a very overbought market a month ago. Markets don’t like being very overbought, and typically sell off from this extreme condition. At the close of the week, with gold’s 15-count now a -5, gold is ready to once again begin to rise in valuation. But a -5 isn’t an oversold market.
Below a table listing gold’s 15-count legion, and the daily frequency distribution for each 15-count value since December 1970. If gold closes down on Monday next week, its 15-count will be a -7, which is an oversold market. Since December 1970, gold’s 15-count closed at a -7 for only 330 daily closes, or 2.52% of all daily closings.
But, should gold also close down on Tuesday, its 15-count will be a -9, a very oversold market, something seen in only 65 daily closes since December 1970.
But then, should gold also close down on Wednesday, its 15-count will become a -11. Since December 1970, gold has only been this oversold for 12 of its 13,111 daily closings of the past fifty-three years.
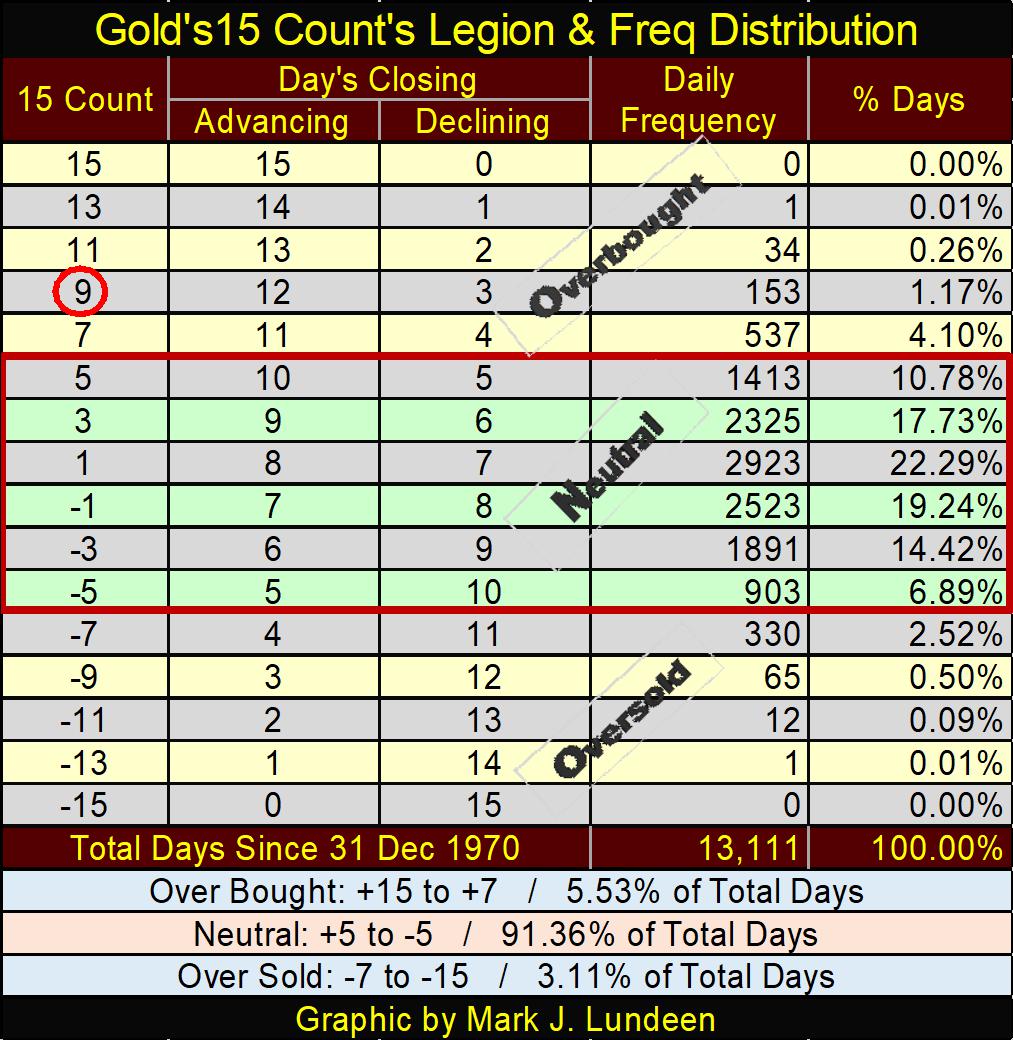
What does all this mean? Maybe nothing. Then again, maybe it may prove to be something big. I’d like to see gold’s current decline bottom at some extreme metric bottom, such as its 15-count declining to a -9, or better yet a -11 before gold resumes it advance towards a new all-time high. I wouldn’t bet the farm on it, but let’s see what happens next week.
Eskay Mining issued their final press release on their 2022 drilling program. It wasn’t what the market wanted, so Eskay Mining’s share price closed the week far from where it was a year ago. It’s a shame, as much was done in 2022 to further the company’s understanding of the geology of their massive property in British Columbia’s Golden Triangle.
The important thing to understand is, Eskay Mining now understands that it is the owner of an entire VMS district. For a company looking for a second and third Eskay Mine, a mine that was the richest gold and silver mine in the world at the time, this is exactly what they needed to establish to justify further exploration.
Eskay Mining’s management is one of the best in the minerals exploration industry. Their geological team conducting its exploration is outstanding.
With God, and the geology from the Jurassic period willing, everything else will fall into place in the years to come. Maybe as soon as in 2023. So, I’m holding on to my position in the company, expecting good things to come as gold and silver once again break into new all-time highs.
For public disclosure, I have a large position in Eskay Mining, purchased with my own money, because I like the company. I have never received any financial gains from Eskay Mining, or an agent of Eskay Mining, for recommending their stock, and don’t expect to receive any in the future. But if in the unlikely event that management were to send a few hundred dollars my way, to buy a case of Wild Turkey 101 bourbon whiskey, in the 1.75 liter bottles, I wouldn’t say no to the offer.
Mark J. Lundeen
********


