HUI Gold Bugs Fighting To Break Downtrend


 Cooooeee! That’s the sound of the HUI Gold Bug bulls trying to find other bulls to push the price a little higher in order to break the downtrend. But the landscape appears desolate. The bulls don’t seem to be stepping up when the going gets tough. Currently, price is tantalisingly short of the previous major swing high. Let’s take a look at the daily chart to see what I’m talking about.
DAILY CHART
The March 2014 high denoted by the blue horizontal line is the previous swing high and stands at 261.57. Breaking that level would be an achievement for the bulls and the first real goring of the bears in this battle. Until then, the bear continues to dominate the overall landscape.
I have drawn a black down trending line from the August 2013 top to the March 2014 high. The recent runup saw price clip that line before turning back down and closing below it. Price just wasn’t ready to overcome that obstacle.
This high showed a bearish divergence in the Relative Strength Indicator (RSI) and now looks to be retreating. The Moving Average Convergence Divergence (MACD) indicator still shows the red line above the blue line indicating a bias for lower prices over the near term.
I have drawn Fibonacci retracement levels of the down move from the March 2014 high to the recent May low. One level that stands out is the 38.2% level which, if price retreated to, would conveniently close out the gap which I have outlined.
I still favour this rally has higher to go and I’d like to see price have another decent crack at the black down trending line and run some stops above there. I have added a lesser known Fibonacci level being 88.6% at 254.74 and I suspect that will be the final rally ending point. The market often takes things to the extremes and in this case I suspect it will keep the bulls on the hook for as long as possible. And perhaps this high will coincide with a RSI lower than the recent high. A little bearish divergence. Let’s see.
WEEKLY CHART
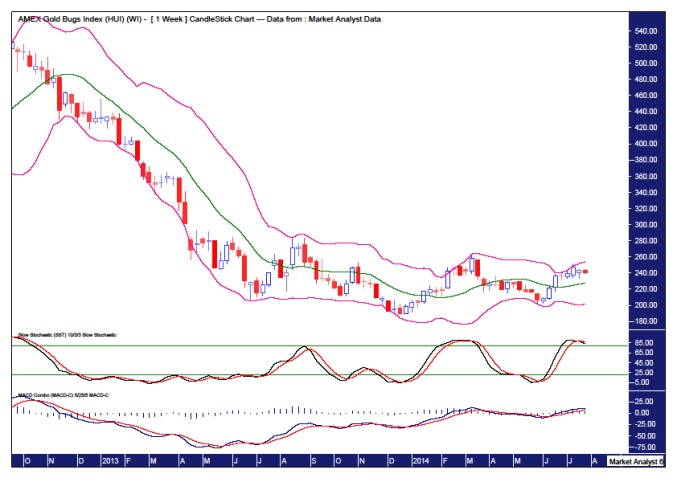
I have added Bollinger Bands to this weekly chart and this highlights the correctional nature of trading as price bounces up and down between the upper and lower bands. The daily analysis suggests price can come down a little in the near term so perhaps we could surmise the middle band may provide support.
The Stochastic Indicator has rolled over suggesting lower prices, at least in the very near term, while the MACD suggests higher prices over coming weeks with the blue line currently above the red line. So perhaps price will go lower now but not enough for the averages to cross over and then price heads back up.
The chart appears to have been in a sideways consolidation since towards the end of 2013. And as it came into the consolidation from the upside, it should leave the pattern in the same direction – to the downside.
Let’s wrap things up with a quick look at the monthly chart.
MONTHLY CHART
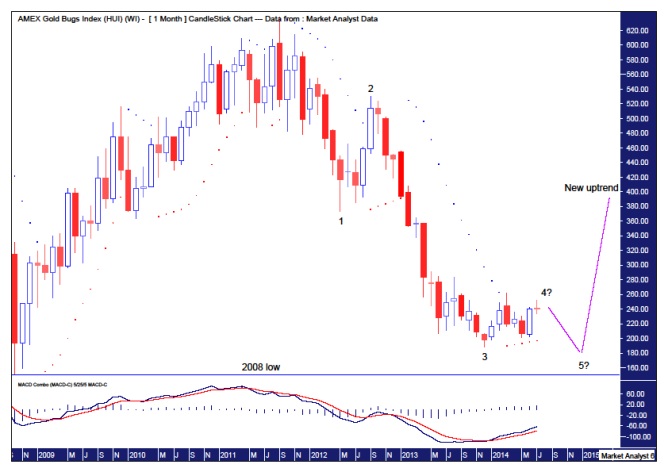
I have added my bastardised version of Elliott Wave. I’m not an Elliott Wave expert so if you’re after some extensive, in-depth and by-the-book Elliott Wave analysis, you’ve come to the wrong place. I like to use EW in a generalised way that helps provide some structure to the picture. Price looks to be tracing out a Wave 4 which implies a final move to low , Wave 5, is still ahead of us.
The MACD indicator still looks to be trending up with the blue line above the red line so perhaps we could expect some more toing and froing in the next couple of months as price edges up and threatens the March 2014 high.
The Parabolic Stop and Reverse (PSAR) indicator shows price busting the dots to the upside a few months ago but price just hasn’t gone on with the job. The nature of trading has been anything but impulsive so I believe price will shortly turn back down and break the dots to the downside as it puts in a final low, just above the 2008 low.
Taking out that oh-so-close March 2014 high would most likely be the kill shot to the bear. At the least a crippler. If that weren’t to stop the bear then certainly taking out the August 2013 would be the coup de grace. Until then I’m not expecting any bull stampedes.


