Market Update For Early February 2019
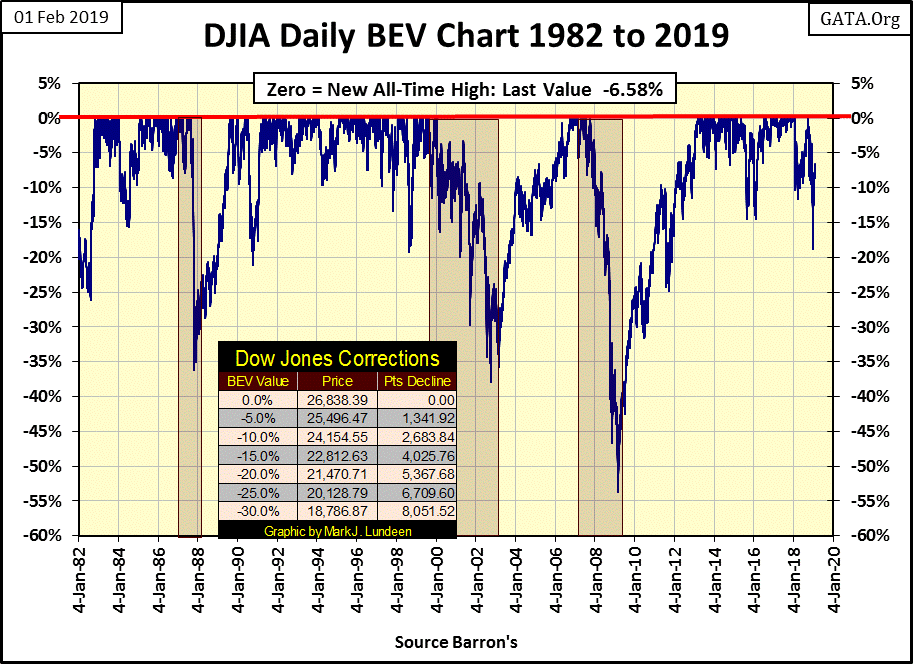
Let see, on December 24th the Dow Jones Index found itself on the BEV chart below at -18.77%. Twenty-seven NYSE trading sessions later, the close of this week, it has increased to -6.58%. As always, a big Bravo Zulu for the Plunge Protection Team (PPT) for manipulating the markets higher. No one does it better!
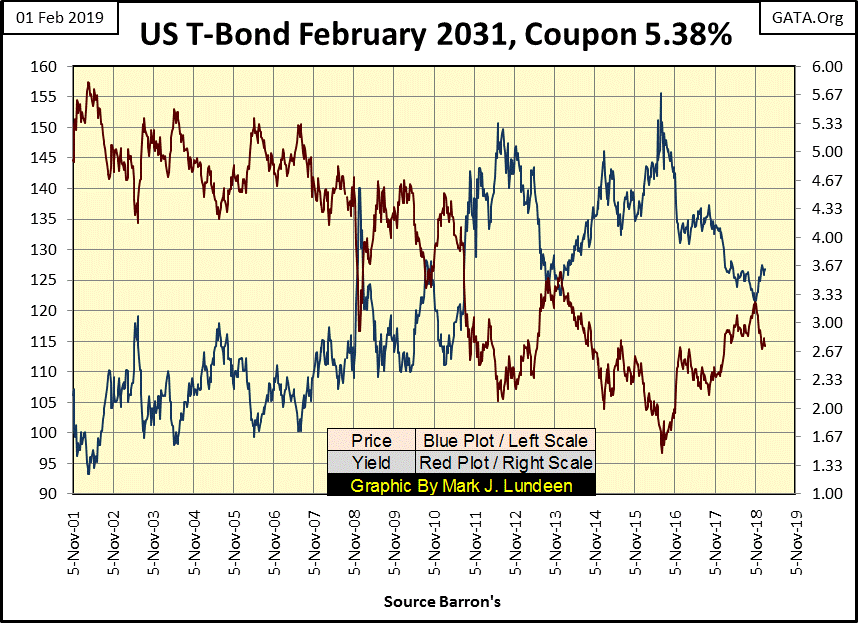
And it’s not only that the Dow Jones is going higher. NYSE 52Wk Highs this week on Thursday hit 131 as 52Wk Lows never broke above 22 for the week, and saw only single digits on Thursday and Friday. Bond yields (Red Plot below) since early November are trending down; mind you nothing major but they are going the right way for an advancing stock market.
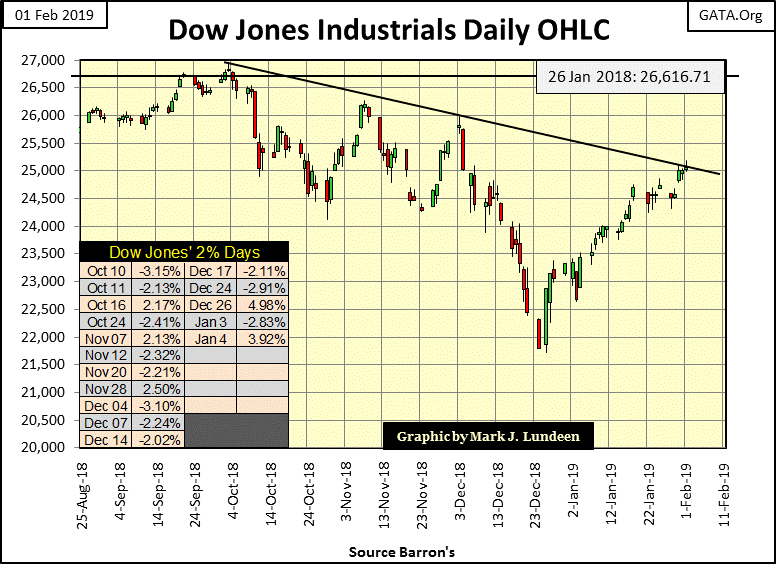
And volatility for the Dow Jones has become a huge positive for a market advance. In the daily bar chart below, for the past four weeks volatility has returned to where it was before the big 18% correction. That plus the Dow Jones closed this week right on the declining trend line I placed on the chart.
Three times before the advancing Dow Jones was stopped at this line of resistance; will touching this line a fourth time prove yet again this is a line-of-death for the advancing Dow Jones? Or is the Dow Jones committed to taking out its last all-time high of October 3rd and from there on to new all-time history?
Aw come on, these are hard questions; heck what do I know? I know in the coming weeks and months the answers to all these questions, and much more will be revealed to all. As things are going at the close of this week’s trading, I’ll bet a couple of bucks on the bulls taking the Dow Jones to new all-time highs before summer. However, a wager of two or three dollars isn’t a ringing endorsement that being a bull in this market has much of a future.
So what could go wrong with the stock market? Lots of stuff that at this moment is off everyone’s radar. A small relatively unknown bank somewhere far, far away might default on their derivatives obligation, triggering a cascading train of defaulting mega-banks. Maybe the Best & Brightest in China or the EU does something really stupid; not that their Best & Brightest have a monopoly on stupidity.
Good grief, we’ve got lots of stupidity right here in the United States managing other people’s money – remember Long-Term Capital Management? They had several Ph.Ds. and a Nobel Prize winner in economics managing that fiasco which almost took the global economy down with them.
Then there was the sub-prime mortgage fiasco, where America’s Best & Brightest thought they could convert non-performing mortgages written for the chronically unemployed into AAA rated debt by bundling them with derivatives. No one on Wall Street, or even at the Federal Reserve bothered to ask what could go wrong with that; including Alan Greenspan in the April 2008 quote below.
"Innovation has brought about a multitude of new products, such as subprime loans and niche credit programs for immigrants. With these advances in technology, lenders have taken advantage of credit-scoring models and other techniques for efficiently extending credit to a broader spectrum of consumers. These improvements have led to rapid growth in subprime mortgage lending . . . fostering constructive innovation that is both responsive to market demand and beneficial to consumers."
- Alan Greenspan (At the Federal Reserve System’s Fourth Annual Community Affairs Research Conference, Wash D.C. April 8, 2005
Six months later, during his televised commercial free Congressional testimony, Greenspan was talking a completely different line of BS as the global banking system began upchucking these “constructive innovations” in the American sub-prime mortgage market.
But there are always problems in life, so we should not take counsel of our fears, unless we find ourselves in a bull market that has advanced for the most part since August 1982. In such times I recommend you take any opportunity to find a reason, any will do to sell now and take your money far from the stock market.
The fears I recommend my readers should ignore are those having to do with gold and silver collapsing from their current levels. That’s not to say that they can’t go down from the close of this week; they could. But their lows of December 2015 are rock bottom. For the past three years the path of least resistance for gold and silver has been upward, and except for brief market corrections will continue to be for years to come.
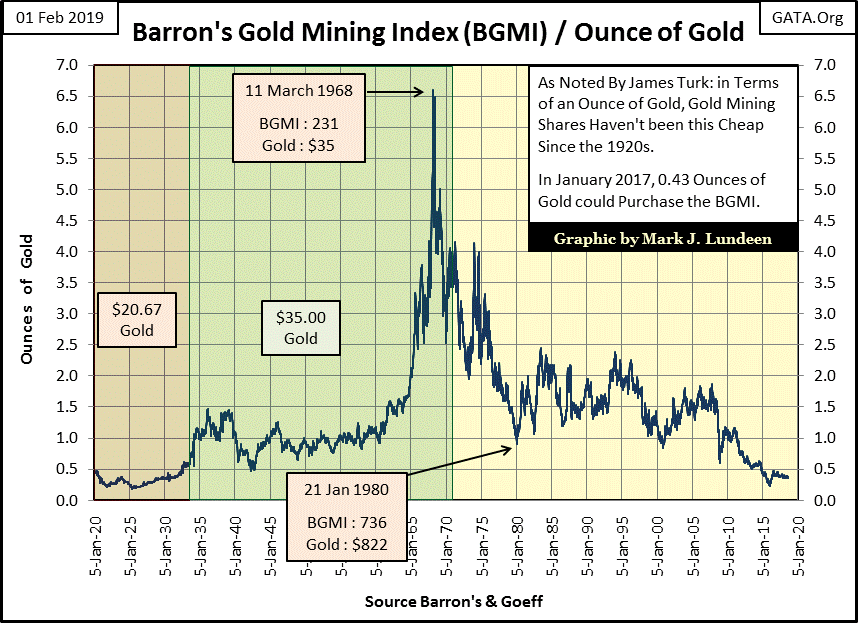
Here’s a metric James Turk once used, and I’ve kept track of it since: the BGMI / $ Price of gold. As Mr. Turk noted, in terms of the price of gold, gold mining shares haven’t been this cheap since the early 1930s. Maybe someone else is also watching this. This week I noted the BGMI was up 10% since last Friday’s close.
But just because something is cheap doesn’t mean it’s a bargain. Still, whenever I think of history’s greatest investment opportunities they were all widely shunned bargains at the beginning; pre WWII real estate in Hawaii and California, or blue-chip stocks in July 1932 and again in April 1942. Who wanted to buy shares in war ravaged Japanese or German companies? In the mid-1960s John Templeton did, becoming a billionaire several times over in the following decades.
Gold, silver and their mining shares just have that feeling to me; that we are on the edge of something historic as decades of inflationary abuses by the central banking cartel to the global monetary system comes undone. In a crisis of confidence in the global financial system, gold, silver and their miners are where I want to be!
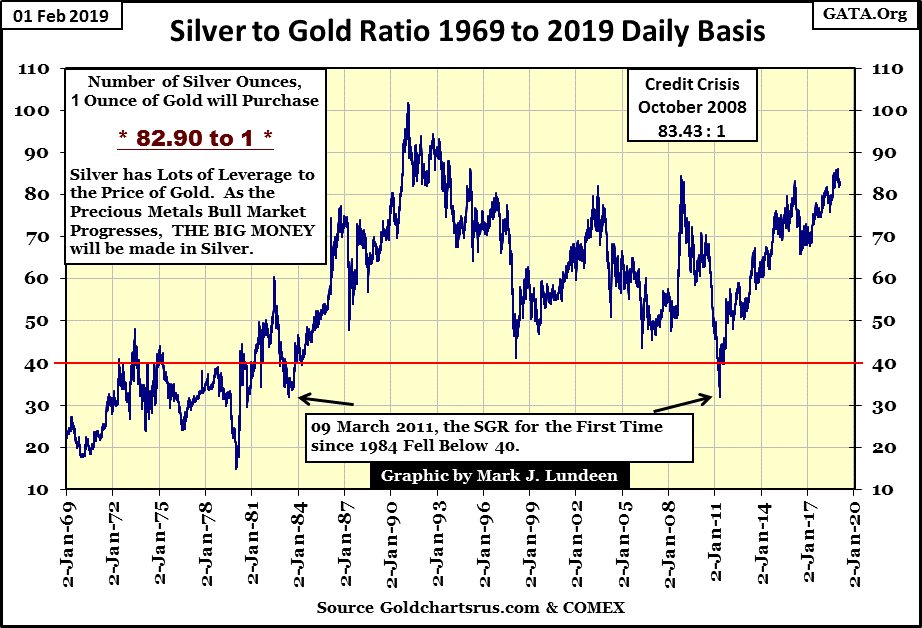
But so far in 2019, the financial markets have held up for the most part and the silver to gold ratio (SGR), or the number of ounces of silver one ounce of gold can be traded for has been stuck above 80 ounces of silver for one ounce of gold. As seen below, a SGR of +80 is on the high end of the range, meaning silver today is very cheap in terms of gold and anything else, like dollars, pounds, pesos or dinars.
We’ll be able to identify when the old monetary metals once again resume their advance as the SRG will once again decline towards its 40 line. From current levels (+80) that would make gains in investing twice that of gold. A SGR of 20 would make investing in silver four times that of gold. So why doesn’t every one buy silver instead of gold?
The biggest problem with silver is that where $1318 gets you one ounce of gold, the same amount of dollars will purchase over five pounds of silver. A box of gold eagles (500 one-ounce coins) costs about $660,000, and could be carried home by its new owner. An identical purchase of silver will purchase eighty boxes of silver eagles, or 40,000 silver eagles: 1.25 tons of metal.
This is why people with considerable wealth favor gold as storage is less of a problem. However for someone considering purchasing an ounce of gold for $1318, I’d strongly recommend they choose the five pounds of silver instead. When the SGR begins to trend down in the coming bull market in gold and silver, gains made in investing in silver will become multiples of any gold makes.
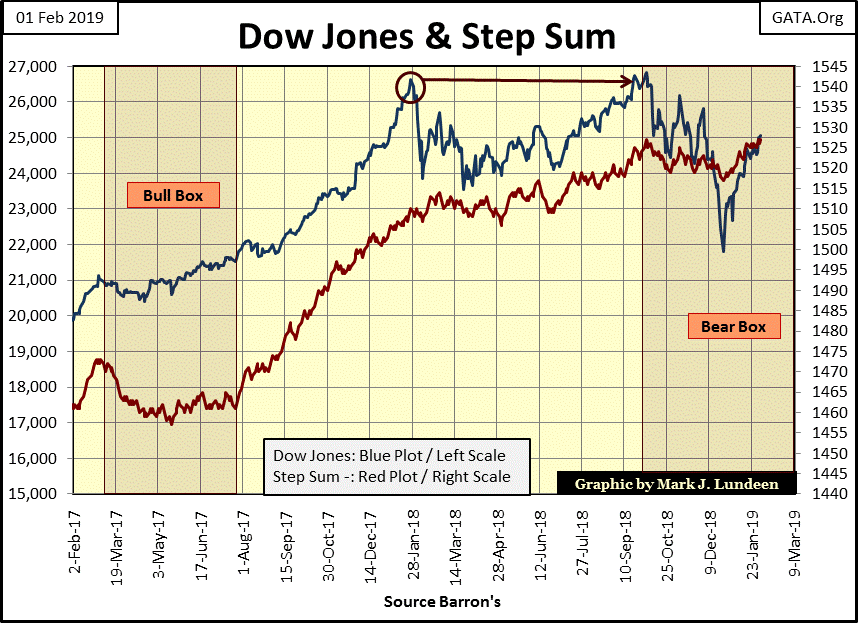
I’m ready to give the bear box below a failing grade. Like I said a bear box is called a bear box as the bears (not the bulls) are supposed to be right. I close a bear box when the step sum (market sentiment), finally collapses after months or years of ignoring the decline in the price of an asset, and finally submits to market reality recognized by the bears long before.
I think this is a failed bear box, as the price trend (market reality) and the step sum (market sentiment) have both reversed upwards, while not seeing a collapse in the step sum. But I’m not ready just yet to admit the bulls were right. I want to see if the Dow Jones can break above the line of resistance seen in the Dow’s daily bar chart above; that done this box has officially FAILED.
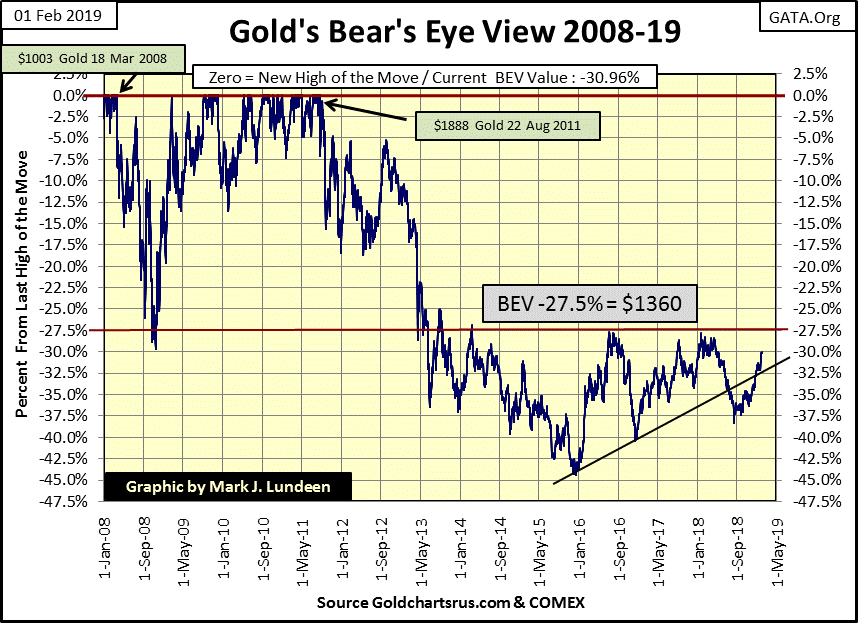
Here’s gold’s BEV chart, which is looking darn good. We see the December 2015 hard bottom; we’ll never see gold selling at that price ever again. Then for the next two years gold stayed about the rising trend line, making it a line of support. Then last summer gold broke below that line of support, making it now a line of resistance. But in the last couple of weeks gold broke above that line of resistance, and now has it eyes on its BEV -27.5% line ($1,360).
Will gold take out its -27.5% BEV line? I’m thinking it will. For one thing since December 2015 the US national debt has increased by more than $3 trillion dollars and the congress promises to add another trillion to the national debt this year. Also, real estate prices have become as ridiculous as they were in 2007&08. Need I say the “policy makers” have inflated another 8,000 points in the Dow Jones? There’s more, and though most investors are unaware of these factors, and if told wouldn’t care as long as the stock market continues to advance, but one of these days they will.
As bad as that will prove to be for stock market valuations, it will be the rocket fuel needed to ignite a resumption in the market advance in gold and silver.
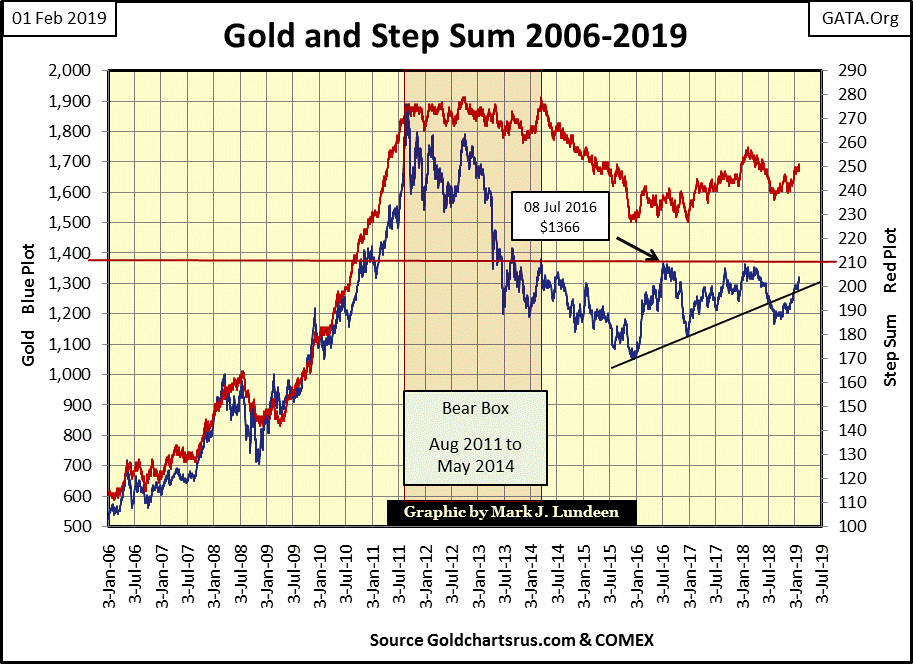
Here’s gold and its step sum, both trending upwards in a very bullish manner. Not much else to say, except I’m not expecting much in the way of excitement until the stock and bond markets begin deflating. When that condition is finally met, there will be days where the price of gold moves by +$100 from one day to the next. Hopefully sometime some time in 2019.
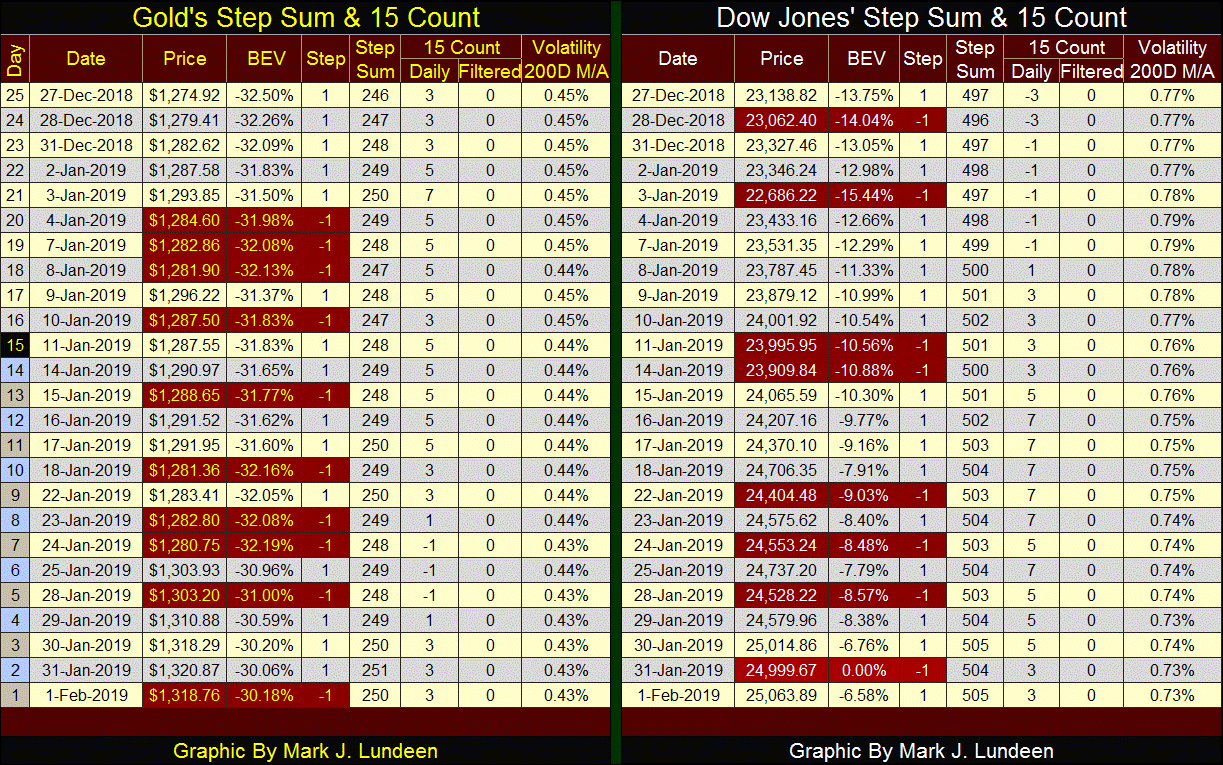
I’m not commenting on gold and the Dow Jones’ step sum table this week. It’s enough saying they are both bullish:
-
More advancing days than decliners
-
Rising step sums
-
Positive 15 counts
-
And most importantly rising valuations
Now and then I read someone’s work noting this or that national currency is outperforming the dollar price of gold. In other words how one central bank is inflating their national currency into worthlessness faster than our Federal Reserve. Interesting, but what about the other currencies?
As I have weekly forex and gold data going back years, I thought I’d create a table for this week’s article on gold priced in foreign exchange. My forex data is how many units of say pounds, pesos, or dinars $1 can be exchanged for, or the dollar rate. As my gold data is in US dollars, I merely have to multiply the dollar price of gold with the dollar rate of any particular currency, and that is that.
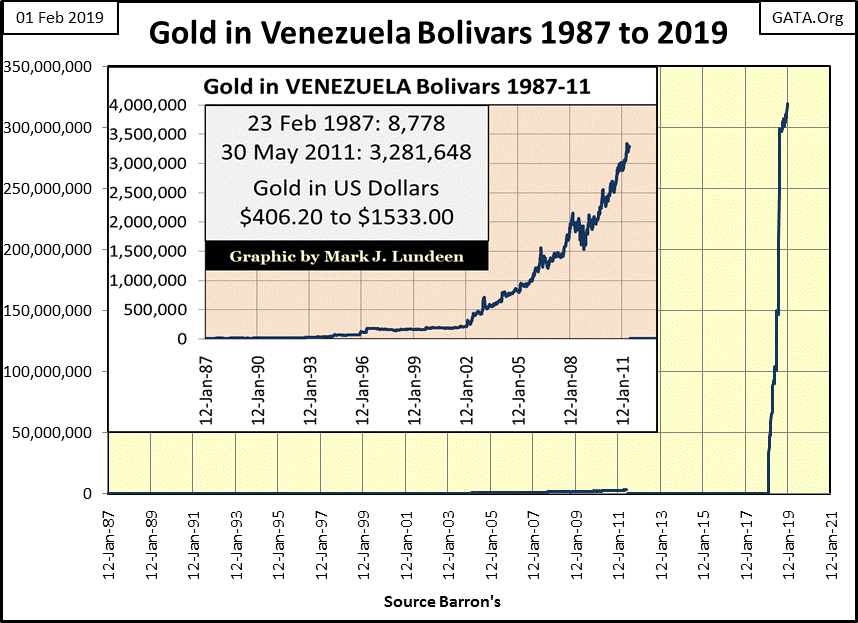
But sometimes the data is nonsensical. For one thing, since 1986 when my forex data begins, some countries had inflated their national currencies to worthlessness several times; the latest example being the Venezuela Bolivar. In February 1987 gold priced in bolivars was around 8,778 for an ounce of gold. As seen in the chart’s insert by the end of May 2011 an ounce of gold went for 3,281,648 bolivars, and only a fool would have traded an ounce of gold for any amount of bolivars.
The next week Venezuela stripped off three zeros from their currency, but that didn’t fix the problem. Keep in mind we’re dealing with a communist government here, and if there is one thing commies love to do is impose wage and price controls as they inflate their money supply. But ultimately this creates larger problems that can’t be solved by a legal fiction.
Exactly a year ago, those three zeros the “monetary authorities” stripped off their bolivar in 2011 came back in a single week. In the following year the price of gold in bolivars then took off to over 300 million.
So, was gold a good investment for someone in Venezuela? I don’t think one should look at it that way; think of it like this. For someone in February 1987 with a life’s savings of 100,000 bolivars, they could have purchased 11.39 ounces of gold. By May 2011 those 100,000 bolivars were worthless, but the 11.39 ounces of gold inflated to over 37 million bolivars. By January 2019 those 11.39 ounces of gold inflated to 3.41 billion bolivars. Does becoming a billionaire in Venezuela give one bragging rights in 2019? Maybe, then maybe buying those 11.39 ounces in 1987 only allows its owners to live as they did in 1987, if that is possible in a society that is self-destructing.
The data plotted in the chart above is the price of gold in bolivars, but let’s take a look at the bolivar’s dollar rate independent of gold. Barron’s a few weeks ago ceased publishing bolivar when it had increased to 248,756 to $1.00. However as recently as January 2018 (a year ago!) the bolivar’s dollar rate had been only 9.99, then in the following week it rocketed up to 24,971 bolivars to 1 US$.
How was that possible? Simple; the 9.99 rate was the official exchange rate banks paid out for dollars, while something over 24,000 was the black market (free market) rate seen on the streets of Caracas. A year ago the government gave up pretending anyone was going to sell a single US dollar for only 9.99 of their bolivars, and began recognizing the back street rate of 24,000 bolivars for $1.00.
In the following year the bolivar’s dollar rate increased by tenfold, to over 240,000. Multiplying that by the price of gold three weeks ago renders the price of gold for over 300 million bolivars. That’s a problem with me as it makes my table unwieldy with most currencies valuing gold in the four or five digits.
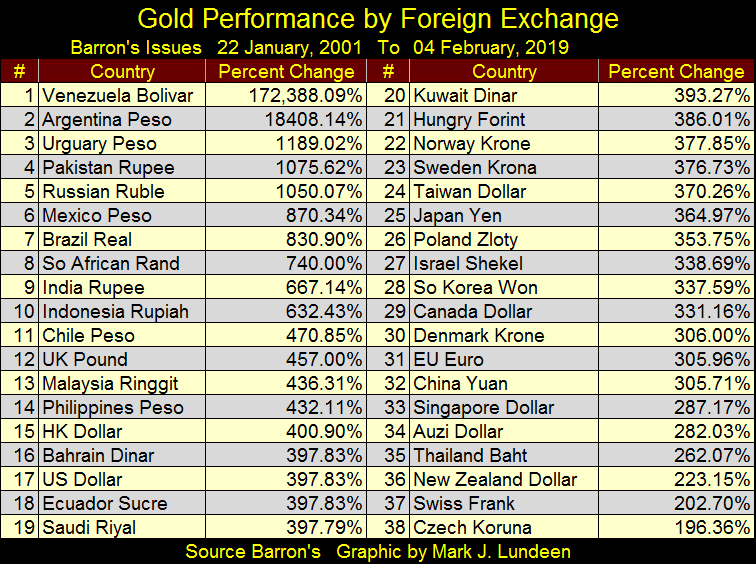
So I decided to render the data on the chart below in percentages rather than units of currency, from January 2001 to the first week of February 2019. The data for Venezuela’s bolivar is from Barron’s 07 January 2019 issue, as it’s the latest data available.
The dollar price of gold is at #17. Those currencies placed from #1 to #14 are being inflated by their central banks at a rate greater than the Federal Reserve is inflating the US dollar. These are countries I would recommend not to deposit any money into their banking systems.
Then there are those currencies that peg their inflation at the rate the Federal Reserve is inflating the US dollar, currencies #15 to #20. There are a lot of Persian Gulf oil kingdoms in that group.
The last group of currencies #21 to #38 are those national currencies whose central banks are inflating their money supplies at a rate less than the Federal Reserve. The Czech Koruna since January 2001 to the close of this week hasn’t yet seen the price of gold double, but it may have when gold priced in US dollars peaked in August 2011.
One thing to keep in mind is that none of these currencies are pegged to gold, but that just may change in the next ten years.
*********
Mark J. Lundeen


