Midas Touch Gold Model Summary


During the last two weeks the model changed from a buy signal to neutral and now to a sell signal. The GDX Daily-Chart is on a sell signal for the second week already while this weekend Gold in Indian Rupee, the US-Dollar Daily Chart as well as the US Real Interest Rate followed. Seasonality is neutral but will get negative towards the end of April. The Gold Daily Chart is still a buy but a move below $1.192 will increase the bearish signals.
The model suggests that Gold will fail at $1,220 and that the gold market is getting ready for the typical sell off in May/June.
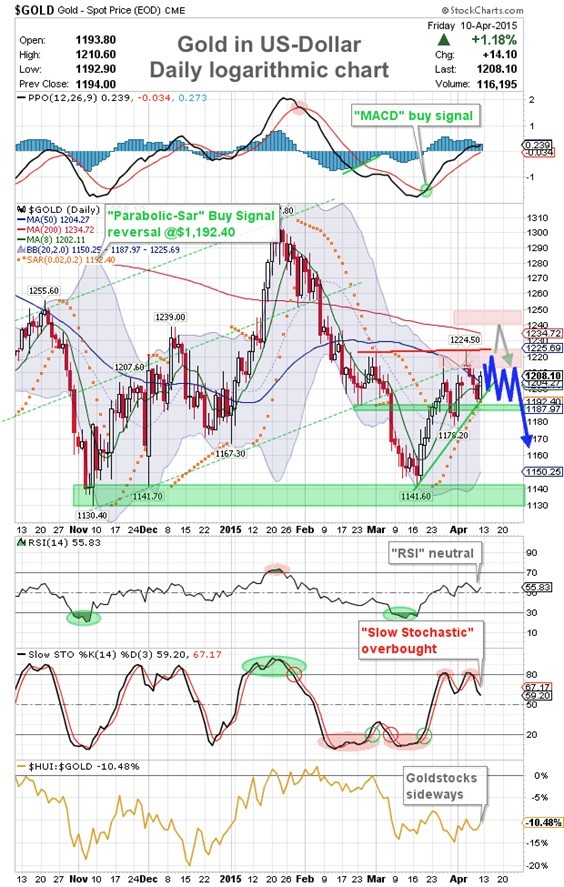
Gold Daily Chart
The impressive and fast recovery that started at $1,141 seems to be fading out in a sideways trap below the important resistance zone around $1,220. The two long doji candlesticks into this zone underline its heavy resistance. Gold has been fighting to regain the falling 50MA ($1,204). The stochastic is overbought and on a sell signal while the MACD is weakening but still with a buy signal from mid of march. The strong US-Dollar is not helpful here and continues to put pressure on gold and commodity prices. I think one or two more weeks of sideways trap is the most likely outcome before the bears will push Gold lower again.
As you know I am waiting for gold to end its bear market with a final panic sell-off down to $1.050 (actually more likely $1,035-$980). Not sure if this is still possible until June. If we get it I will call the end of this bear market. If Gold only hoovers around between $1,140-$1,225 I am afraid the bear market will extend.
My model is giving a sell signal so I´d be looking to enter a short into any recovery towards $1,210 and especially towards $1,220 with a st above last Monday´s high at $1,225.
The most promising strategy although remains to simply wait until May/June for the typical pre-summer bottom in Gold and the Goldstocks.
As an investors I suggest you wait for another chance to accumulate physical Gold below $1,150 until you hold 10-20% of your net-worth in physical Gold and Silver as an insurance.
Long-term personal view
The return of the precious metals secular bull market is moving step by step closer and should lead to the final parabolic phase (could start in summer 2015 or 2016 and last for 2-5 years or even longer).
Before this can start Gold will need a final selloff down to $1,050-$980.
Long-term price target DowJones/Gold-Ratio remains around 1:1.
Long-term price target Gold/Silver-Ratio remains around 10:1 (for every ounce of gold there are 9 ounces of silver mined, historically the ratio was at 15:1 during the roman empire).
Long-term price target for Gold remains at US$5,000 to US$8,900 per ounce within the next 5-8 years.
Fundamentally, as soon as the current bear market is over Gold should start the final 3rd phase of this long-term secular bull market. 1st stage saw the miners closing their hedge books, the 2nd stage continuously presented us news about institutions and central banks buying or repatriating gold. The coming 3rd and finally parabolic stage will end in the distribution to small inexperienced new traders & investors who will be subject to blind greed and frenzied panic.
********
Copyright © 2015 Midas Touch Consulting GbR, All rights reserved.
E-Mail: [email protected]
Website: www.goldnewsletter.de
 Florian Grummes (born 1975 in Munich) has been studying and trading the Gold market since 2003. In 2008 he started publishing a bi-weekly extensive gold analysis containing technical chart analysis as well as fundamental and sentiment analysis. Parallel to his trading business he is also a very creative & successful composer, songwriter and music producer. You can reach Florian at: [email protected].


