A New All-Time High Is Not Always Bullish


There is a significant amount of frustration from the bulls and bears alike as the market has been basically in a trading range for many, many months. So, before we go into my expectations for the coming months, I want to review how we got here.
As the market began its rally off the December lows of 2018, my initial expectation was that we could top out as we headed into the March/April time frame.
Clearly, the market had other intentions as it extended the timing for my correction expectations, and in quite a similar fashion as to what we saw in 2014-2015. Yet, we are still well within the price target expectations I outlined at the end of 2018
For those of you that followed my analysis for the last year, you would know that I expected at least a 20% correction to be seen in the market last year once we broke below the 2880SPX region. Before that correction began, my expectation was that the market could target the 2200SPX region.
However, as we moved through the November time frame, I modified my downside expectation to the 2285-2335SPX region before I expected another rally to be seen. And, as we now know, the futures hit a low of 2316 before the market began that rally into 2019. Even before the downside began in earnest in December, I provided my target for the next rally in the 2864-3011SPX region from the 2300 region low I was expecting.
As you can see in the chart provided to the members of ElliottWaveTrader.net posted in early December of 2018, my a-wave bottom in my primary count was in the low 2300 region, followed by my b-wave rally expectations, highlighted by the upper blue box.
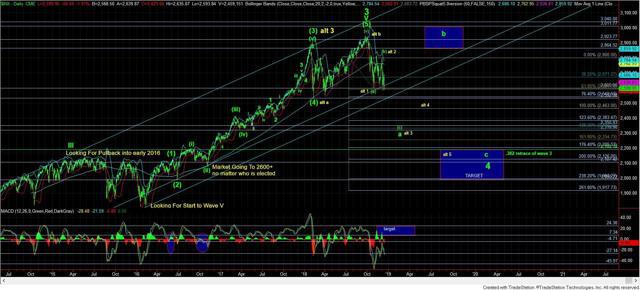
To this end, the market has followed our general expectations Since that time, I have slightly modified my larger degree wave count, but my overall expectations remain the same for 2020. But, the one thing that has changed is that it could take much longer than I had initially expected.
Along those lines, I would suggest you review the market action from October 2014 through the 2015 time-frame. From the point the bottom was struck in October of 2014, the market seems to be an almost prefect fractal copy of what have experienced since the December 2018 low. For this, and many other reasons that I have outlined in depth to the members of ElliottWaveTrader.net, I still maintain a minimum downside target of 2820SPX for the next decline phase I expect, even if we should see a new all-time high in the coming week or two.
Upper support now resides in the 2970-2990SPX region, and as long as we hold that support on corrective pullbacks, the 3040/45SPX resistance region remains in focus. However, should we see a break down below that upper support in the coming week or two, and see a sustained follow through below 2955, that should point us towards our minimum downside target of 2820SPX in the coming weeks.
Additionally, I want to highlight that the 2820SPX region is a minimum target for the next decline I expect. If we continue to follow the 2014-2015 market fractal, that decline can take us well below that minimum target. Yet, once that next decline completes a 5-wave downside structure, I expect us to rally back up towards the all-time high again as we head into the first quarter of 2020, and even potentially make a higher all-time high.
The structure of the rally I expect into the first quarter of 2020 will tell us if we are ready to rally to our long-term target of 3800-4100SPX or if we are setting up for a secondary plunge in 2020 to a deeper 4th wave target. For now, my expectations follow the latter scenario, but I do not have to make a decision regarding that potential until we see the market rally after the next plunge I expect completes.
This current update is a bit more detailed than I normally provide in the public arena, and it also outlines my expectations over the coming months. The main reason I am providing this detail is because of the significant frustration I am seeing in the market with this range-bound trading.
Yet, some of you may find this outline of my expectations a bit confusing, since you are likely used to reading linear analysis from others (despite the market not being linear).
While my charts outline these expectations more clearly, I don’t think it to be fair to provide those charts, since we have over 5000 members who pay for that detailed work from us. But, try to follow the progression that I attempted to outline above, as it is giving you much more insight than those who take a rather superficial and simplistic approach in viewing that “the market can either go up or down.”
Overall, the market is stuck in a region wherein it has potential for 30% higher levels to be seen from here over the coming years, but it also has 30% potential downside which can be seen from here before we begin a rally towards those higher targets. For now, I am still in the camp of us setting up that larger potential decline, until the market is able to prove otherwise. But, also recognize this is not something that will likely happen overnight.
And, I know many of you are snickering when you read that I think the market has potential for a 30% decline from here. But, I experienced the same snickering when we called for a top to gold in August 2011 at $1,915 during a parabolic gold rally, and when we called for a multi-year rally in the dollar back in July of 2011 despite all the QE being thrown at the market, and when we called for a gold bottom back at the end of 2015, and when we called for a rally in TLT from 112/113 to at least the 135/136 region back in November of 2018 while the Fed was still raising rates, and when we called for a 20% correction in the stock market when we broke 2880SPX back in October of 2018, etc.
So, ultimately, I believe we are now “stuck in the middle” in the equity market. And, it certainly has felt like it. Yet, it will likely take several more months before the market makes its intentions clear as to whether we are going to rally to that 3800-4100SPX region sooner rather than later. My analysis right now points to later rather than sooner, but I will retain an open mind based upon what I see in the rally I expect into the first quarter of 2020 (but likely from lower levels).
See chart illustrating Avi's wave counts on the S&P 500.
********
 Avi Gilburt is a widely followed Elliott Wave technical analyst and author of ElliottWaveTrader.net, a live Trading Room featuring his intraday market analysis (including emini S&P500, metals, oil, USD & VXX), interactive member-analyst forum, and detailed library of Elliott Wave education. You can contact Avi at: [email protected].


