Price Base-Line Shifts in Commodities (1957 – 2014)
Animals exist in an eternal now; to them the past means little and the future an incomprehensible impossibility. People are different, or at least they should be able to see the past as a key to future possibilities, but sadly, when it comes to economics we too often fail to make a connection between what was to what might be. The events of the credit crisis of 2007-09 are now long forgotten by most investors now that five years separate us from them. But I’m different; my future expectations are influenced by events that occurred centuries before I was born, such as China’s experiment with paper money whose historical consequences are summed up by a quote by William Durant in his “Our Oriental Heritage” below:
"Such were the sources of that flood of paper money which, ever since, has alternatively accelerated and threatened the economic life of the world."
-William Durant: Our Oriental Heritage, (1935) pg. 780
That was written during the Great Depression, the Federal Reserve’s first monetary/economic disaster.
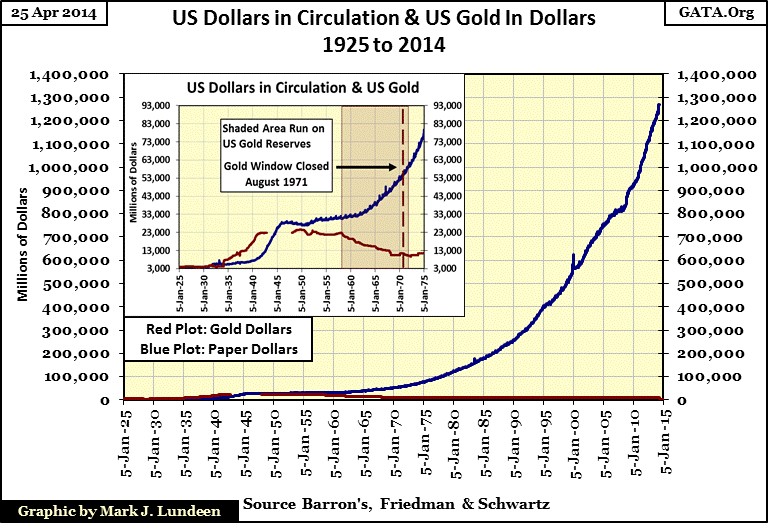
Being human, I can project China’s 11th century paper money catastrophe to our current monetary system with a quick look at the chart below. Can you? We can be sure Fed Chairwoman Janet Yellen and the rest of the FOMC can’t. Regrettably, history teaches us one thing: the “best and the brightest” in economics and politics learn nothing from history, or do most of today’s working folks who trust expert opinion seen on television as informative, useful and truthful – it’s not.
What you will never see in our financial media is the above “flood of paper money” that ultimately proved so devastating to China a thousand years ago, Germany’s Weimar Republic a hundred years ago and will soon lay waste to today’s debt backed American dollar. That’s how I see it, so I’m not someone who has sympathy for investors who whine that gold and silver went down last week, last month or last year because there are historical forces currently at play that will drive the old monetary metals to dollar valuations that will shock people in the years to come. In fact, if people had any sense of history they would be shocked at today’s prices. Let’s look at some charts to see how monetary inflation flowing from the Federal Reserve has impacted food prices since 1957.
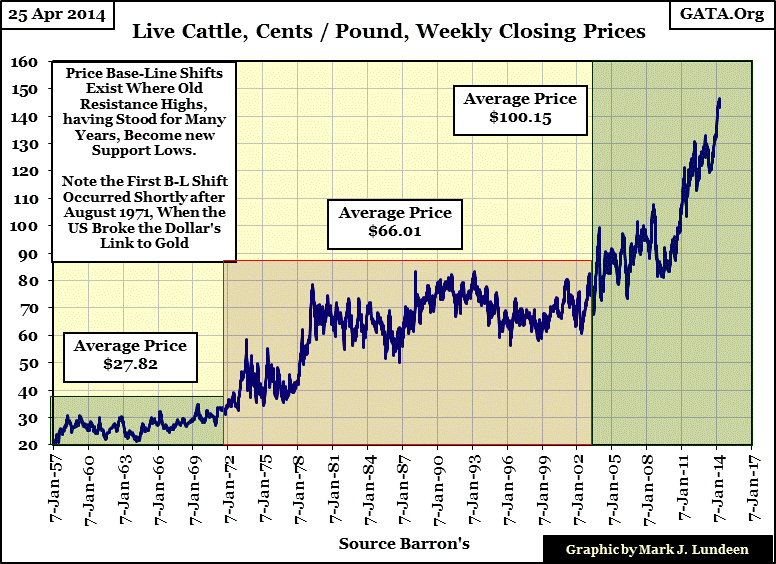
We see two base-line shifts in the price of beef since 1957, where old resistance lines (price ceilings) become new support lines (price floors), the first occurred shortly after the US Treasury demonetized gold in August 1971, the second shortly after the popping of the high-tech bubble in 2000. There are many factors influencing the price of beef; weather, disease, demographic trends, but Keynesian economists will never explain rising beef prices as a function of central bankers mindlessly expanding the money supply. If these lords of academia were honest people they would.
My commodity price data goes back to 1957, but it would be a mistake believing the prices seen from 1957 to 1971 above were not inflated above those of earlier decades; the following quote from 1951 makes that clear.
“November 15, 1951 [the dollar] reached a new low of 53 cents in terms of 1935-1939 dollar value. In extended comment on the shrinkage of the dollar, the National City Bank’s December Letter says: “From the standpoint of the creditor—the buyer of Savings bonds, the pensioner, the insurance beneficiary, the school teacher with lagging pay—the experience during and since World War II has been disheartening. Inflation is a concealed type of tax and these are the people who took the brunt of it.” - Barron’s Editorial, 31 Dec 1951
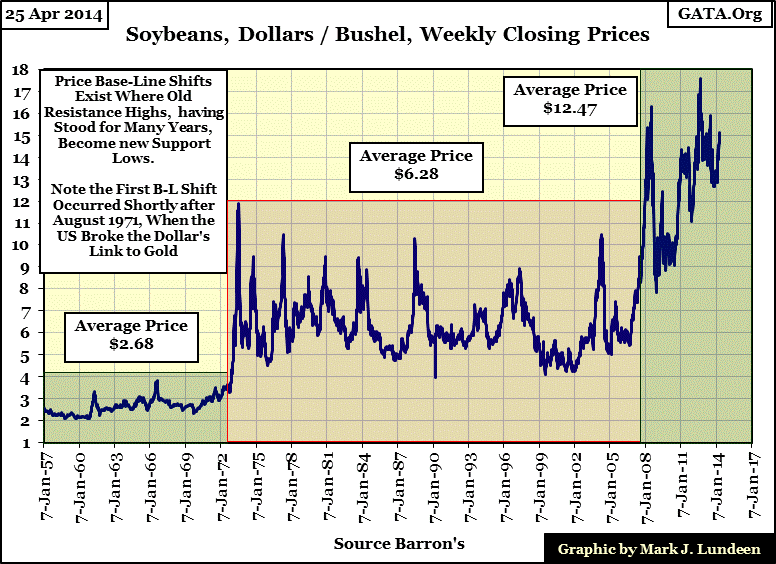
Let’s look at soybeans; same story except that its second price base-line shift didn’t occur until 2008. Be that as it may, the “liquidity” flowing from the Federal Reserve will lift soybean prices to above $20, and then some in the years to come.
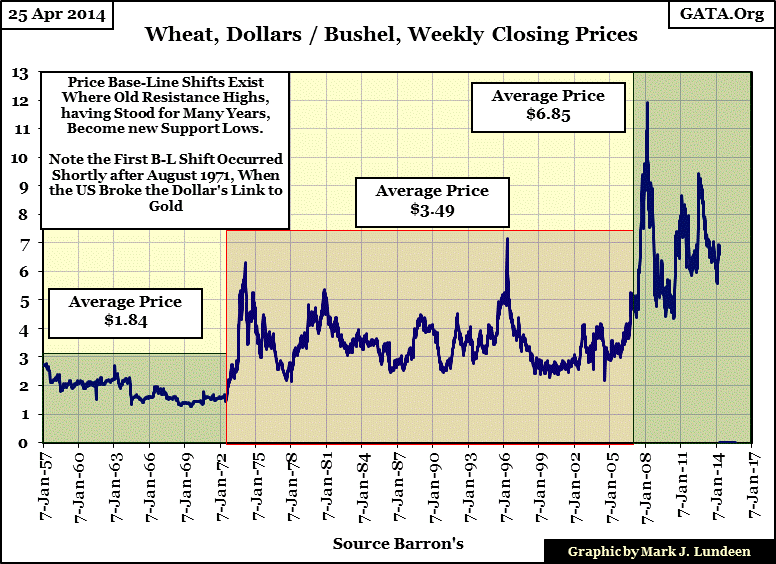
The price history of a bushel of wheat looks familiar.
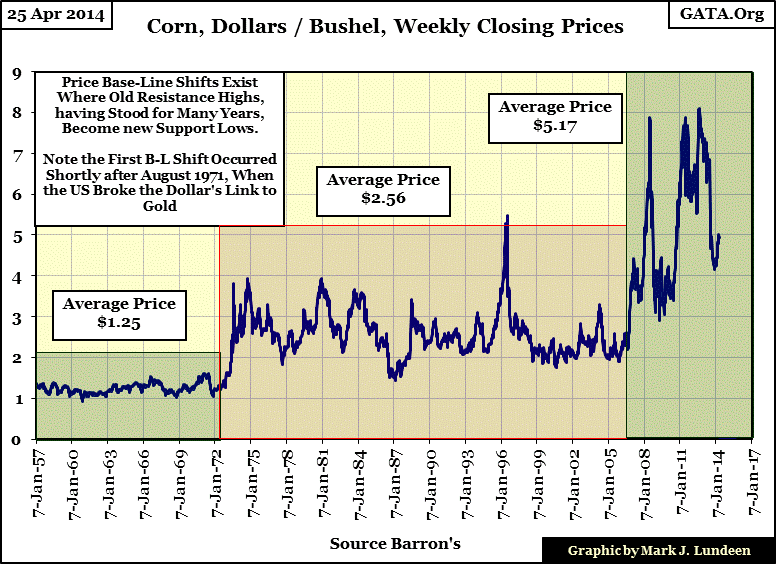
As does the price history for a bushel of corn.
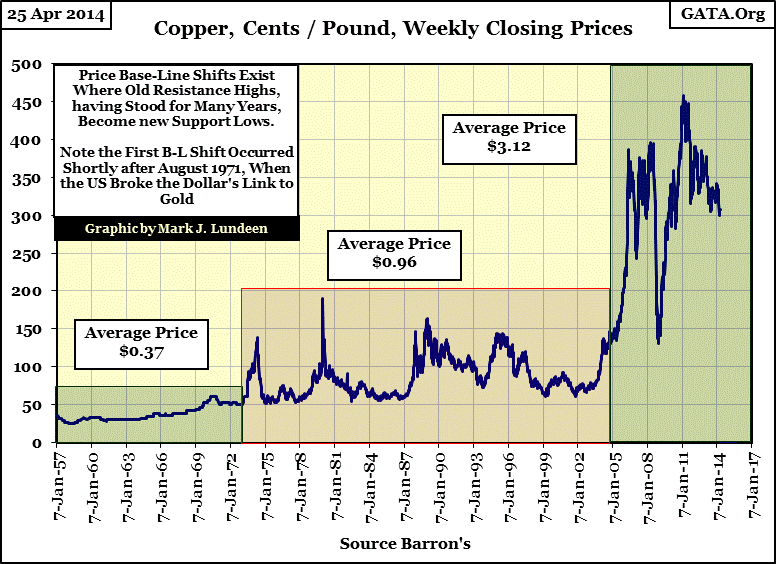
Copper is frequently called “Doctor Copper” by market pundits for its ability to predict future economic trends. That makes sense as when business is booming copper is in great demand by manufacturers producing finished products for sale, and when business conditions become soft demand for copper declines as does its price; or so goes the theory.
Exactly what is “Doctor Copper” telling us with its second (2005) price base-line shift? Business was booming during the 2001-07 housing bubble, but can a booming economy explain an eight fold increase in the price of copper? And as expected the price of copper did decline during the credit crisis, but an eight month 67% decline from April to December 2008 seems a bit extreme. Note how this whopping price decline found support just under $1.50, copper’s old resistance level from 1972 to 2005. Then copper, like the price of beef, soybeans, corn and the Dow Jones took off to new all-time highs as the Federal Reserve began its program of quantitative easing, as the economy began what many market commentators call “the Great Recession” that continues today.
It’s safe seeing current inflationary price pressures as greater than what the US Department of Labor’s Consumer Price Index would have us believe. If price increases seen in retail outlets finished goods have lagged behind those seen in the charts above, it’s only because the retail industry understands its customers are heavily indebted (and taxed) and can’t afford the inflationary burdens the Federal Reserve is heaping on the economy. Unable to raise retail prices in line with rising inflation, business has to be seeing their profit margins squeezed. That makes current record earnings for the Dow Jones and S&P 500 dubious.
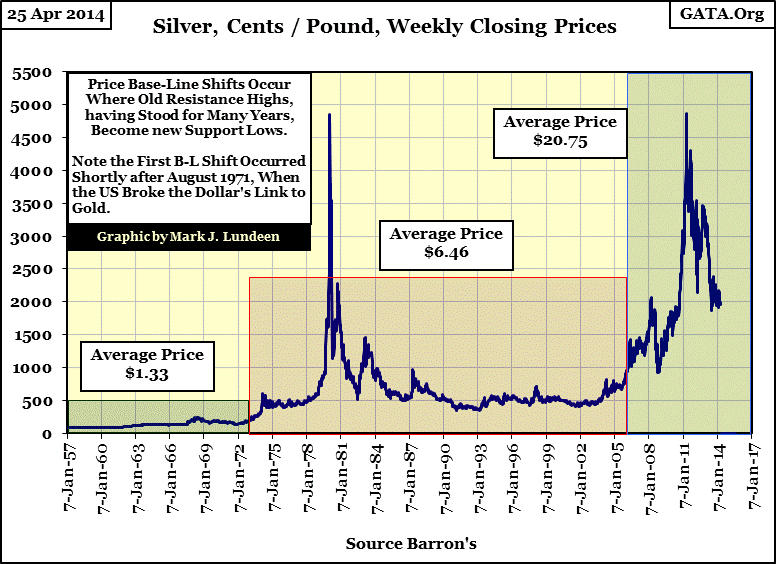
Gold and silver too have seen two base-line shifts in their prices since 1957. Silver is very interesting as its current all-time high still dates from January 1980, but the chart below shows that much has changed since 2005 when silver saw its second base-line shift in the past six decades. Looking at silver’s six decades of price history, with another quick peek at my first chart plotting the growth of paper dollars in circulation since 1925, it’s easy making the case that a tremendous bull market in silver is still intact with the best yet to come. But then there are always Wall Street analysts employed by the big banks writing investment reports that silver’s best days are behind us. Just remember for the most part these people failed to predict the huge price advances in gold and silver from 2001 to 2011, and were clueless when the high-tech and mortgage bubbles’ approached their termination.
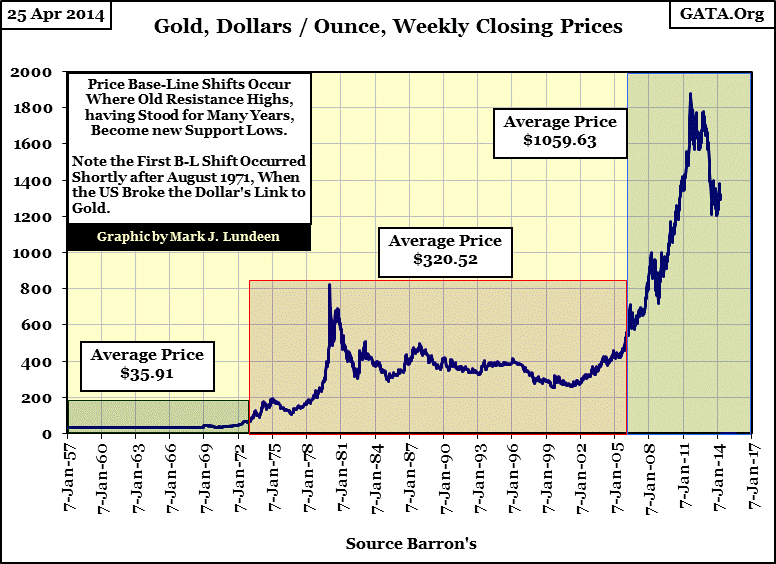
Gold’s chart below is more in-line with the other commodities charts seen in this article. Analysts at Goldman Sachs have actually predicted the price of gold falling below $1,100 this year. Well maybe, but should they be correct it would only happen because traders at JP Morgan and Goldman Sachs are allowed to short paper gold contracts (silver contracts too) in unlimited volume by the US Government regulators. But any price decline failing to break below $400 would still be well within the context of gold’s second base-line shift, and no one is predicting that. Most likely any gold price that approaches $1,000 an ounce would prove to be short lived as the inflationary pressures unleashed by the Federal Reserve with their QE program will eventually reassert themselves, ultimately taking gold in the spot market far above its current all-time high of $1,888.
One thing to keep in mind concerning the Federal Reserve; they were created by act of Congress to inflate the money supply for the benefit of the banking system and Washington’s political class. In other words, the swelling money supply is intended to inflate financial assets creating bull markets for Wall Street, guarantee bids for the US Treasury market and to keep the voters happy for Washington's entrenched political class. So, monetary inflation managed by Ivy League Ph.Ds. is not supposed to result in soaring prices for food, energy, retail goods or gold and silver.
That’s the plan anyways, but things don’t always go as planned because every bull market has a shelf-life. With the top in the high-tech bull market the expiration date for the stock-market bull expired in January 2000 and the real estate bull market expired in 2007. As all inflationary bull markets are fated to deflate into a bear market, the inflationary bucks created by Federal Reserve either get up and move into another area of the economy that’s inflating, or remain in the deflating asset class as bank, insurance companies and pension funds reserves as well as hopeful investors’ net worth deflate with them. Here is why Doctor Bernanke began his QE programs; to forestall the inevitable deflation of market bubbles he and Alan Greenspan inflated in financial assets and real estate – but Mr Bear won’t let them get away with it. The day is coming when deflation will force wealth to flee Wall Street’s financial assets and seek shelter in inflating commodities and precious metals, and that is when things become interesting for gold bugs. Rising bond and dividend yields will herald the coming end of the post Bretton Wood’s dollar era.


