Seeking An Antidote To Global Trade Jitters? Check Out These Buying Opportunities!


After being mostly absent in 2017, volatility has made a comeback. The S&P 500 Index closed down for the first three months of 2018—the first time it’s done so in 10 quarters. It also had its worst start to April since 1929. Gold performed as expected during the quarter, serving as a safe haven and delivering positive returns, while the price of oil surged more than 5 percent on U.S. dollar weakness and news that OPEC and Russia could be cooperating to limit output for a long period.
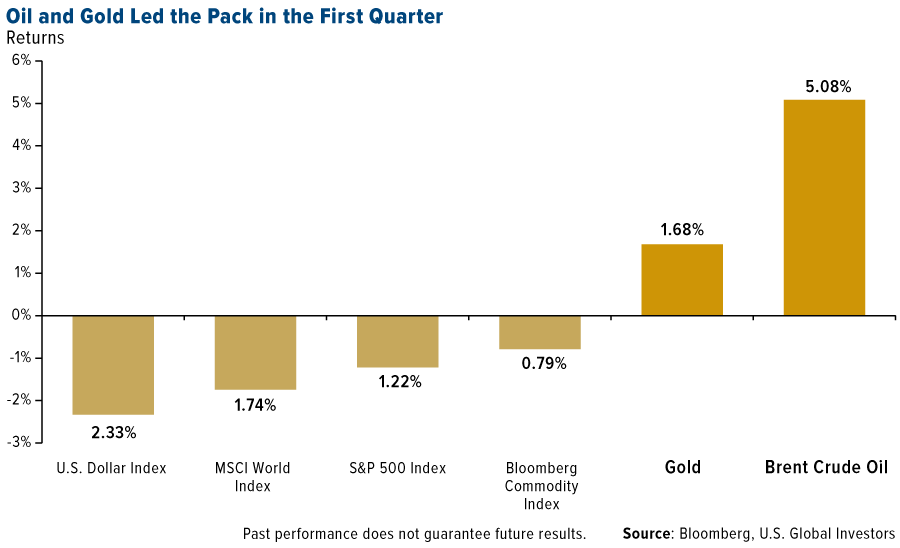
Before continuing, I think it’s important for investors to remember that each asset class has its own DNA of volatility. For the 10-year period as of April 4, the 60-day, or quarterly, standard deviation for the S&P 500 was ±8 percent. What this means is that, even though the S&P was down 1.22 percent in the first quarter, the decline was well within its expected range of one standard deviation, which occurs roughly 68 percent of the time.
The same can be said for oil and gold. For the same time period, oil had a standard deviation of about ±20 percent, while gold bullion’s is right in line with the S&P: ±8 percent. That all of these assets stayed within one standard deviation for the 60-day trading period makes their performance a non-event. It’s when they exceed two standard deviations that investors might want to consider a trade, as the asset could be ready to revert back to its mean.
To learn more about standard deviations and other technical issues, download my whitepaper, “Managing Expectation: Anticipate Before You Participate in the Market.”
Look Past the Short-Term Noise
Much of the recent selloff has been related either to fears over a potential trade war with China, the world’s second-largest economy, or expectations that tech stocks—most notably Facebook and Amazon—could face additional regulatory scrutiny.
Although U.S. tariffs on Chinese imports, and China’s proposed taxes on American goods, have not been imposed yet, markets are already beginning to price in the news. Shares of Boeing, the largest U.S. exporter by value, have dropped more than 8 percent since their high on February 27, following announced U.S. tariffs on imported steel and aluminum and China’s plan to levy as much as 25 percent on American-made aircraft. Aircrafts, by the way, are hands-down the United States’ most valuable export, followed by gasoline.
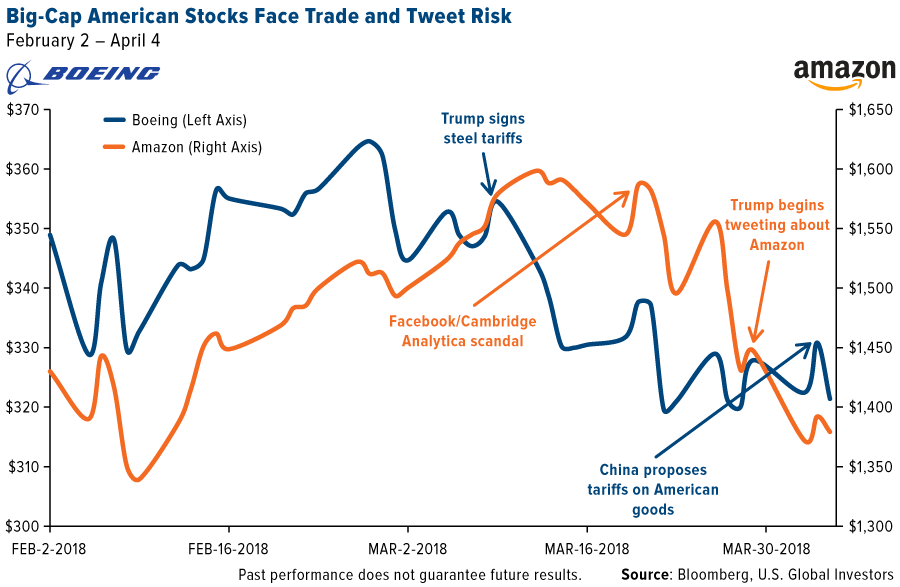
Meanwhile, Trump’s criticism of Amazon’s shipping deal with the U.S. Postal Service, not to mention the media’s negative coverage of Facebook’s relationship with British political consulting firm Cambridge Analytica, weighed especially hard on tech stocks.
(This is nothing new, though. To educate investors on how quants comb through social media and use sentiment analysis to make their trades, I like to show this video featuring the Trump and Dump Bot, which you can watch here.)
To be clear, I believe this is all short-term noise—even after Trump suggested adding tariffs on an additional $100 billion of Chinese goods Friday to combat the effects of alleged intellectual property theft. A trade war could be a concern sometime down the road, but I’m confident U.S. and Chinese officials can work together to avert a full-blown tit-for-tat standoff.
But if this risk is too great at the moment, an attractive place to be could be in domestic-focused, small- and mid-cap stocks, which have limited exposure to international trade compared to their large-cap siblings. They therefore could see little impact from any imposed tariffs.
Small-Cap Stocks, Big-League Growth
For the first quarter of 2018 and for the month of March, small-cap domestic stocks, as measured by the S&P 600 Index, ended with a positive gain. The S&P 400 Index, composed of mid-cap stocks, did slightly less better in March and gave up more than 1 percent in the first quarter.
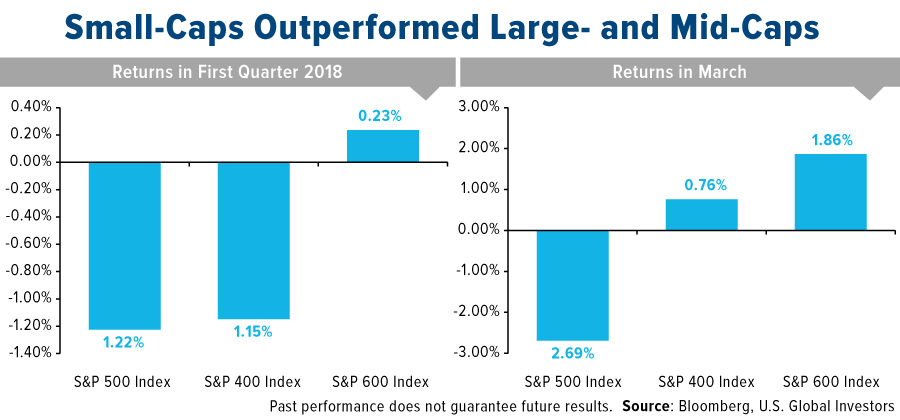
Both groups fared better than the 500 largest U.S. companies, which were hit by international trade jitters. S&P 500 firms, after all, derive about half of their profits from overseas markets.
If you recall, small-caps skyrocketed in the days immediately following the 2016 presidential election as investors anticipated the implementation of “America first” policies—deep corporate tax cuts, deregulation, tariffs on imported goods—that would greatly favor inward-facing companies.
Investors are making a similar bet today.
That’s not to say investors should rotate completely out of blue-chip stocks. Earnings per share (EPS) for S&P 500 companies are expected to come in very strong in the first quarter, according to FactSet data. However, it might be prudent to consider increasing your exposure to smaller firms with less dependence on trade with China and other countries.
Consider what small business owners themselves are saying. The most recent monthly Index of Small Business Optimism, conducted by the National Federation of Independent Business (NFIB), came in at 107.6, the second-highest reading in the survey’s 45-year history. And 32 percent of small business owners say now is a good time to expand, the highest percentage ever. This prompted NFIB economists William Dunkelberg and Holly Wade to write: “After years of small businesses sitting on the sidelines and not benefiting from the so-called recovery, Main Street is again on fire.”
Interested in learning how you can diversify with mid- and small-cap stocks? Click here!
Hedge Funds Are Jumping Back into Gold—What About You?
At the same time, there are some early warning signs of potential economic turbulence on the horizon. I would highly urge investors to ensure a portion of their portfolio is in a historically reliable store of value—investment-grade municipal bonds, for instance, and gold bullion and gold mining stocks.
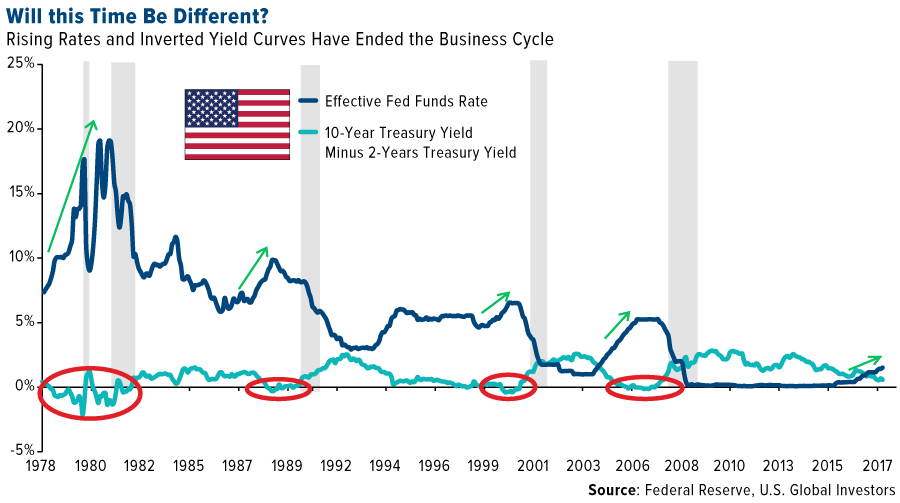
One of the indicators some economists have their eye on right now is what’s known as the flattening yield curve—or the difference between long-term and short-term Treasury yields. When the latter exceeds the former, the yield curve is said to invert, and in the past this has often preceded an economic slowdown.
Recently, the difference between the 10-year and two-year T-note dropped below 50 basis points for the first time since October 2007. And with interest rates expected to be hiked three or four times this year, the yield curve could very well flatten even further.
It could be for this reason, among others, that we’ve seen a huge jump in hedge funds betting on gold. According to Kitco News, citing Commodity Futures Trading Commission (CFTC) data, money managers increased their speculative long positions in gold futures by 34,928 contracts to a total of 183,080 for the week ended March 27. This represents the most significant jump in bullish sentiment in two years.
Investors’ attention is “back on gold,” George Gero, managing director with RBC Wealth Management, told Kitco. He added: “The gold market has solid geopolitical underpinnings.”
Explore investment opportunities in gold mining by clicking here!
Standard deviation is a measure of the dispersion of a set of data from its mean. The more spread apart the data, the higher the deviation. Standard deviation is also known as historical volatility.
A basis point, or bp, is a common unit of measure for interest rates and other percentages in finance. One basis point is equal to 1/100th of 1%, or 0.01% (0.0001).
The U.S. dollar index (USDX) is a measure of the value of the U.S. dollar relative to the value of a basket of currencies of the majority of the U.S.'s most significant trading partners. The Bloomberg Commodity Index is a broadly diversified index that tracks the commodities markets through commodity futures contracts.
The S&P 500 measures the value of stocks of the 500 largest corporations by market capitalization listed on the New York Stock Exchange or Nasdaq Composite. Standard & Poor's intention is to have a price that provides a quick look at the stock market and economy. The S&P Mid-Cap 400 Index tracks a diverse basket of medium-sized U.S. firms. A mid-cap stock is broadly defined as a company with a market capitalization ranging from about $2 billion to $10 billion. The S&P Small- Cap 600 Index consists of 600 small-cap stocks. A small-cap company is generally defined as a stock with a market capitalization between $300 million and $2 billion.
The Small Business Optimism Index is compiled from a survey that is conducted each month by the National Federation of Independent Business (NFIB) of its members.
All opinions expressed and data provided are subject to change without notice. Some of these opinions may not be appropriate to every investor. By clicking the link(s) above, you will be directed to a third-party website(s). U.S. Global Investors does not endorse all information supplied by this/these website(s) and is not responsible for its/their content.
Holdings may change daily. Holdings are reported as of the most recent quarter-end. The following securities mentioned in the article were held by one or more accounts managed by U.S. Global Investors as of 12/31/2017: The Boeing Co.
********
 Frank Holmes is the CEO and Chief Investment Officer of U.S. Global Investors. Mr. Holmes purchased a controlling interest in U.S. Global Investors in 1989 and became the firm’s chief investment officer in 1999. Under his guidance, the company’s funds have received numerous awards and honors including more than two dozen Lipper Fund Awards and certificates. In 2006, Mr. Holmes was selected mining fund manager of the year by the Mining Journal. He is also the co-author of “The Goldwatcher: Demystifying Gold Investing.” Mr. Holmes is engaged in a number of international philanthropies. He is a member of the President’s Circle and on the investment committee of the International Crisis Group, which works to resolve conflict around the world. He is also an advisor to the William J. Clinton Foundation on sustainable development in countries with resource-based economies. Mr. Holmes is a native of Toronto and is a graduate of the University of Western Ontario with a bachelor’s degree in economics. He is a former president and chairman of the Toronto Society of the Investment Dealers Association. Mr. Holmes is a much-sought-after keynote speaker at national and international investment conferences. He is also a regular commentator on the financial television networks CNBC, Bloomberg and Fox Business, and has been profiled by Fortune, Barron’s, The Financial Times and other publications. Visit the U.S. Global Investors website at http://www.usfunds.com. You can contact Frank at: [email protected].


