Silver/Gold Ratio Is A Guide As Inflation Signals Fade Again


The interplay between gold and silver is a critical component to understanding what is out ahead; to understanding whether long-term Treasury yields will rise and if they rise, whether it will be due to inflationary pressures. It is a critical component to understanding whether cyclical commodities and other aspects of a greater inflation/reflation trade will finally break existing downtrends. See…
The Continuum is Still in the Deflation Camp (9.24.19)
Pictures of a Reflationary Bounce-a-Thon (9.11.19)
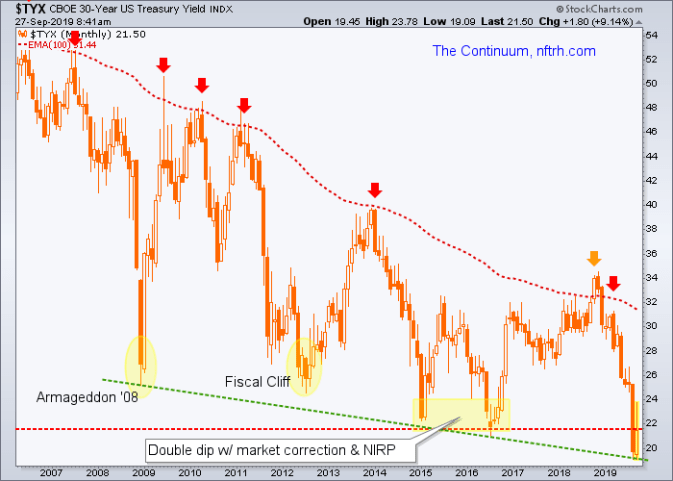
The first and more recent post noted that the 30yr yield needs to climb above 2.2% to even think of hinting toward a temporary inflation trade. The chart from that post shows that while the Continuum is of a long, deflationary structure the periodic pings upward to the (monthly EMA 100) limiter often represent times of cyclical inflationary bursts. This morning the 30 year yield stands at 2.15%.
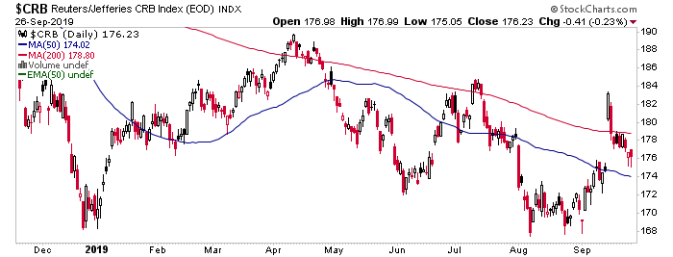
As for the older post linked above, it was personally a little difficult not to buy in (other than for a couple of ‘bounce’ trades) to the prospect of the global inflation that Central Banks are trying to summon. But that post and others have routinely shown intact downtrends in the inflatables. So it was a case of ‘break the trends and we’ll talk inflation trade’. Here are the daily charts of the CRB index and a key headline commodity.
CRB bounced hard, aided by oil’s big spike on the Saudi refinery strike. The moving averages trend down however, so buying commodities was buying into a downtrend. That is usually the stuff of hope and little else.
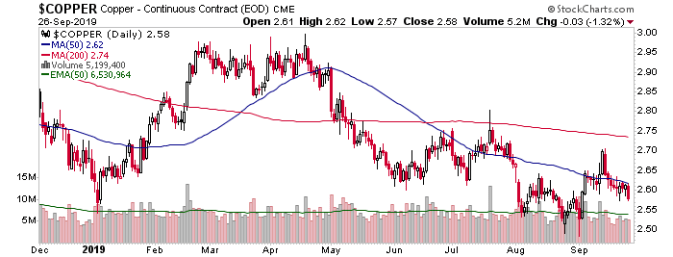
Doctor Copper, economic Ph.D. and all, continued to prescribe dis-inflation as higher highs were not made and moving average trends remained down.
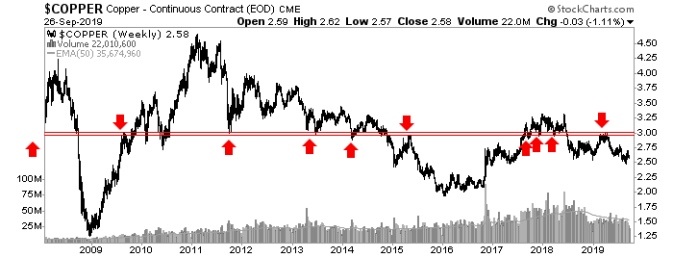
A longer-term view of copper adds no relief to the picture. Indeed, it adds firm evidence that there is no technical reason yet to expect a positive outcome by investing in this premier industrial metal.
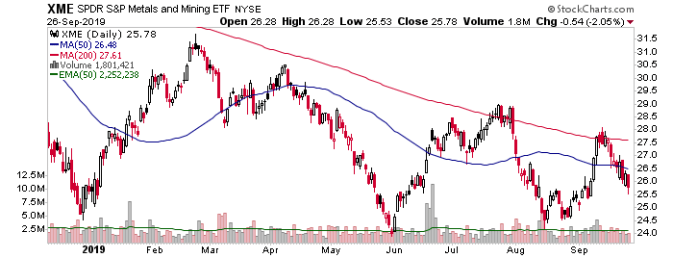
The Metals & Mining ETF was one of only two vehicles I used to trade the bounce, somehow managing to fortuitously sell right at the SMA 200. But was it actually fortuitous or was it just a market participant thinking “profit in hand but an existing downtrend… take the damn profit!”? Oh yes, it was that second thing.
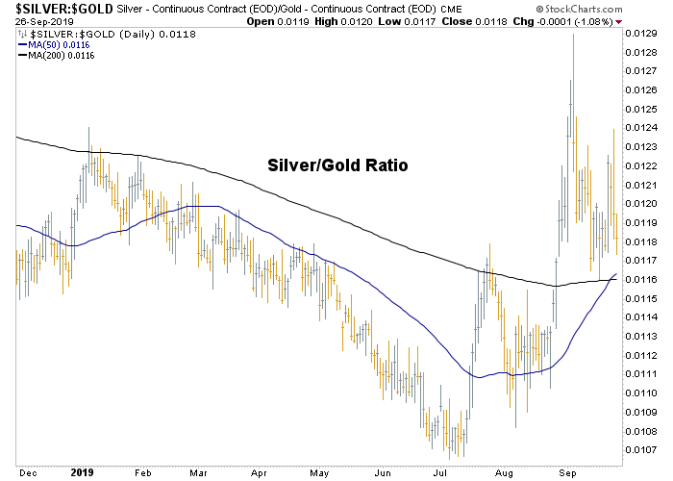
And so here we are, in the midst of a precious metals correction updating not only the key downside supports/targets (each week in NFTRH, but also gauging the interplay of the two precious metals because while this (daily) chart is technically trying to establish a new uptrend in Silver (more relative cyclical commodity characteristics) vs. Gold (more relative counter-cyclical, non-commodity characteristics)…
…this (monthly) chart has been advising patience with the process.
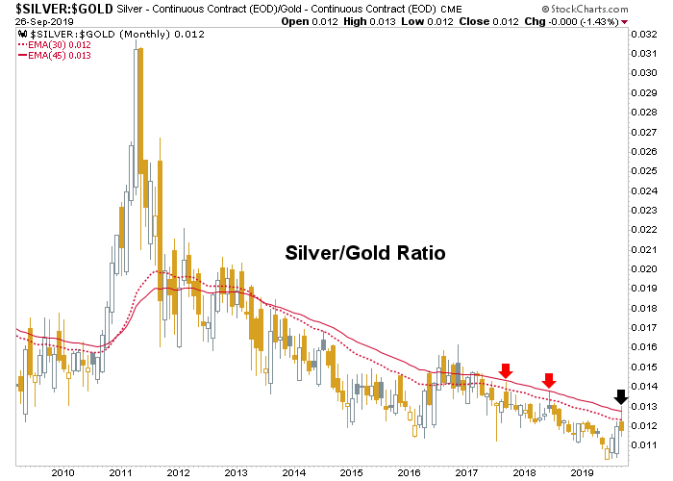
There are many other signals to watch for aside from silver’s interplay to gold. These include the above-noted long-term Treasury yields, inflation expectations gauges like the 10 and 5yr Inflation Breakevens, Yield Curves, etc. But among the simplest are the charts above. Commodities are generally locked in daily chart downtrends and Silver/Gold is trying to break a still intact long-term downtrend.
Counter-intuitively, if I am a deflationist (which I must ultimately be given the as yet unaltered Continuum over decades interrupted by periodic inflationary bursts) I look forward to a lack of inflation signals in the macro markets if I am a gold stock bull (which I must also be given my minority view among a majority of inflation-centric gold bugs of gold mining counter-cyclicality) then I look forward to finding a bottom in the current correction because it could be the best buy in what could be a longer bull market, as opposed to the likes of the 2016 burst that ultimately failed as cyclical and inflationary forces took over by the middle of that year.
Gold could merely out-perform cyclical assets in a deflationary macro, while the miners would leverage that out-performance. It’s the same drum we’ve been beating against the constant inflationary gold bug “death of the dollar” type promotions for the last 15 years. The miners rose into 2008 despite rapidly degrading fundamentals and over valuation (as gold under-performed cyclical commodities).
Today, despite the correction – or what we can call the running of the inflationists – the value proposition for the miners will become excellent once again if the macro stays as is and stock markets take a Q4 correction as currently expected.
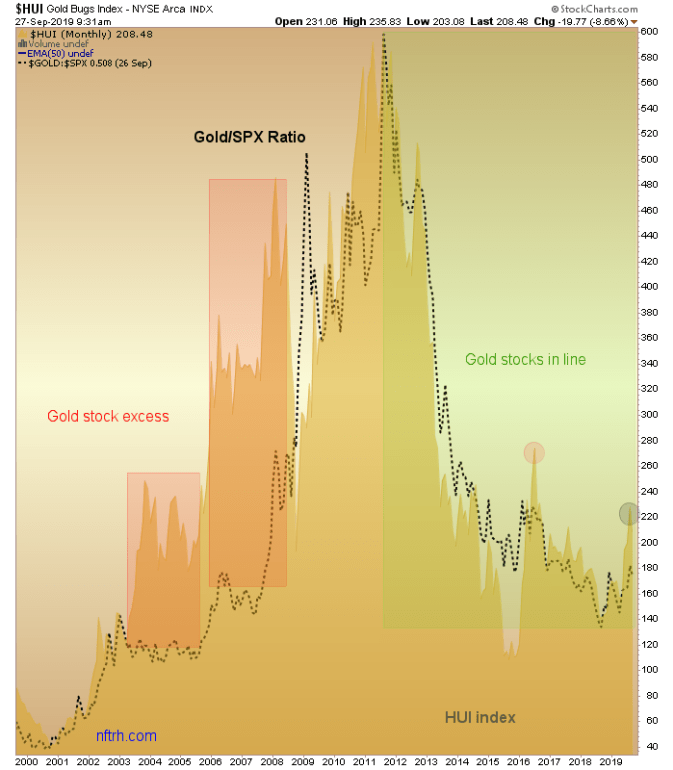
Here is a final chart we’ve been using in NFTRH to gauge how HUI got ahead of itself in relation to another macro indicator, Gold/SPX. The black dot represents a similar condition to the 2016 top. The macro caught a second wind and that was all for the gold miner rally. See again…
AMAT Chirps, b2b Ramps, Yellen Hawks and Gold’s Fundamentals Erode (5.30.16)
However, if the macro does not shift cyclical/inflationary as it did in 2016 you are going to see an epic buy on the gold sector at the bottom of this correction.
Meanwhile, it’s time to shake out the inflationistas and the…) for an in-depth weekly market report, interim market updates and NFTRH+ chart and trade setup ideas. You can also keep up to date with actionable public content at NFTRH.com by using the email form on the right sidebar and get even more by joining our free eLetter. Follow via Twitter @NFTRHgt or StockTwits.
********
More from Gold-Eagle


