A Somewhat Ugly COT Report


Yesterday in Gold, Silver, Platinum and Palladium
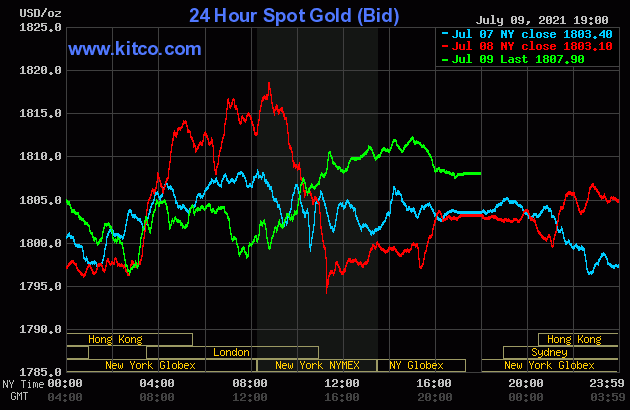
The gold price had a choppy up/down move in Far East trading on their Friday -- and the low tick of the day was set about fifteen minutes before the London open. It had another choppy up/down move between then and 8:45 a.m. in New York. A rally commenced at that juncture, which got capped and turned lower at 3 p.m. in after-hours trading. That sell-off lasted exactly one hour -- and then gold price trading flat into the 5:00 p.m. EDT close.
The low and high ticks were recorded by the CME Group as $1,796.60 and $1,813.00 in the August contract. The August/October price spread differential in gold at the close yesterday was only $1.50...October/December was $2.50 -- and December/February was $2.10 the ounce.
Gold was closed in New York on Friday afternoon at $1,807.90 spot, up $4.80 from Thursday. Net volume was extremely light at around 128,500 contracts -- and there was a hefty 67,000+ contracts worth of roll-over/switch volume out of August and into future months...mostly December.
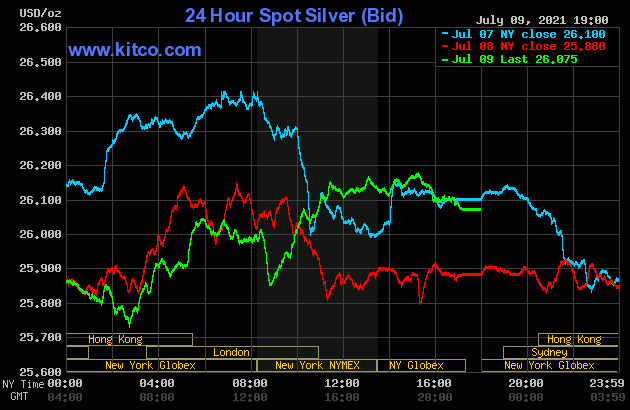
The silver price wandered quietly sideways until around 9:45 a.m. China Standard Time on their Friday morning. The price pressure began at that point -- and the low tick, like in gold, came very shortly before the London open. Its ensuing rally got capped minutes before 11 a.m. BST -- and from there it traded sideways until it got kicked downstairs a bit starting minutes after the COMEX open. Like in gold, its New York low tick was set at 8:45 a.m. EDT -- and its ensuing rally ran into 'something' around 11:25 a.m. It crawled a bit higher from there until around 3:15 p.m. in after-hours trading -- and was then sold a bit lower going into the 5:00 p.m. EDT close.
The low and high ticks in silver were reported as $25.82 and $26.30 in the September contract. The July/September price spread differential in silver at the close yesterday was 2.3 cents...September/December was 4.5 cents -- and December/March was 4.7 cents.
Silver was closed on Friday afternoon in New York at $26.075 spot, up 19.5 cents on the day. Net volume was very light as well, at a bit under 44,000 contracts -- and there was only about 2,140 contracts worth of roll-over/switch volume in this precious metal...mostly into December.
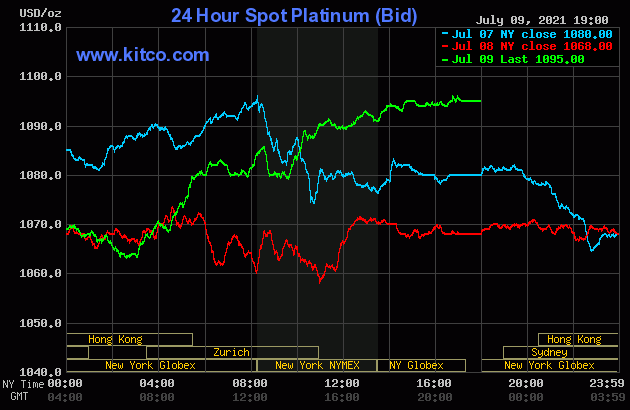
The platinum price traded quietly sideways until around 12:30 p.m. China Standard Time on their Friday afternoon -- and from that juncture it was sold quietly lower until a few minutes after the Zurich open. Its quiet and somewhat uneven rally from there lasted until around 2:45 p.m. in after-hours trading in New York -- and it didn't do a thing after that. Platinum finished the Friday session at $1,095 spot, up 27 dollars on the day.
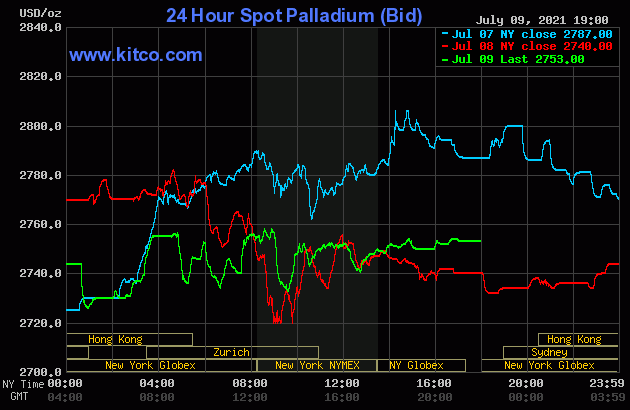
Palladium had a very quiet, choppy and erratic sideways-to-higher price move on Friday -- and finished the day at $2,753 spot, up 13 bucks from its close on Thursday.
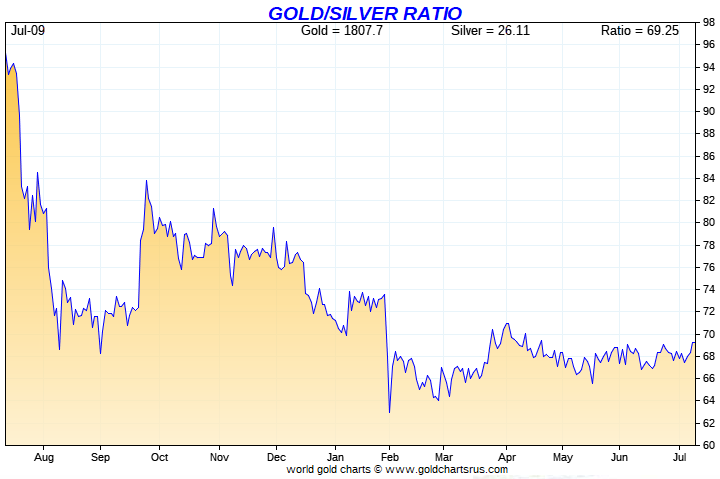
Based on the kitco.com closing spot prices in silver and gold posted above, the gold/silver ratio worked out to 69.3 to 1 on Friday...compared to 69.7 to 1 on Thursday.
And here's Nick's 1-year Gold/Silver Ratio chart, updated with the last five days of data.
------
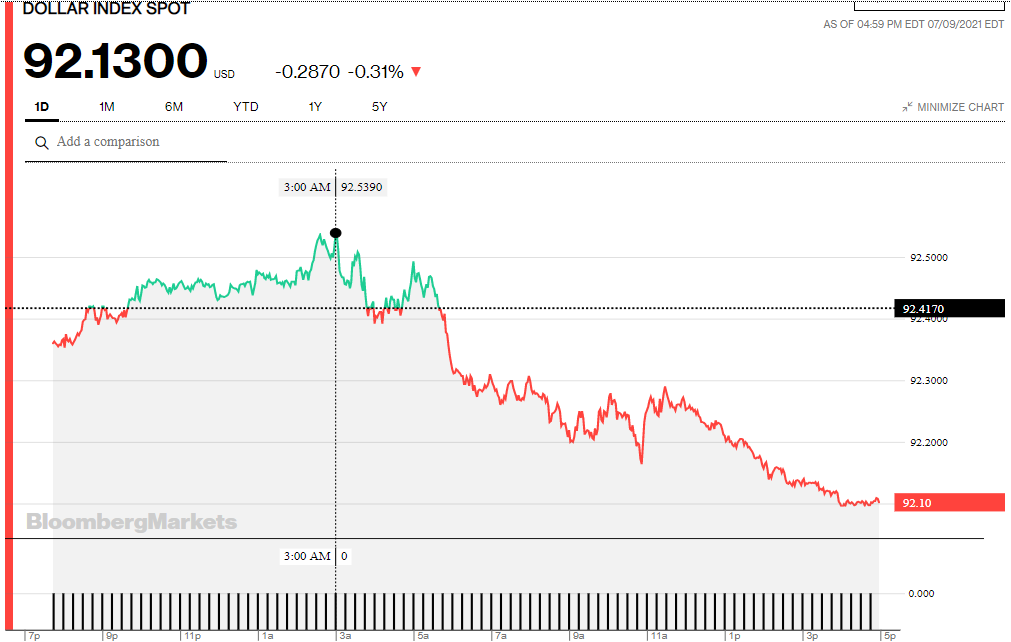
The dollar index closed very late on Thursday afternoon in New York at 92.417 -- and opened down about 5.5 basis points once trading commenced around 7:45 p.m. EDT, which was 7:45 a.m. China Standard Time on their Friday morning. It rallied quietly from there, with the 92.09 high tick set at the 8:00 a.m. open in London. It was a quiet ride down hill from that juncture until around 4:05 p.m. in New York -- and it traded flat until the market closed at 5:00 p.m. EDT.
The dollar index finished the Friday session in New York at 92.13...down just about 29 basis points from its close on Thursday -- and 3 basis points above its indicated spot close on the DXY chart below.
Here's the DXY chart for Friday, courtesy of Bloomberg.
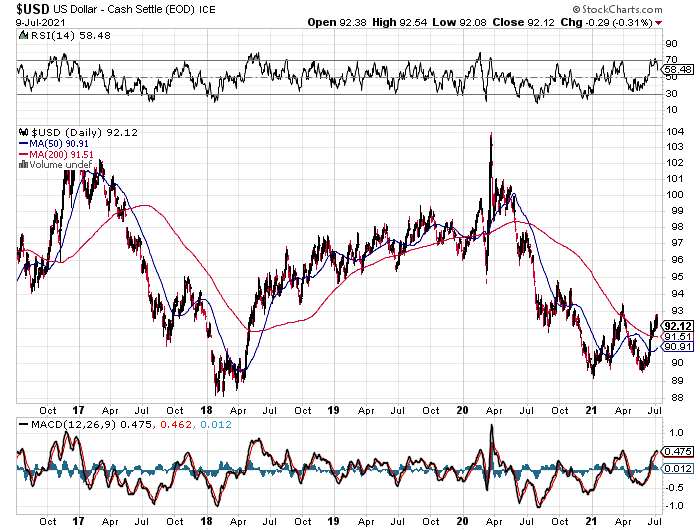
And here's the 5-year U.S. dollar index chart that appears in every Saturday column, thanks to the good folks over at the stockcharts.com Internet site. The delta between its close...92.12...and the close on the DXY chart above, was about 1 basis point below its spot close on Friday.
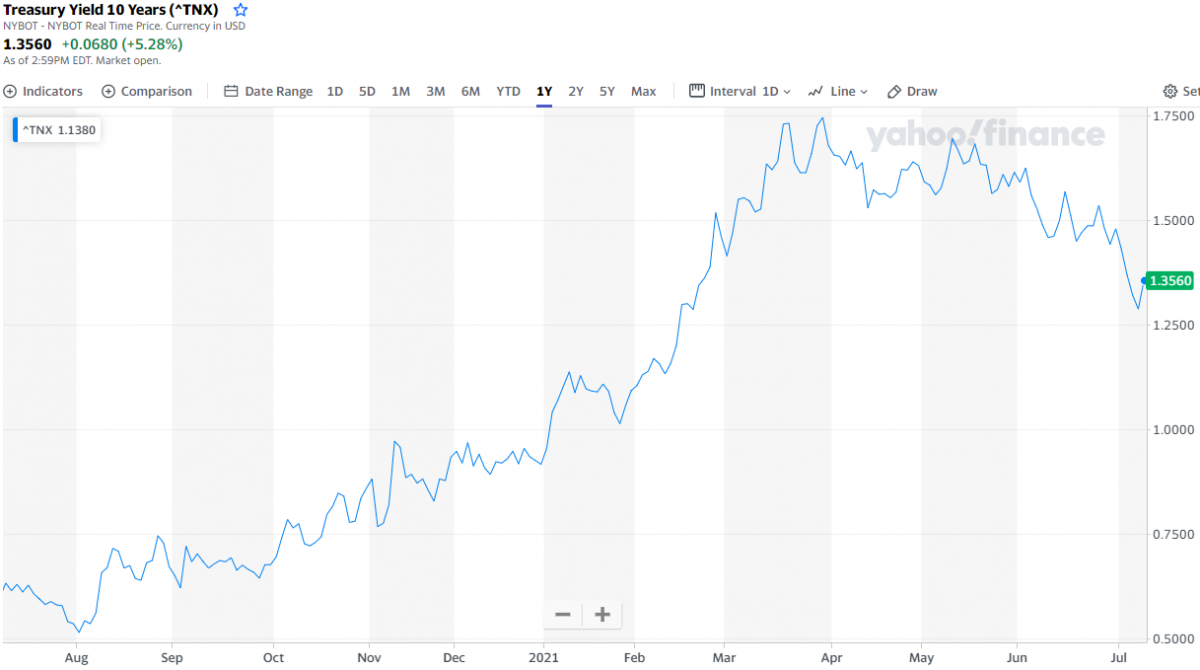
U.S. 10-Year Treasury: 1.3560%...up 0.0680 (+5.28%)...as of 2:59 p.m. EDT. Here's the one-year 10-year U.S. Treasury chart, courtesy of finance.yahoo.com as always -- and as I keep pointing out, you can see where the Fed began yield curve control in March.
----
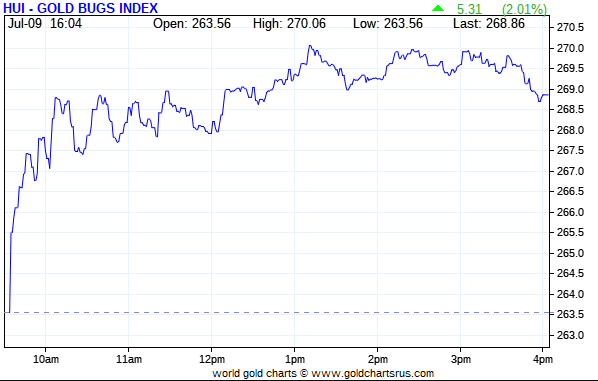
The gold stocks rallied right from the 9:30 a.m. open of the equity market in New York on Friday morning, but moderated starting a few minutes after 10 a.m. EDT. They crept higher until around 1:10 p.m. -- and then drifted sideways until they were sold a bit lower in the last thirty minutes of trading. The HUI closed up 2.01 percent.
Generally speaking, the silver equities followed a very similar price path as the gold shares, including a tiny decline in the last twenty minutes of trading. Nick Laird's Intraday Silver Sentiment/Silver 7 Index closed higher by 2.70 percent.
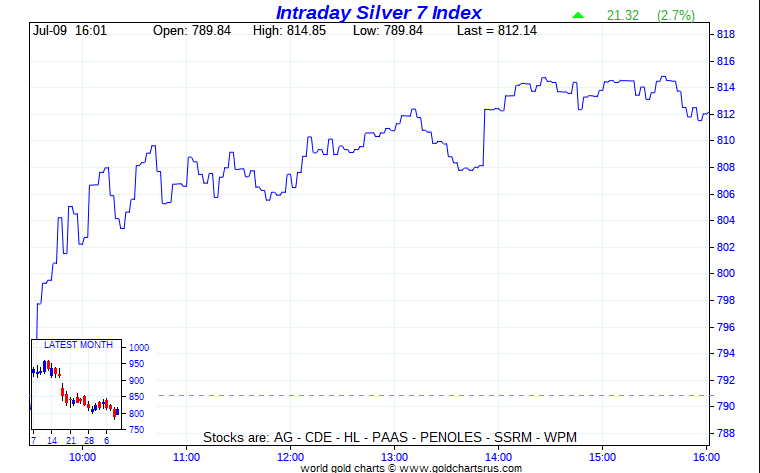
Computed manually, the above index close up 2.81 percent.
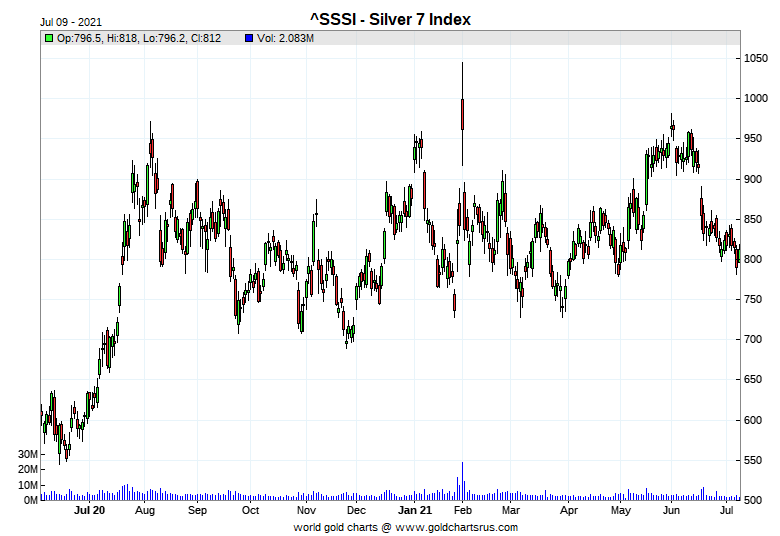
And here's Nick's 1-year Silver Sentiment/Silver 7 Index chart, updated with Friday's candle.
There were no real stars yesterday -- and the underperformer was First Majestic Silver, as it closed higher by only 1.67 percent.
The first eye candy from the reddit.com/Wallstreetsilver crowd is from U.K. reader Nigel McHale -- and it's the first photo linked here. The other contribution is from Anthony Harnett -- and it's the first photo linked here.
---
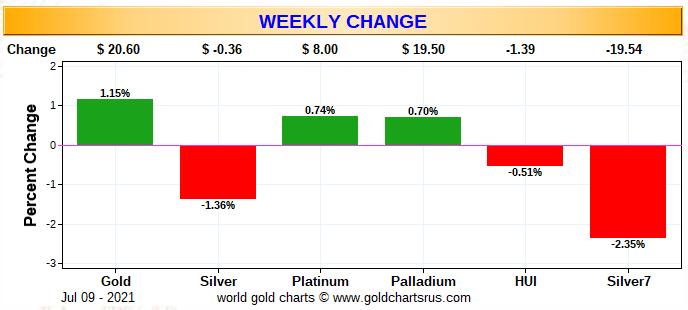
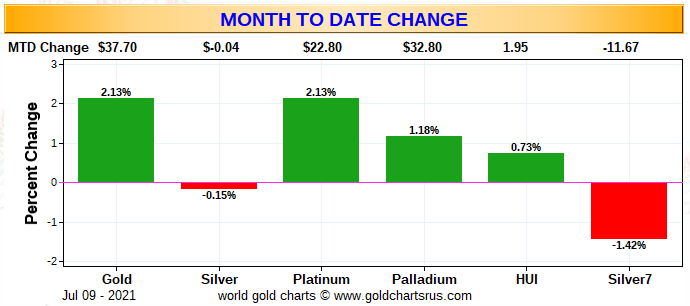
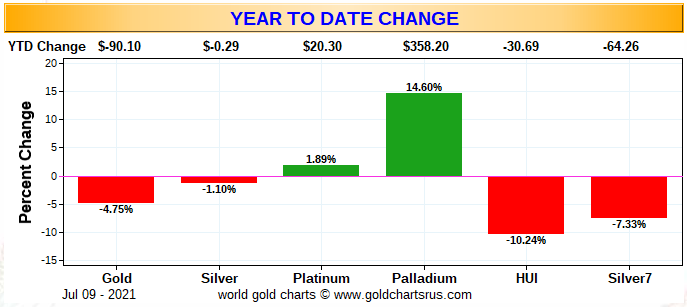
Here are the usual three charts that show up in every Saturday missive. They show the changes in gold, silver, platinum and palladium in both percent and dollar and cents terms, as of their Friday closes in New York — along with the changes in the HUI and the Silver 7 Index.
First off is the weekly chart -- and only silver is down, as the other three precious metals recorded tiny gains. But the loses in their associated equities, is clear proof of just how short a leash that the powers-that-be have kept the precious metals on all week.
Here's the month-to-date chart, which only has two more days of data compared to the weekly chart. It looks a bit better because only silver and its associated equities are in the red for the month of July.
And here's the year-to-date chart. Gold and its associated equities have certainly been the underperformers so far. Although in all fairness, silver's performance has been only marginally better -- and its associated equities are obviously underperforming the metal itself. That's been the case all year.
As Ted Butler has pointed out on many occasions, the short positions of the Big 8 traders in general -- and the Big 4 short commercial traders in particular, are the sole reasons that precious metal prices aren't at the moon already, as every other group of traders in the COMEX futures market are net long against them in all four precious metals...including virtually all the rest of the traders in their respective commercial categories.
In the COT discussion further down, the commercial traders increased their short positions in both gold and silver during the reporting week...and by far more than I was expecting. The Big 4 traders also increased their short positions in silver and in gold -- and the '5 through 8' big shorts in silver actually decreased their short position.
---
The CME Daily Delivery Report showed that 123 gold and 15 silver contracts were posted for delivery within the COMEX-approved depositories on Tuesday.
In gold, there were four short/issuers in total -- and the three largest were JPMorgan, Advantage and Citigroup, issuing 92, 14 and 13 contracts out of their respective client accounts. There were seven long/stoppers -- and the biggest was BofA Securities, as they picked up 54 contracts in total...50 for their house account, and the other 4 for clients. Next were JPMorgan and Advantage, stopping 40 and 13 contracts for their respective client accounts. Goldman was in fourth spot, picking up 10 contracts for its client account as well.
In silver, the two short/issuers were ADM and JPMorgan, issuing 9 and 6 contract. The biggest of the four long/stoppers was JPMorgan, as they picked up 10 contracts. All contracts issued and stopped involved their respective client accounts.
In platinum, there were 54 contracts issued and stopped.
The link to yesterday's Issuers and Stoppers Report is here.
So far this month there have been 965 gold contracts issued/reissued and stopped -- and that number in silver is 5,872 contracts. In platinum, there have been 3,061 contracts issued and stopped, which is quite a few -- and zero contracts in palladium.
The CME Preliminary Report for the Thursday trading session showed that gold open interest in July rose by 14 contracts, leaving 327 still around, minus the 123 contracts mentioned a few paragraphs ago. Thursday's Daily Delivery Report showed that 51 gold contracts were actually posted for delivery on Monday, so that means that 51+14=65 more gold contracts were added to July deliveries. Silver o.i. in July declined by 238 contracts, leaving 874 still open, minus the 15 contracts mentioned a few paragraphs ago. Thursday's Daily Delivery Report showed that 198 silver contracts were actually posted for delivery on Monday, so that means that 238-198=40 more silver contracts disappeared from the July delivery month.
Total gold open interest at the close yesterday rose by 9,013 COMEX contracts, a number I certainly wasn't happy to see, although it could be mostly spread related as per Ted Butler. Total silver o.i. declined by 1,338 contracts.
Both numbers are subject to slight adjustments [usually downwards] when the final numbers are posted on the CME's website on Monday morning CDT.
---
There were no reported changes in GLD yesterday, but an authorized participant removed 927,002 troy ounces of silver from SLV.
In other gold and silver ETFs and mutual funds on Planet Earth on Friday, net of any changes in COMEX, GLD & SLV inventories, there was a net 63,437 troy ounces of gold added -- and a net 97,882 troy ounces of silver was added as well.
There was a tiny sales report from the U.S. Mint yesterday, they sold 4,000 troy ounces of those one-ounce 24K gold buffaloes -- and that was all.
Month-to-date the mint has sold 26,000 troy ounces of gold eagles -- 10,500 one-ounce 24K gold buffaloes -- and 849,000 silver eagles.
---
There was some activity in gold over at the COMEX-approved depositories on the U.S. east coast on Thursday. All of the 'in' activity...3,472.308 troy ounces/108 kilobars...ended up at Manfra, Tordella & Brookes, Inc. All of the 'out' activity...68,160.120 troy ounces/2,120 kilobars [SGE kilobar weight] was at Brink's, Inc. There was no paper activity. The link to this is here.
There was fairly decent activity in silver. Although nothing was reported received, there was 1,424,583 troy ounces shipped out.
In the 'out' category, almost all of it...1,335,601 troy ounces...departed Manfra, Tordella & Brookes, Inc. The remaining 88,982 troy ounces was shipped out of Brink's, Inc.
There was a fairly large amount of paper activity, as 557,574 troy ounces was transferred from the Eligible category and into Registered over at Loomis International -- and one would suspect that this is going out for delivery sometime this month. The remaining 1,636,927 troy ounces was transferred in the other direction, from Registered and back into Eligible -- and that happened over at Manfra, Tordella & Brookes, Inc. The link to all this silver activity is here.
There was fairly decent activity over at the COMEX-approved gold kilobar depositories in Hong Kong on their Thursday. They reported receiving 2,145 of them -- and shipped out only 218. Except for the 85 kilobars that were dropped off at Loomis International, the remaining in/out activity was at Brink's, Inc. as always. The link to that, in troy ounces, is here.
---
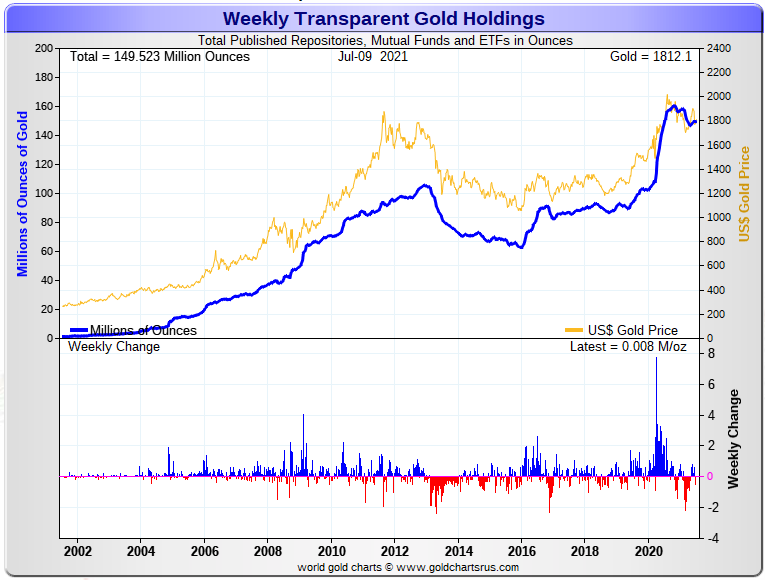
Here are the usual two 20-year charts that show up in this space almost every Saturday. They show the total amount of physical gold and silver in all know depositories, ETFs and mutual funds as of the close of business on Friday. For the week just past, there was only a net 8,000 troy ounces of gold added -- and in silver, there was a net 2,205,000 troy ounces added as well.
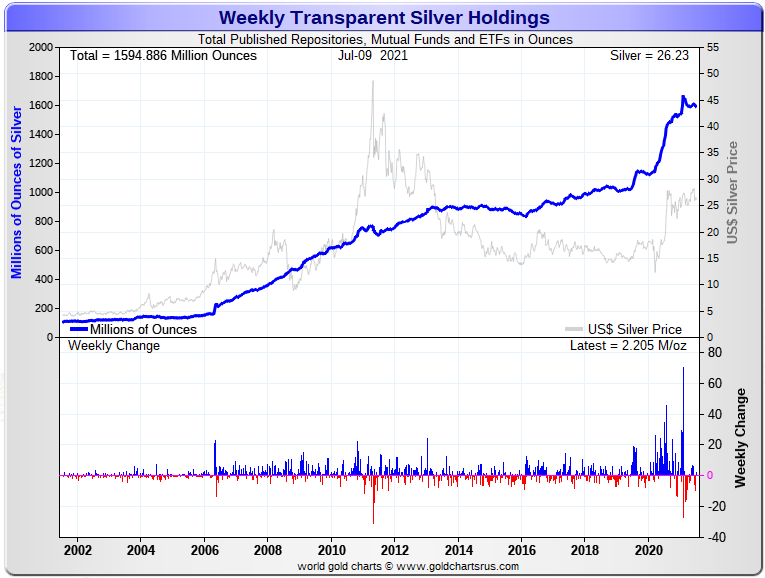
Just looking at the last four weeks worth of flows into and out of all the silver ETFs, mutual funds and depositories over the last four weeks from Nick's website...26.2 million net ounce have been withdrawn from the COMEX and SLV combined...but a net 9.4 million troy ounces of silver have been added into the other world's depositories. I have a chart, plus much more to say about this in The Wrap.
And it should be pointed out here that a decent amount of what was supposedly withdrawn from SLV, was in actual fact a conversion of shares for physical metal, so they're not really withdrawals at all.
---
The Commitment of Traders Report for positions held at the close of COMEX trading on Tuesday showed the expected increases in the commercial net short positions in both gold and silver, but they were far worse than either Ted or I were expecting.
In silver, the Commercial net short position increased by a chunky 5,989 COMEX contracts, or 29.9 million troy ounces.
They arrived at that number by decreasing their long position by 4,359 contracts -- and also added another 1,630 short contracts. It's the sum of those two numbers that represents their change for the reporting week.
Under the hood in the Disaggregated COT Report, all three categories were buyers, as the Managed Money traders increased their net long position by 2,145 contracts...the Other Reportables by 866 contracts -- and the Nonreportable/small traders by 2,978 contracts.
Doing the math: 2,145 plus 866 plus 2,978 equals 5,989 COMEX contracts, the change in the Commercial net short position.
The Commercial net short position in silver now stands at 315.5 million troy ounces, up from the 285.5 million troy ounces they were short in last week's COT Report.
The Big 8 traders are short 341.1 million troy ounces of silver in this week's COT Report, compared to the 330.7 million troy ounces they were short in last week's report.
The difference between those two numbers is 10.4 million troy ounces. But the increase in the Commercial net short position was 29.9 million troy ounces...so the difference...19.5 million troy ounces...had to come from the small commercial traders other than the Big 8...Ted's raptors...and it did, as they sold that amount during the reporting week...for a very decent profit.
Their selling of long positions has the mathematical effect of increasing the net short position -- and if you have trouble grasping that, don't feel badly, as it took awhile for Ted to pound it into me. That's why he's the master -- and I'll always be the pupil. I'll have the details on this in the 'Days to Cover' commentary further down.
The short position of the Big traders is larger than the Commercial net short position by about 108 percent, down from about 116 percent they were short in last week's COT Report -- and that's because of all the long contracts that Ted's raptor sold, as they're in the Commercial category as well, despite the fact that they're small.
Here's the 3-year COT chart for silver, courtesy of Nick Laird as always -- and the change should be noted.
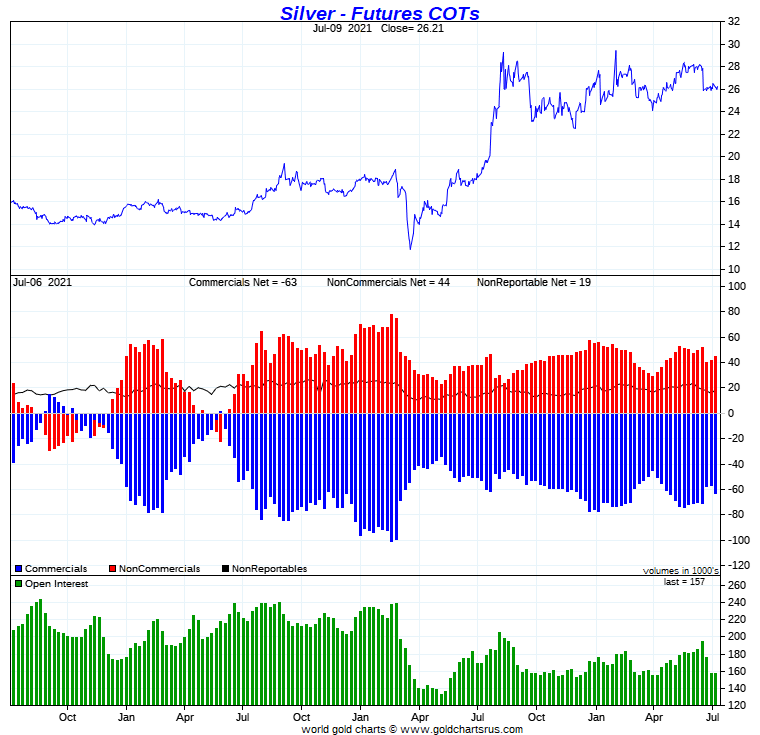
In just once glance at the Disaggregated COT Report yesterday afternoon, it was easy to see that with all the non-commercial and small traders going net long across the board during the reporting week, the Big 4 shorts had to step in, or the price of silver would have exploded.
But one thing I didn't mention further up is the fact that Ted says the Big 4 short increased their short position by around 4,000 contracts, while the Big '5 through 8' traders actually decreased their net short position by about 2,000 contracts. I'm including this information here now, because I'd written "all of the above" long before I talked to Ted -- and I was no mood to rewrite it.
You can't pin any blame on the small commercial traders this week, as they were just selling for profit purposes. But as Ted has pointed out recently, they're just as crooked and collusive as are the Big 8 shorts when it's in their best financial interests to do so.
---
In gold, the commercial net short position increased by an eye-watering 19,606 COMEX contracts...1.96 million troy ounces...and did so for the same reason as it happened in silver.
They arrived at that number by increasing their long position by 277 contracts, but also increased their short position by 19,883 contracts -- and it's the difference between those two numbers that represents their change for the reporting week.
Under the hood in the Disaggregated COT Report, all the big buying was done by the Managed Money and Other Reportables...as the former increased their net long position by 16,578 contracts -- and the latter by 4,017 contracts. The Nonreportable/small traders went in the other direction by reducing their net long position by a smallish 989 contracts.
Doing the math: 16,578 plus 4,017 minus 989 equals 19,606 COMEX contracts, the change in the commercial net short position, which it must do.
The commercial net short position in gold now sits at 21.47 million troy ounces, up from the 19.51 million troy ounces they were short in last week's COT Report.
The Big 8 are short 21.15 million troy ounces of gold in this week's COT Report, compared to 20.54 million troy ounces they were short in last week's report...so they increased their short position by 610,000 troy ounces/6,100 COMEX contracts.
But the commercial net short position increased by 19,606 COMEX contracts so, like in silver, it was Ted's raptors, the small commercial traders other than the Big 8 that were the biggest sellers...as they sold the difference, around 13,100 contracts worth...also for a decent profit.
And also like in silver, their long selling has the mathematical affect of increasing the commercial net short position.
The Big 8 traders are short just under 99 percent of the commercial net short position in gold, down from the 105 percent that they were short in last week's COT Report -- and that's entirely because of the long selling that the small commercial traders did during the reporting week.
So, for all intents and purposes, the Big 8 are short the entire amount of the commercial net short position in gold.
Here's Nick Laird's 3-year COT chart for gold, updated with Friday's data -- and the weekly change is worth noting.
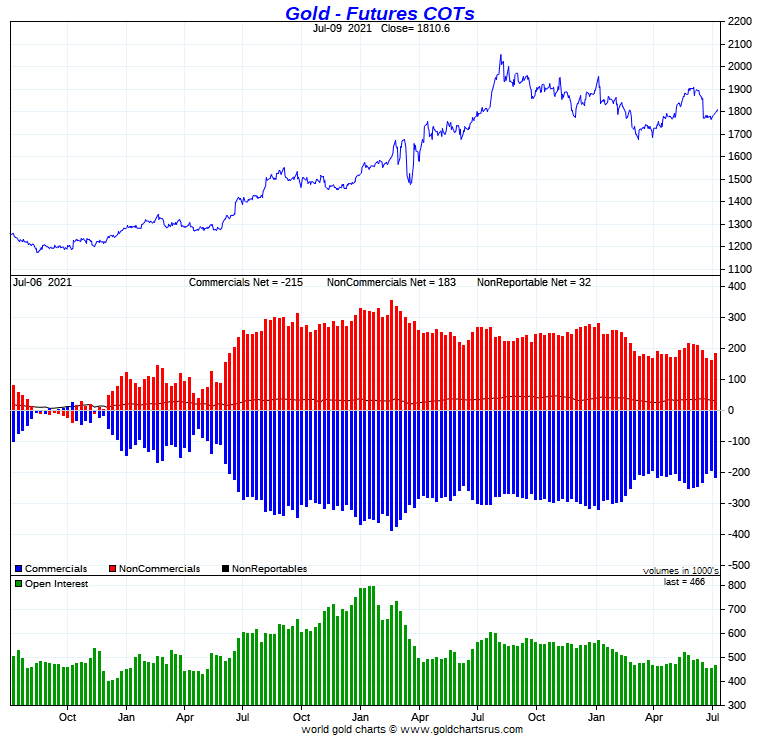
Ted mentioned on the phone that the Big 4 traders increased their net short position by about 4,700 contracts during the reporting week. So, like in silver, it was the long selling by the smaller commercial traders that made up the bulk of the increase in the commercial net short position.
As Ted pointed out in his mid-week commentary on Wednesday..."Increases of commercial selling in both gold and silver shouldn’t radically alter the market structures in each and, of course, what the big 4 did in silver will be my primary concern."
So yes, the headline numbers sucked...but that was mostly because of raptors selling longs. The Big 4, as Ted feared, did increase their short positions, but as Ted just said...it "shouldn’t radically alter the market structures in each" -- and it doesn't.
But, having said all that -- and even with a continuing very bullish COT structure in both, this past week's price action has all the hallmarks of the "same old, same old" of the past many decades to me. The precious metals are going nowhere until the Big 2/4 traders allow it.
I look forward to what Ted has to say about all of this in his weekly review to his paying subscribers this afternoon.
---
In the other metals, the Managed Money traders in palladium [not surprisingly] increased their net long position by a further 833 COMEX contracts during the last reporting week -- and are net long the palladium market by 3,567 COMEX contracts...around 35 percent of the total open interest...up about 5 percentage points from last week's report. In platinum, the Managed Money traders decreased their net long position by 1,607 contracts -- and are net long the platinum market by 3,050 COMEX contracts...about 6 percent of total open interest -- down about 2 percentage points from last week's COT Report. In copper, the Managed Money traders increased their net long position by a further 4,917 COMEX contracts -- and are now net long copper to the tune of 30,923 COMEX contracts...about 773 million pounds of the stuff -- and about 15 percent of total open interest...up about 2 percentage points from last week.
---
Here’s Nick Laird’s “Days to Cover” chart, updated with the COT data for positions held at the close of COMEX trading on Tuesday, July 6. It shows the days of world production that it would take to cover the short positions of the Big 4 — and Big '5 through 8' traders in each physically traded commodity on the COMEX.
I consider this to be the most important chart that shows up in the COT series -- and it deserves a minute of your time.
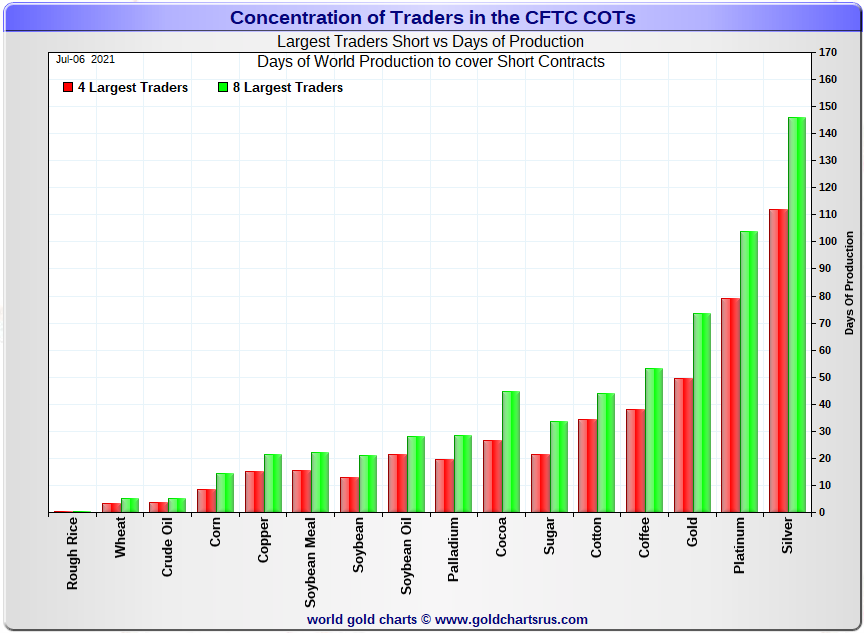
In it, the Big 4 traders are short about 112 days of world silver production, up about 8 days from the prior week's report. The ‘5 through 8’ large traders are short an additional 34 days of world silver production...down about 4 days from the prior COT Report for a total of about 146 days that the Big 8 are short...up about 4 days from last week's COT report. [In the prior reporting period they were short 142 days of world silver production.]
As Ted mentioned on the phone yesterday, the Big 4 added to their short position during the reporting week -- and the Big '5 through 8' traders decreased their short position during the same period -- and that's very apparent in the numbers above.
That 146 days that the Big 8 are short, represents just about 5 months of world silver production, or 341.1 million troy ounces of paper silver held short by the Big 8.
In the COT Report above, the Commercial net short position in silver was reported by the CME Group at 315.5 million troy ounces. As mentioned in the previous paragraph, the short position of the Big 4/8 traders is 341.1 million troy ounces. So the short position of the Big 4/8 traders is larger than the total Commercial net short position by 341.1-315.5=25.6 million troy ounces...down 20 million troy ounces/4,000 COMEX contracts from last week's report.
It was this selling that had the mechanical effect of increasing the Commercial net short position.
The reason for the difference in those numbers two paragraphs ago...as it always is...is that Ted's raptors, the 26-odd small commercial traders other than the Big 8, are net long that amount...25.6 million troy ounces.
Another way of stating this [as I say every week in this spot] is that if you remove the Big 8 shorts from the commercial category, the remaining traders in the commercial category are net long the COMEX silver market. It's the Big 8 against everyone else...a situation that has existed for almost five decades in silver, platinum and palladium -- and for almost the last three weeks, in gold as well!
As per the first paragraph above, the Big 4 traders in silver are short around 112 days of world silver production in total. That's about 28 days of world silver production each, on average...up two full days from last week's COT Report. The four big traders in the '5 through 8' category are short 34 days of world silver production in total, which is about 8.5 days of world silver production each, on average...down one full day from last week's COT Report.
The Big 8 commercial traders are short 43.4 percent of the entire open interest in silver in the COMEX futures market, which is up a bit from the 42.1 percent they were short in the prior week's COT report. And once whatever market-neutral spread trades are subtracted out, that percentage would be 50 percent, for all intents and purposes. In gold, it's 45.4 percent of the total COMEX open interest that the Big 8 are short, which is basically unchanged from the 45.3 percent they were short in Monday's COT Report -- and a bit over the 50 percent mark once their market-neutral spread trades are subtracted out.
In gold, the Big 4 are short 49 days of world gold production, up about 1 day from last week's COT Report. The '5 through 8' are short 24 days of world production -- also up 1 day from last week's report...for a total of 73 days of world gold production held short by the Big 8 -- and obviously up 2 days from the prior COT Report. Based on these numbers, the Big 4 in gold hold about 67 percent of the total short position held by the Big 8...down about 1 day from the prior week's COT Report.
The "concentrated short position within a concentrated short position" in silver, platinum and palladium held by the Big 4 commercial traders are about 77, 76 and 71 percent respectively of the short positions held by the Big 8...the red and green bars on the above chart. Silver [not surprisingly] is up about 4 percentage points from last week's COT Report...platinum is unchanged from a week ago -- and palladium is up about 6 percentage points week-over-week.
But in actual fact, very little has changed, as the Big 8 shorts are still hugely short in all four precious metals in the COMEX futures market. But it's now mostly the Big 4...or probably just the Big 2 or 3...Citigroup, Bank America and HSBC -- and the above chart tells you all you need to know about their current plight.
They're stuck on the short side -- and that's for the very simple reason that the Managed Money traders are no longer willing to go mega short like they used to in the past. Because of that, the Big 4/8 traders can't cover.
There's only two ways out for them...deliver physical metal into their short positions, or buy longs and cover that way...driving its price to the moon in the process. And as I've stated before, a far out in left field option would be to close the COMEX for futures trading in the four precious metals and let them trade in the spot market.
The situation regarding the Big 4/8 shorts continues to be beyond obscene, twisted and grotesque...especially the Big 2/4 -- and as Ted correctly points out, its resolution will be the sole determinant of precious metal prices going forward.
---
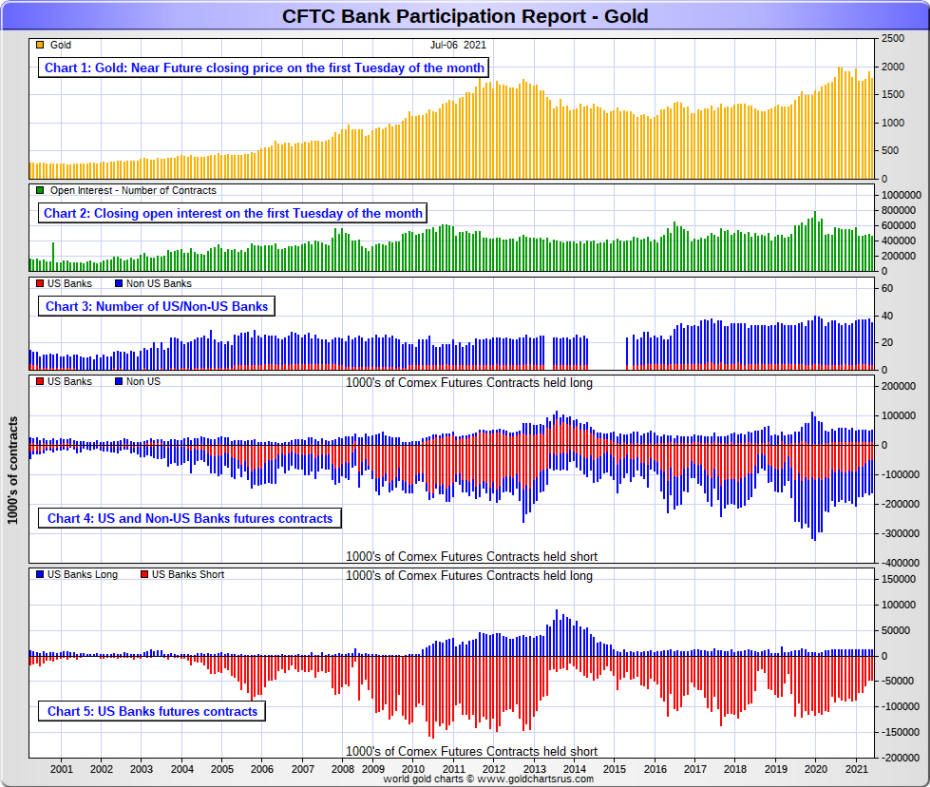
The July Bank Participation Report [BPR] data is extracted directly from yesterday's Commitment of Traders Report. It shows the number of futures contracts, both long and short, that are held by all the U.S. and non-U.S. banks as of Tuesday’s cut-off in all COMEX-traded products. For this one day a month we get to see what the world’s banks are up to in the precious metals —and they’re usually up to quite a bit.
[The July Bank Participation Report covers the time period from June 2 to July 6 inclusive.]
In gold, 4 U.S. banks are net short 34,827 COMEX contracts in the July BPR. In June’s Bank Participation Report [BPR] these same 4 U.S. banks were net short 34,543 contracts, so there was no change worthy of the name from four weeks ago.
Citigroup, HSBC USA, Bank of America and Morgan Stanley would most likely be the U.S. banks that are short this amount of gold. I still have some suspicions about the Exchange Stabilization Fund as well, although if they're involved, they are most likely just backstopping these banks.
Also in gold, 31 non-U.S. banks are net short 73,394 COMEX gold contracts. In June's BPR, 34 non-U.S. banks were net short 82,159 COMEX contracts...so the month-over-month change shows a decrease of 8,765 COMEX contracts.
At the low back in the August 2018 BPR...these same non-U.S. banks held a net short position in gold of only 1,960 contacts -- and they've been back on the short side in an enormous way ever since.
I suspect that there's at least two large non-U.S. bank in this group, one of which would be Scotiabank/Scotia Capital...plus HSBC most likely. And I have my suspicions about Barclays, Dutch Bank ABN Amro, French bank BNP Paribas, plus Australia's Macquarie Futures as well. Other than that small handful, the short positions in gold held by the vast majority of non-U.S. banks are mostly immaterial and, like in silver, have always been so.
As of this Bank Participation Report, 35 banks [both U.S. and foreign] are net short 23.2 percent of the entire open interest in gold in the COMEX futures market, which is down a tiny bit from the 23.9 percent that 39 banks were net short in the June's BPR.
Here’s Nick’s BPR chart for gold going back to 2000. Charts #4 and #5 are the key ones here. Note the blow-out in the short positions of the non-U.S. banks [the blue bars in chart #4] when Scotiabank’s COMEX short position was outed by the CFTC in October of 2012.
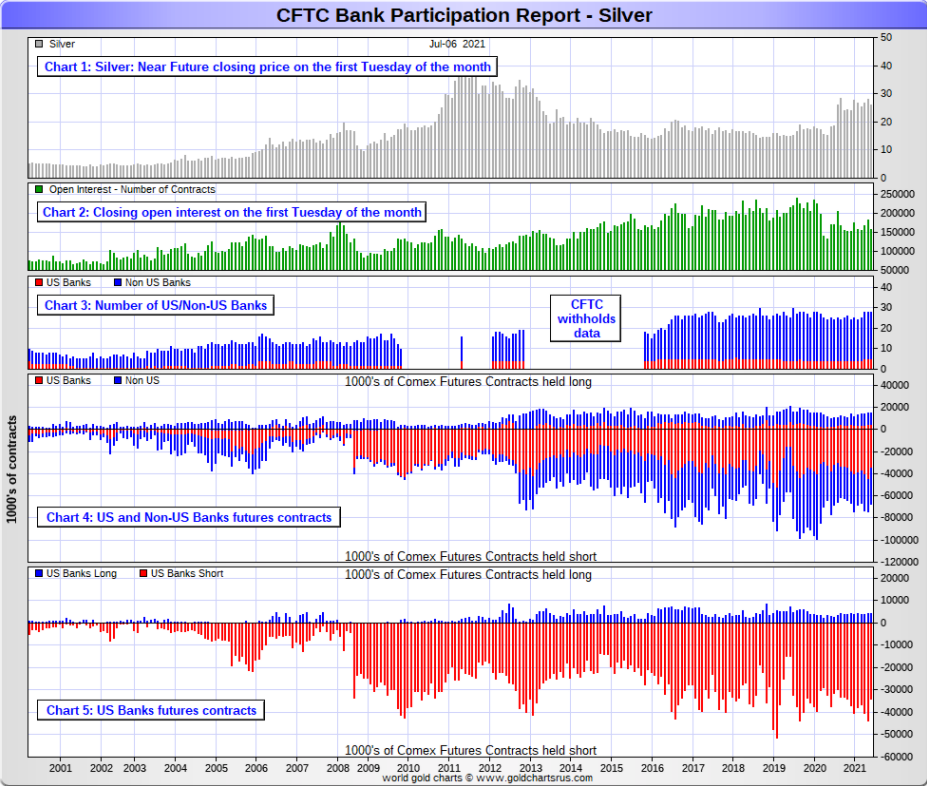
In silver, 5 U.S. banks are net short 29,703 COMEX contracts in July's BPR. In June's BPR, the net short position of 4 U.S. banks was 39,562 contracts, so the short position of the U.S. banks decreased by 9,859 contracts month-over-month.
As in gold, the four biggest short holders in silver of the five U.S. banks in total, would be Citigroup, HSBC USA -- and Bank of America, Morgan Stanley and one other...and NOT Goldman Sachs. And, like in gold, I'm starting to have my suspicions about the Exchange Stabilization Fund's role in all this...although, like in gold, not directly.
Also in silver, 23 non-U.S. banks are net short 23,152 COMEX contracts in the July BPR...which is up from the 19,308 contracts that these same non-U.S. banks were short in the June's BPR.
I would suspect that Canada's Scotiabank/Scotia Capital still holds a goodly chunk of the short position of these non-U.S. banks...plus HSBC and Barclays. I also suspect that a number of the remaining non-U.S. banks may actually be net long the COMEX futures market in silver. But even if they aren’t, the remaining short positions divided up between these other 20 non-U.S. banks are immaterial — and have always been so.
As of July's Bank Participation Report, 28 banks [both U.S. and foreign] are net short 33.6 percent of the entire open interest in the COMEX futures market in silver—up a bit from the 32.3 percent that these same 28 banks were net short in the June BPR. And much, much more than the lion’s share of that is held by Citigroup, HSBC, Bank of America, Barclays -- and Scotiabank -- and possibly one other non-U.S. bank...all of which are card-carrying members of the Big 8 shorts.
I'll point out here that Goldman Sachs has no derivatives in the COMEX futures market in any of the four precious metals.
Here’s the BPR chart for silver. Note in Chart #4 the blow-out in the non-U.S. bank short position [blue bars] in October of 2012 when Scotiabank was brought in from the cold. Also note August 2008 when JPMorgan took over the silver short position of Bear Stearns—the red bars. It’s very noticeable in Chart #4—and really stands out like the proverbial sore thumb it is in chart #5. But as of March of 2020...they're out of their short positions, not only in silver, but the other three precious metals as well.
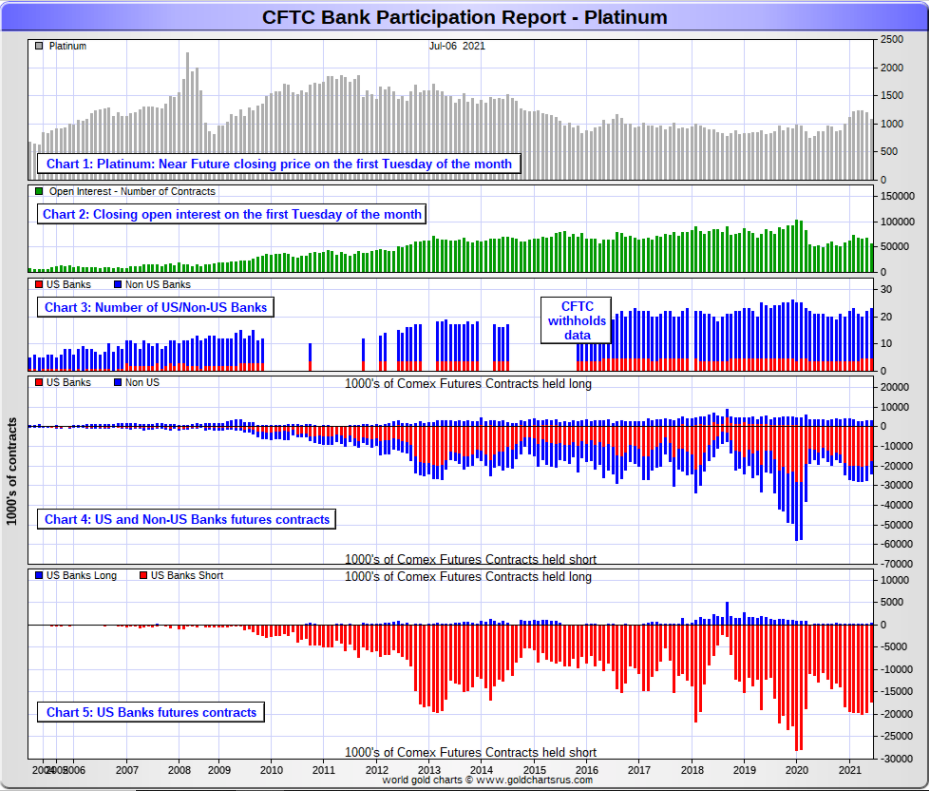
In platinum, 5 U.S. banks are net short 16,715 COMEX contracts in the July Bank Participation Report, which is down 2,590 contracts from the 19,305 COMEX contracts that these same 5 U.S. banks were short in the June BPR. This is the seventh month in a row that there has been virtually no change or a decrease in the short position held by the U.S. banks in platinum.
[At the 'low' back in July of 2018, these U.S. banks were actually net long the platinum market by 2,573 contracts] So they have a loooong way to get to even getting back to market neutral.
Also in platinum, 18 non-U.S. banks are net short 4,184 COMEX contracts in the July BPR, which is down 1,081 contracts from the 5,265 COMEX contracts that 17 non-U.S. banks were net short in the June BPR.
[Note: Back at the July 2018 low, these same non-U.S. banks were net short only 1,192 COMEX contracts.]
And as of July's Bank Participation Report, 23 banks [both U.S. and foreign] are net short 37.7 percent of platinum's total open interest in the COMEX futures market, which is up a bit from the 36.4 percent that 22 banks were net short in June's BPR.
But it's the U.S. banks that are on the short hook big time -- and the real price managers. They have little chance of delivering into their short positions, although a very large number of platinum contracts have already been delivered during the last eight months or so...including this month. But that fact, like in both silver and gold, has made no difference whatsoever to their short positions held. Their short positions in the COMEX futures market in this precious metal is equally as dire as it is in the other two precious metals.
The reason that they'll never improve their short positions in a big way is the same reason as in gold and silver...the Managed Money traders flatly refuse to go short big time like they used to in the past.
Here's the Bank Participation Report chart for platinum.
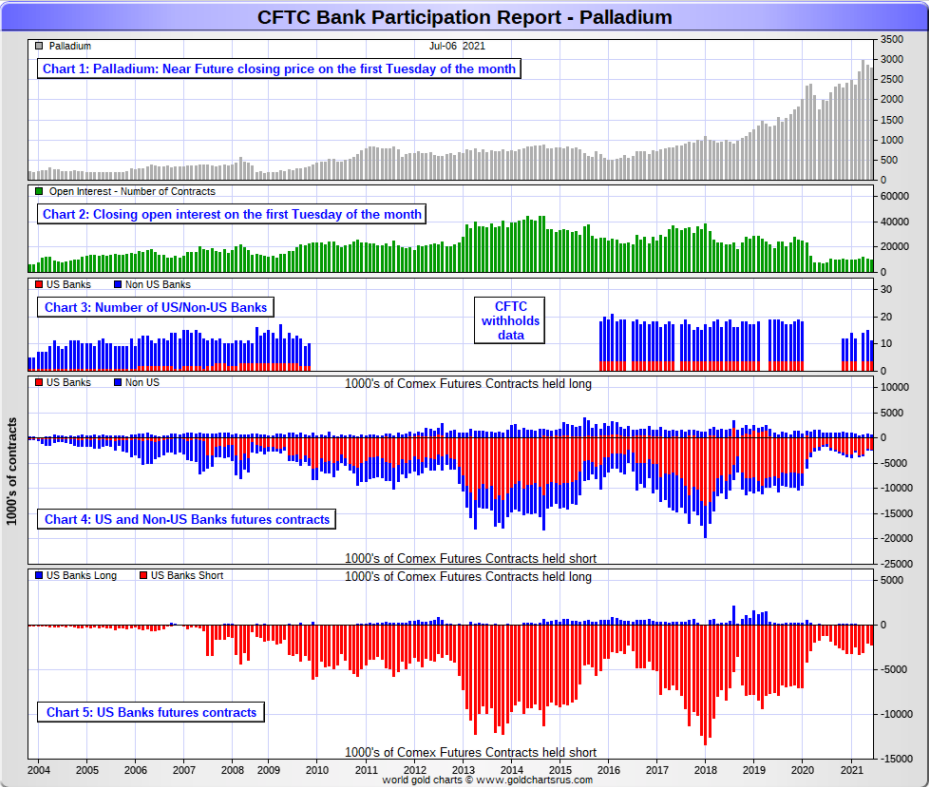
In palladium, 4 U.S. banks are net short 2,223 COMEX contracts in the July BPR, which is up from the 2,026 contracts that these same 4 U.S. banks were net short in the June BPR. And I will point out here that these U.S. banks hold zero long contracts in palladium, compared to the 2,223 contracts that they hold on the short side. These short contracts exist solely for price management purposes.
They were short only 1,194 COMEX contract in the July 2020 BPR.
Also in palladium, 7 non-U.S. banks are net long 314 COMEX palladium contracts—up from the 225 contracts that 11 non-U.S. banks were net long in the June BPR. These non-U.S. banks have been net long by a bit in palladium for the last sixteen months in a row.
And as I've been commenting for almost forever now, the COMEX futures market in palladium is a market in name only, because it's so illiquid and thinly-traded. Its total open interest at Tuesday's cut-off was only 10,114 contracts...compared to 55,441 contracts of total open interest in platinum...157,216 in silver -- and 465,811 COMEX contracts in gold.
As of this Bank Participation Report, 11 banks [both U.S. and foreign] are net short 18.8 percent of the entire COMEX open interest in palladium...up a bit from the 17.0 percent of total open interest that 15 banks were net short in June's BPR.
And because of the small numbers of contracts involved, along with a tiny open interest, these numbers are pretty much meaningless. So, for the last eighteen months in a row, the world's banks are no longer involved in the palladium market in a material way. According to Ted, palladium is mostly a cash market now.
Here’s the palladium BPR chart. And as I point out every month, you should note that the U.S. banks were almost nowhere to be seen in the COMEX futures market in this precious metal until the middle of 2007—and they became the predominant and controlling factor by the end of Q1 of 2013. They have imploded into insignificance over the last eighteen or so Bank Participation Reports -- and it remains to be seen if they return as big short sellers again at some point like they've done in the past.
Except for palladium, only a small handful of the world's banks/investment houses, most likely four or so in total -- and mostly U.S-based...continue to have meaningful short positions in the other three precious metals. It's a near certainty that they run this price management scheme from within their own in-house/proprietary trading desks...although its probable that their clients are short these metals as well.
The futures positions in silver and gold that JPMorgan holds are immaterial -- and have been since March of last year. According to Ted, they're long a bit in gold -- and market neutral in silver. It's the next Big 8 shorts et al. that are on the hook in everything precious metals-related...but as I just mentioned, it's most likely only the Big 4, or maybe the Big 2 now...as the concentration data is so stark...as per the above 'Days to Cover' chart.
But as has been the case for over a year now, the short positions held by the Big 4/8 traders/banks is the only thing that matters -- and how it is ultimately resolved [as Ted said earlier] will be the sole determinant of precious metal prices going forward.
But, as has always been the case, the Big 4 shorts have an iron grip on precious metal prices. That will continue until they voluntarily give it up, as there's between Slim and no chance that they will get overrun -- and Slim is out of town.
Subscribe to Ed Steer's Gold & Silver Digest
*********
More from Gold-Eagle


