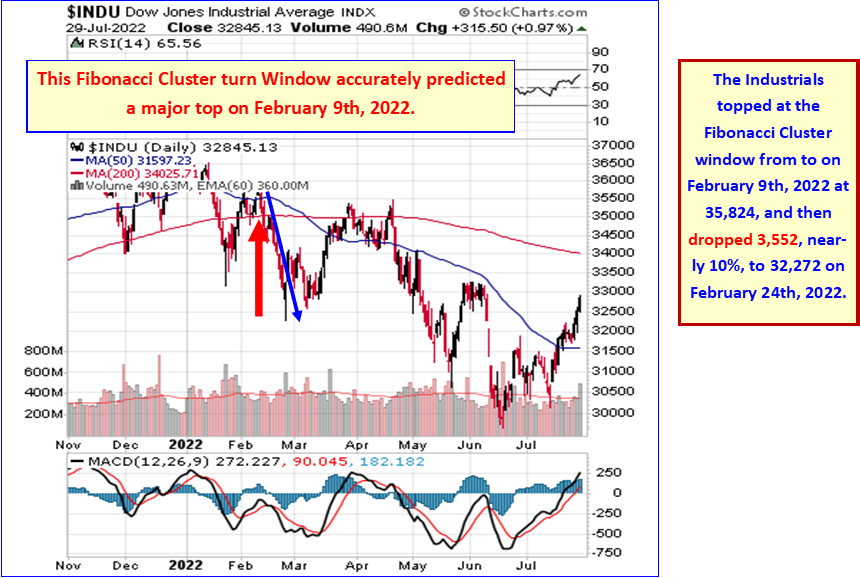
The Stock Market Is About To Top And Drop


The Bear Market is not over. In this article we will first take a look at the big picture, then focus on the recent rally, when and where it is likely to top, and the nature of the next decline, which we believe will be significant.
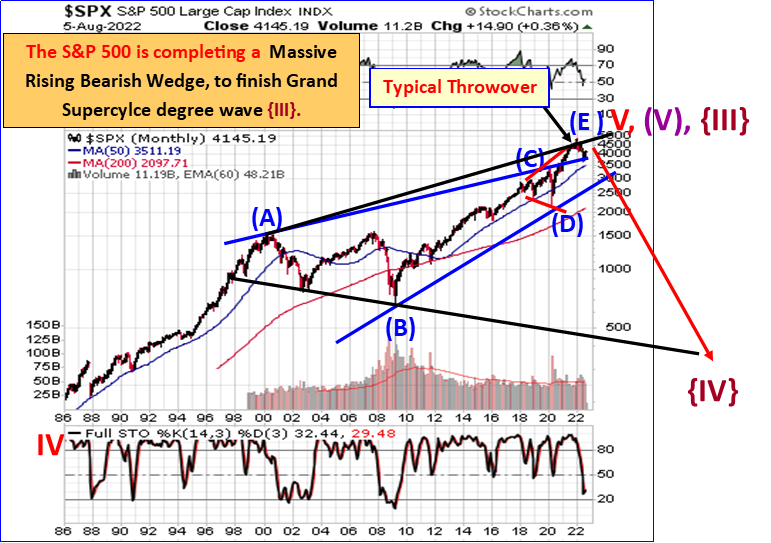
The S&P 500 is stair stepping lower in a series of declines and partial corrective rallies from their January 4th, 2022 top. Each rebound rally has topped below prior rally high, and each decline has bottomed below the prior low. That January 2022 top was the conclusion of two major long-term Bearish patterns. Above we show the S&P 500 has completed a Long-Term Rising Bearish Wedge from 1986, overlapped contemporaneously by a Jaws of Death pattern from 1986. This is the start of Grand Supercycle degree wave {IV} down, correcting centuries of Grand Supercycle degree wave {III} up. The downside price target is substantially below current levels. I presented this pattern’s warning, evident several years ago, in my book, The Coming Economic Ice Age. That is here now and in its early stages.
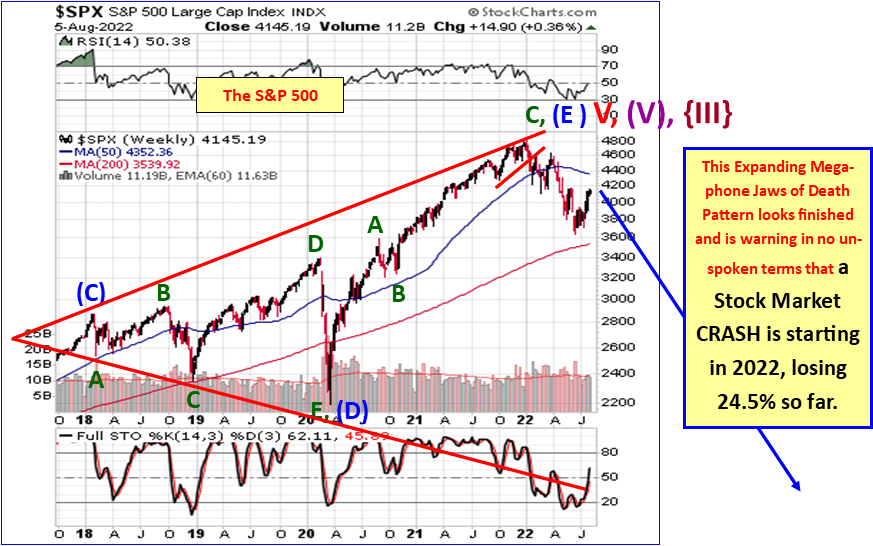
This next chart shows the price path for the S&P 500 since 2017, showing that a large Megaphone topping pattern came as part of, and at, the conclusion of the above mega-pattern, on January 4th, 2022, the start of the 2022 stock market crash.
So where does the S&P 500 sit now? What do we make of the rally from the June 17th lows?
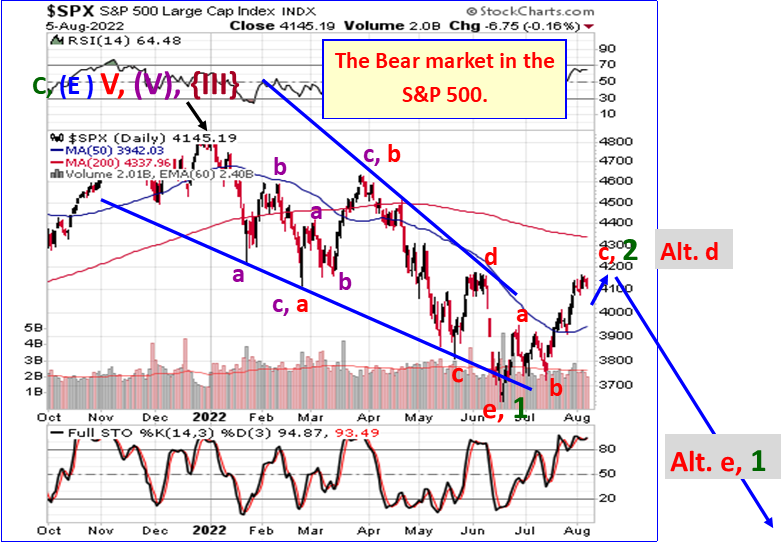
The S&P 500’s 2022 Crash was a Declining Wedge, which bottomed on June 17th, Intermediate degree wave 1-down. From that low through now, the Industrials are rising in a 5-3-5, a-up, b-down, c-up Zigzag for the corrective Intermediate degree wave 2 rally. They are inside the final Minor degree wave c-up for 2. Once Intermediate degree wave 2 Tops, there is the potential for a Waterfall Decline through the end of 2022. We explain why, below.
A typical topping point for a corrective rally is the preceding wave’s fourth wave, in this case the d-wave within 1-down, shown above. Stocks are close to that level now, perhaps needing a bit more upside to reach it.
There is a pattern, a Rounded Top pattern, appearing now in the Dow Industrials, which is giving a big Red Flag warning about the next phase of the Bear market in stocks, shown in this next chart:
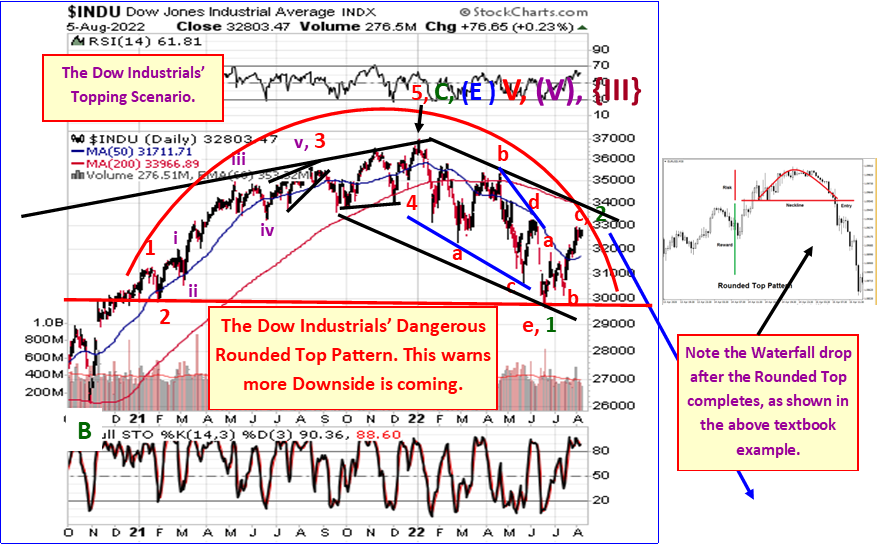
A Bearish Rounded Top pattern has formed from January 2021 through June 2022. This is a serious warning to the stock market that another powerful plunge is likely during the remainder of 2022 — at least. Waterfall declines often follow completion of these patterns, after a perfect horizontal neckline is achieved, which is currently the case.
How do Bear Markets Typically Operate?
Robert Rhea was a legend in Technical Analysis from the 1930’s, one of the major pillars of Dow Theory (along with Charles H. Dow, William P. Hamilton, and Richard Russell in more recent times), and he had a perspective on Bear Markets that likely applies today. He recognized that Bear markets have Three Phases. Here is what he wrote:
“Bear markets seem to be divided into three phases: the first being the abandonment of hopes upon which the uprush of the preceding bull market was predicated; the second being the reflection of the decreased earning power and reduction of dividends; and the third representing distress liquidation of securities which must be sold to meet living expenses. Each of these phases seems to be divided by a secondary reaction which is often erroneously assumed to be the beginning of a bull market.”
So, what about timing for this next phase of the Bear market in Stocks?
Our take is that the rally from June 17th, 2022 is a secondary reaction between the first and second phase of the Bear Market. It has been erroneously assumed by many mainstream and perma-bull pundits that this rally from June is the beginning of a new bull market.
This is not the start of a bull market, rather, has served the purpose of shaking out the shorts and luring back the longs, to the detriment of both as the middle primary phase of the Bear market is about to start, which we have labeled to be a coming Intermediate degree wave 3 down. Wave threes are typically the most dramatic. The Bear does not want shorts to benefit from stock market declines. The Bear wants everyone to lose, both bulls and bears, longs and shorts. The Bear has accomplished this to some degree with this summer rally, which is a set-up for what is coming next.
The first phase, from January 2022 through June 2022 wiped out $12 trillion of wealth from the economy. Since wave 3 is typically the most dramatic, this next leg of the Bear market could wipe out $18 to $24 trillion of wealth. We believe this next phase of the Bear market, is close to starting. The secondary rally from June 17th, 2022 is close to topping.
We track a few cycle turn models that suggest a major trend turn could arrive this coming week +/- a few days. If so, that would likely coincide with the conclusion of the wave 2-up secondary trend rally from June 17th. So, let’s take a look at one of these cycle turn models, which we label a Fibonacci Cluster Turn Window, which is warning of a top within a week.
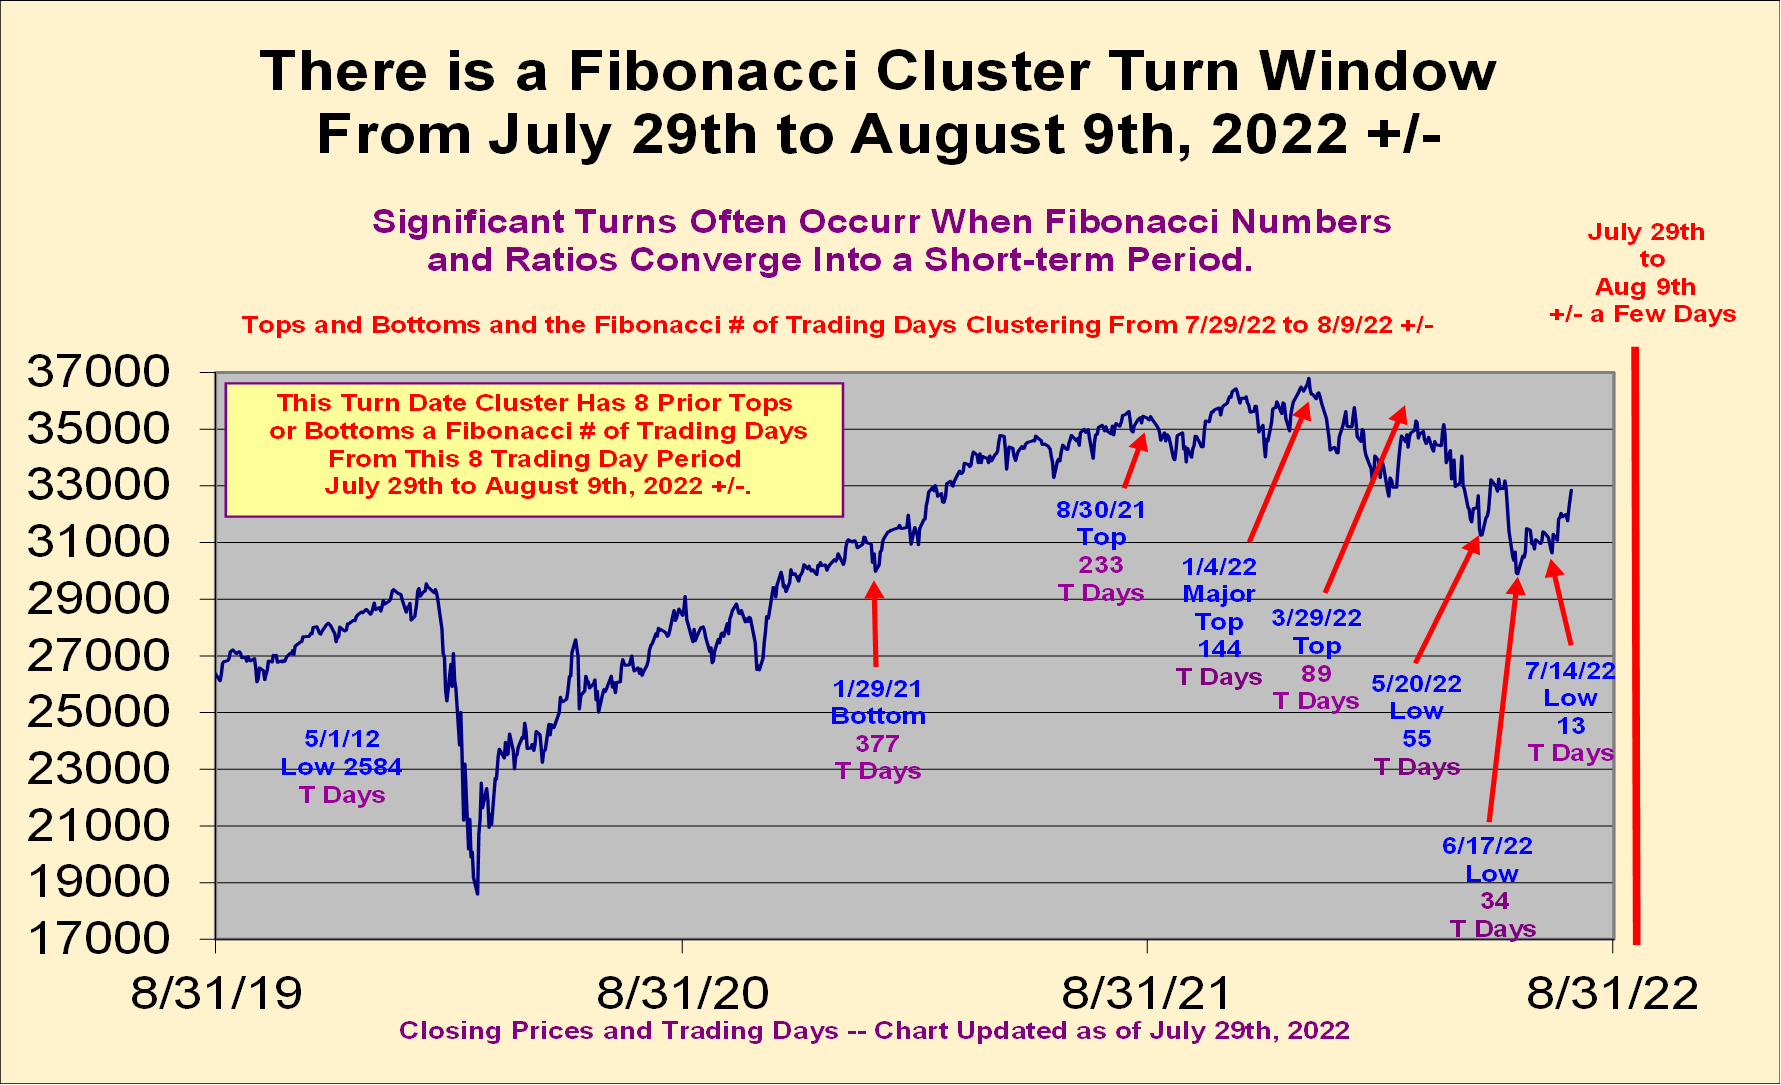
This model says that Stocks are about to top. It will conclude the rally from the June 17th bottom. We have found that when there is a cluster of 5 or more prior tops or bottoms that are a Fibonacci number of trading days from a short period of time, a week or so, there is a high probability of a meaningful trend turn, what we call a Fibonacci Cluster turn window.
There is such a window coming from July 29th through August 9th, 2022, with this one having an exceptionally large cluster of 8 Fibonacci partner turns. Interestingly, there is also a Major Bradley model turn date on August 11th, 2022 +/- a few days. It is likely the above Cluster window is pointing toward the top of corrective wave 2-up from the June 17th bottom. The coming Bradley Model turn date, another cycle model we look at, is likely identifying the same turn. Here are the details of this major Cluster:
** August 3rd is 13 trading days from the July 14th, 2022 Low (also a Bradley turn).
** August 5th is 34 Trading days from the June 17th, 2022 Bottom (also a Bradley turn).
** August 9th is 55 Trading days from the May 20th, 2022 Low (also a Bradley turn).
** August 4th is 89 Trading days from the March 29th, 2022 Large Top (a Bradley turn).
** August 1st is 144 Trading days from the January 4th, 2022 Major Top (Bradley turn).
** August 3rd is 233 Trading days from the August 30th, 2021 Top (also a Phi Mate turn).
** July 29th is 377 Trading days from the January 29th, 2021 Large Bottom.
** August 4th is 2,584 Trading days from the May 1st, 2012 Top (also a Phi mate turn).
This coming stock market turn is likely to be a major turn. A major top concluding the rallies from June 17th and July 14th. The characteristics of this Fibonacci Cluster turn window suggest this. Why?
First off, there are many prior tops or bottoms that are a Fibonacci number of trading days from this coming turn period from July 29th through August 9th, 2022.
Second, the partner tops and bottoms for this cluster are significant turns. Most of the new trends were large, of intermediate or primary degree. That historically tells us that this coming turn will likely be of intermediate of primary degree.
Third, note that 7 of the 8 partner tops and bottoms for this approaching Fibonacci cluster were all predictively identifiable by an independent cycle turn methodology, either Bradley model or Phi mate model turn dates. There was a lot of light on these turns.
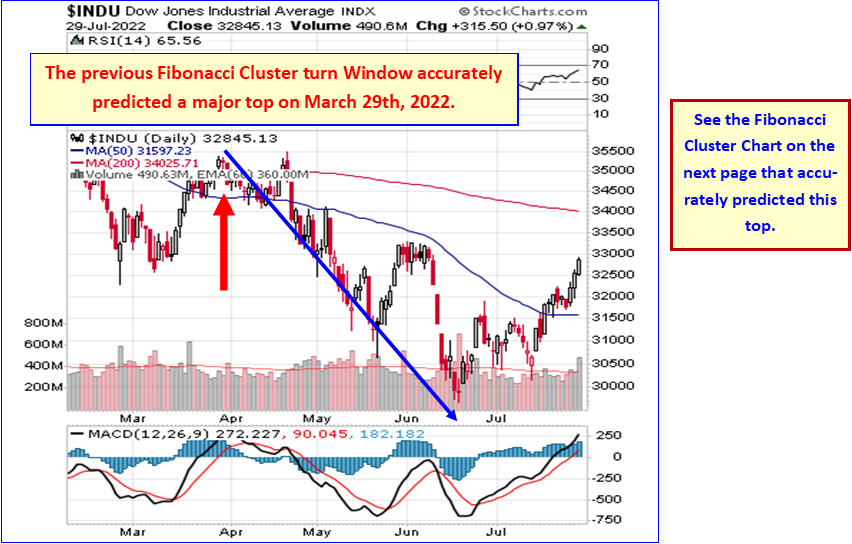
In the above chart we see that the last Fibonacci Cluster turn window identified a significant top that arrived on March 29th, 2022.
Next, we show the two predictive charts we presented to subscribers before the March 29th top arrived, and before the February 9th significant top arrived. In other words, this model proved to be predictive twice, earlier in 2022.
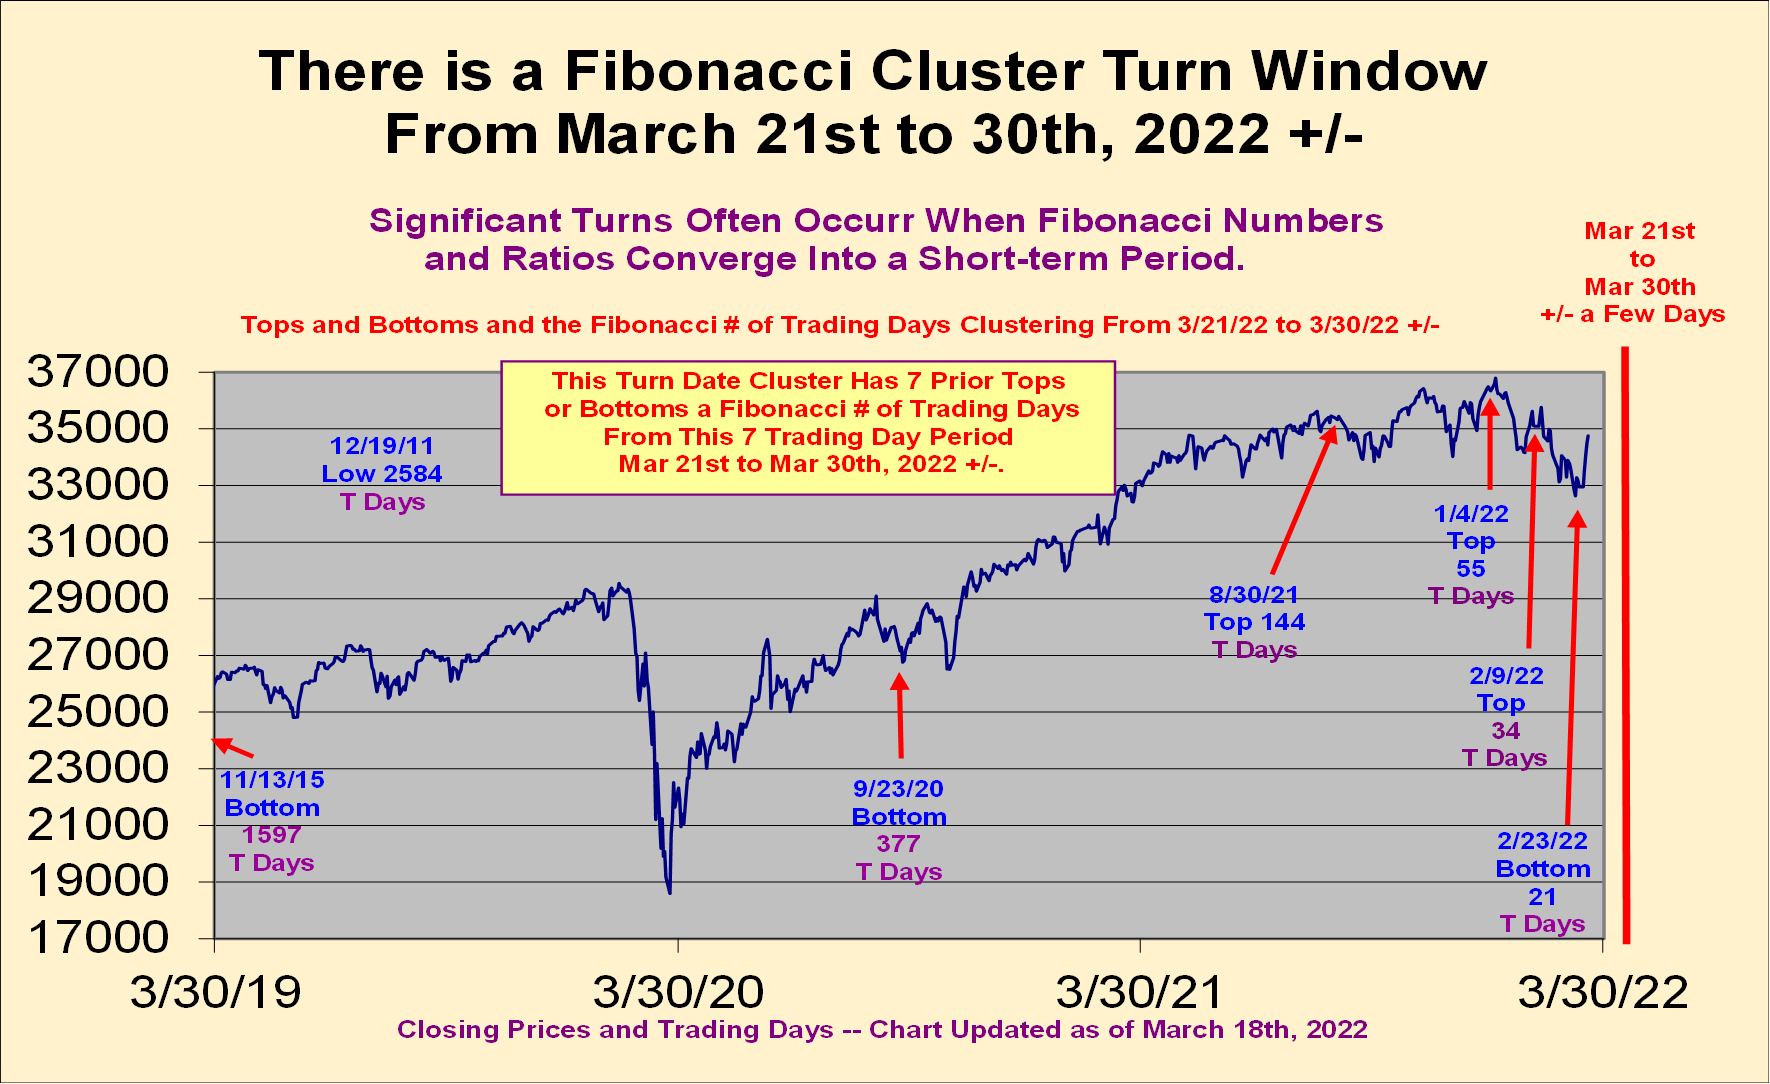
In early March, we presented the following analysis along with the above chart, warning a top was imminent. We wrote:
“We have found that when there is a cluster of 5 or more prior tops or bottoms that are a Fibonacci number of trading days from a short period of time, a week or so, there is a high probability of a trend turn, what we call a Fibonacci Cluster turn window.”
“There is such a window coming from March 21st through March 30th, 2022, with this one having a cluster of 7. Interestingly, there is also a Major Bradley model turn date on March 28th, 2022 +/- a few days, and a Phi Mate turn date scheduled for April 4th. It is likely the above Cluster window is pointing toward the top of the corrective wave up from the February 23rd bottom, along with the approaching Bradley Model and Phi mate turn dates. Here are the details of the Cluster:
** March 21st is 1,597 trading days from the November 13th, 2015 Low.
** March 24th is 377 Trading days from the September 23rd, 2020 Bottom.
** March 24th is 55 Trading days from the January 4th, 2022 Top.
** March 24th is 21 Trading days from the February 23rd, 2022 Closing Bottom.
** March 25th is 2,584 Trading days from the December 19th, 2011 Bottom.
** March 28th is 144 Trading days from the August 30th, 2021 Top.
** March 30th is 34 Trading days from the February 9th, 2022 Top.”
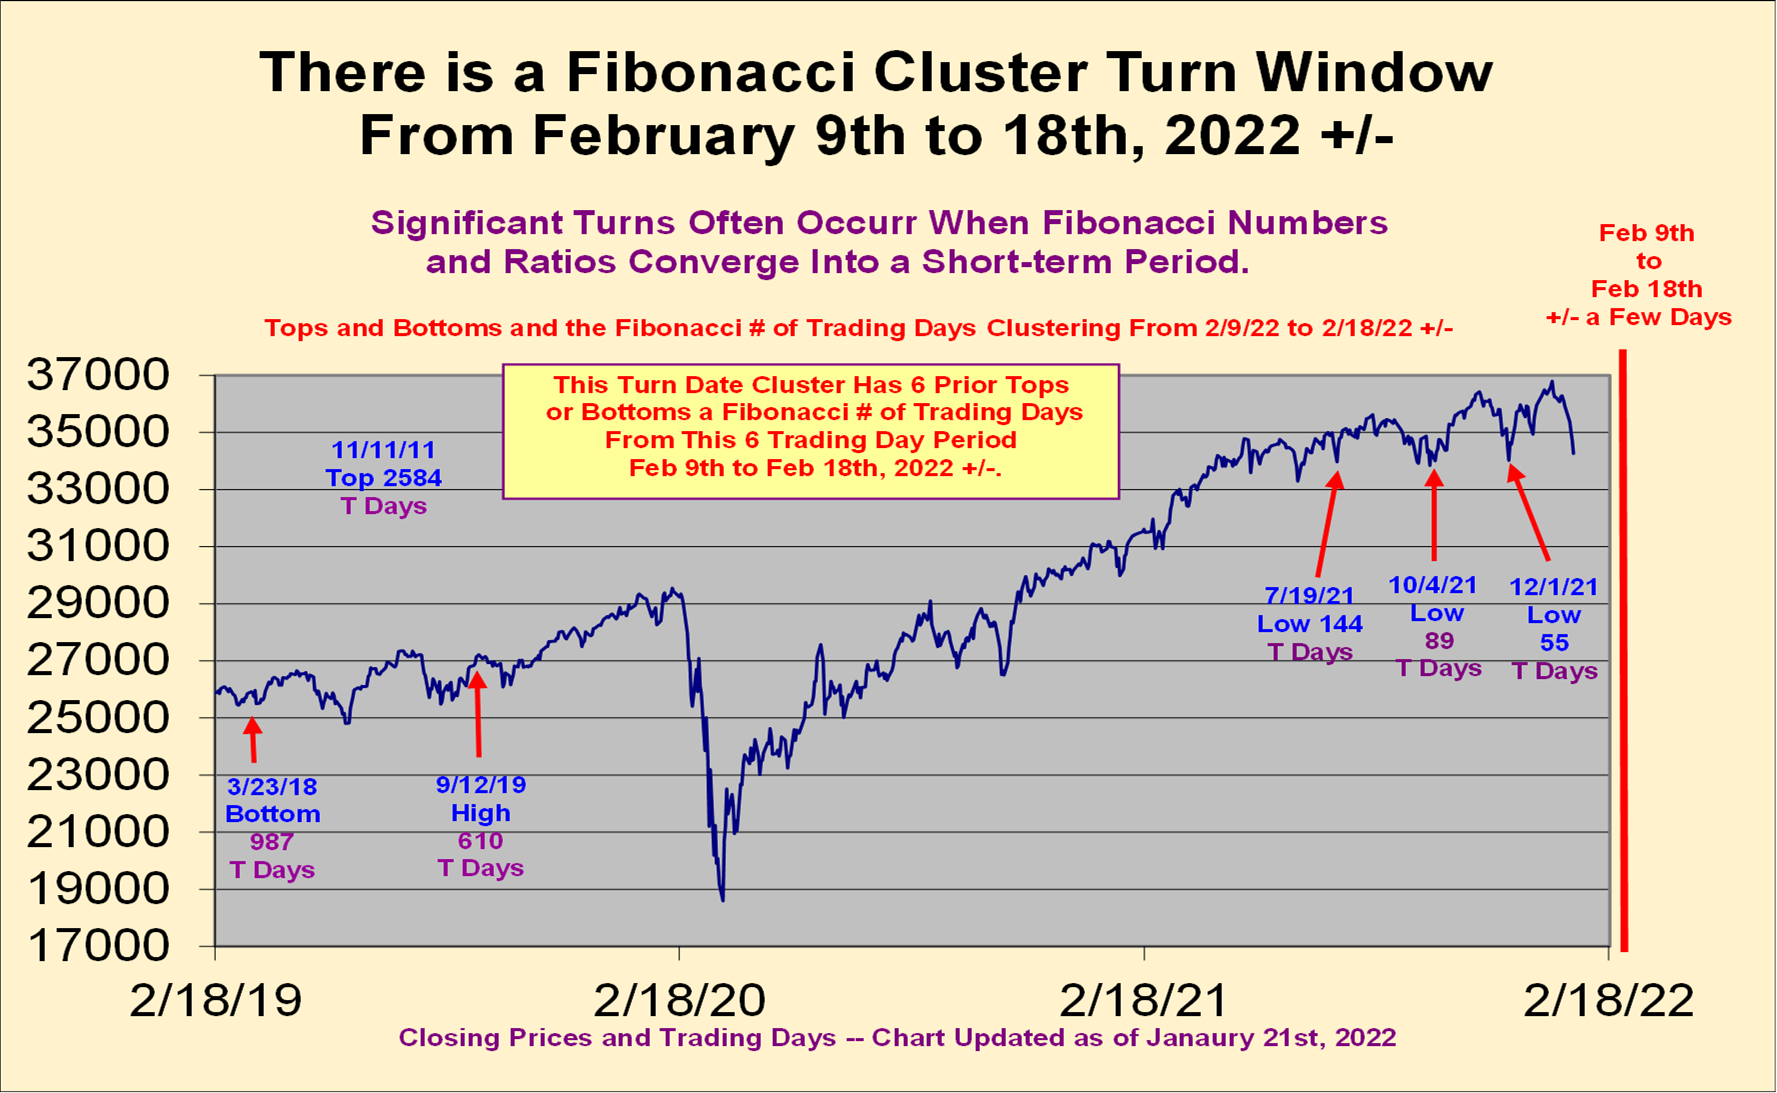
Above, we show this model’s prediction for a February top of significance. Below we show a close-up of the subsequent decline the model accurately predicted, from the February 9th, 2022 top.
There is a lot more evidence for an approaching top, which we show in our newsletter to subscribers at www.technicalindicatorindex.com .
For those unfamiliar with Fibonacci numbers, they are calculated by taking the first number in sequence and adding it to the next number in sequence, to arrive at the next number and so on. They are 1, 1, 2, 3, 5, 8, 13, 21, 34, 55, 89, 144, 233, 377, 610, 987, 1,597, 2,584, etc… Each number divided by its next adjacent number equals Phi, 0.618, a unique ratio found throughout the world we live in, evident in art, architecture, science, the human body, as well as many other places. It also seems to relate to the human behavior psyche at a particular period of time, that affects stock market movements.
There are ways to save money, and even make money as the stock market declines. There are strategies that run the gamut from moving to cash, to dollar cost average purchasing into the decline (although, that can be like trying to catch a falling knife if the decline is deep and persistent). Other strategies include investing in inverse ETF or ETNs, or Put Options on the major stock indices. We explore these choices in our Conservative Portfolio model, and our Silver ETF and Platinum Options Trading programs at www.technicalindicatorindex.com .
At Dr. McHugh’s www.technicalindicatorindex.com we track the short-term waves that make up these larger degree trends, and chart them in our forecast newsletters, and have developed several proprietary Buy/Sell indicators that help us identify when the next significant move is starting for the major stock indices, as well as for Gold, Silver and Mining stocks, and in which direction the move will develop. We publish these indicators in every Newsletter to subscribers. We offer education on how to trade markets up or down, based upon these indicators, patterns, and the overbought / oversold conditions that they identify with our Platinum Options and Silver ETF Trading programs. Our Memberships also include a Conservative Portfolio model.
*******


