Technical Analysis Of The Markets


Current Position of the Market
SPX: Long-term trend – There are no signs that the bull market is over.
Intermediate trend – Most likely near an intermediate top.
Analysis of the short-term trend is done on a daily basis with the help of hourly charts. It is an important adjunct to the analysis of daily and weekly charts which discusses the course of longer market trends.
Market Review
Point & Figure Overview of SPX
Long-term trend: The bull market which started in 03/09 shows no sign of having run its course. A rough count taken on the long-term Point & Figure chart gives us a potential target to as high as 4080. P&F does not predict time, only price.
Intermediate trend: The ~3180 projection was pretty much ignored by the index which, after a shallow consolidation a little higher, decided to go directly for the ~3240 target. This is the level which stands a good chance of bringing about an intermediate correction.
Short-term trend: The consolidation which occurred at ~3195 created a shallow formation which confirms a move to ~3240. The index broke out of that pattern last week and, by Friday had already reached 3225.
Market Analysis (All charts are courtesy of QChart)
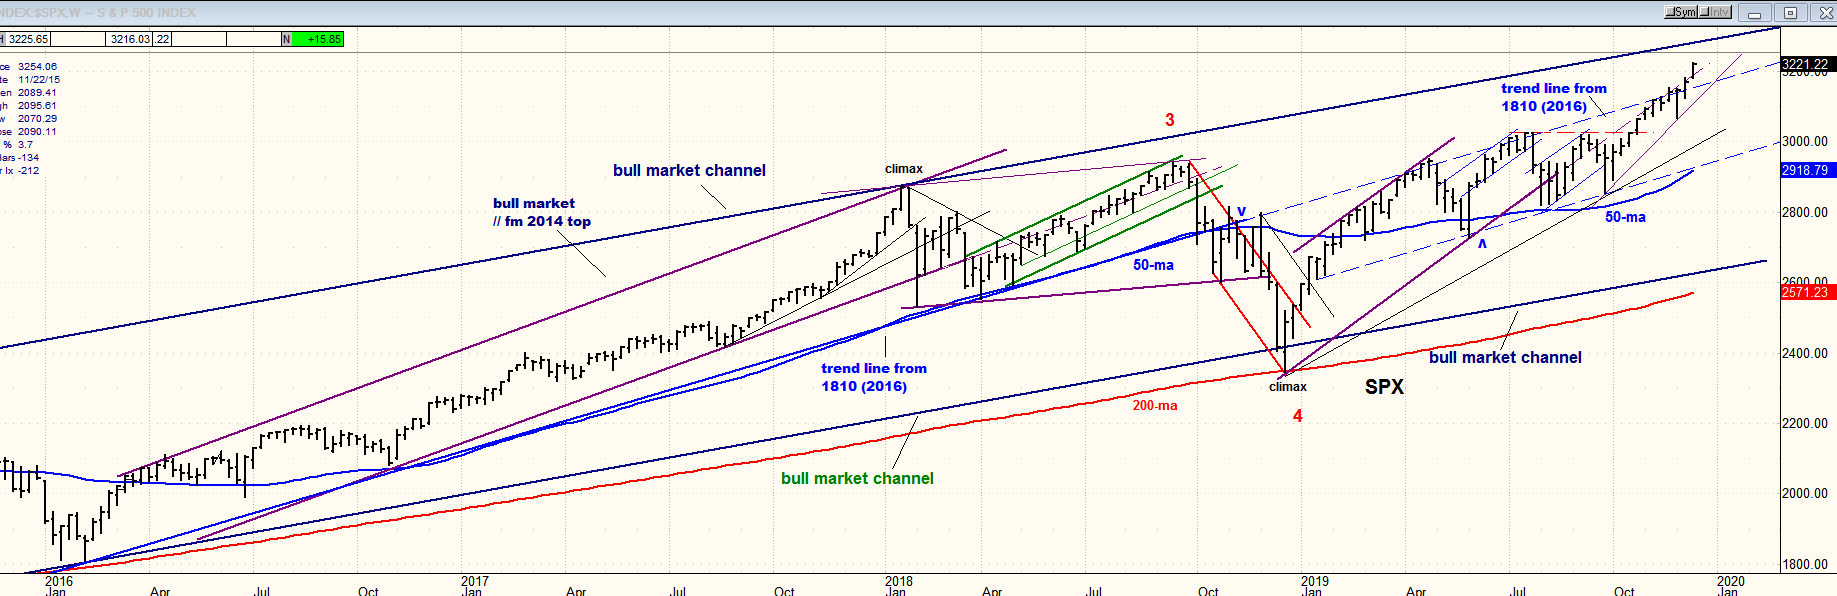
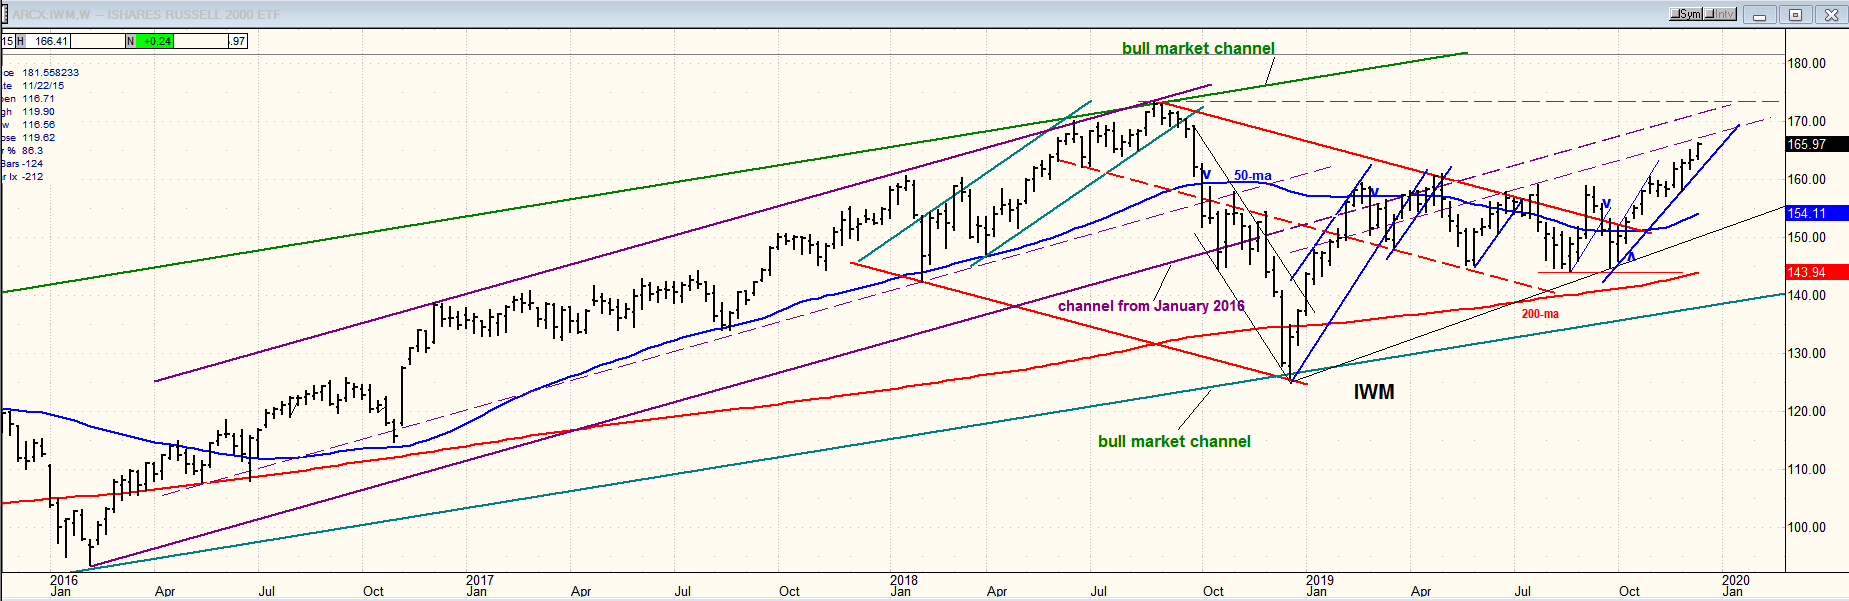
SPX-IWM weekly charts
Both indexes again made new highs last week. This was another all-time high for SPX which has now moved nearly 100 points above the extension of the trend line from 1810. That extension had provided resistance on three separate occasions since the trend line was broken a little over a year ago. Friday’s close also puts it about 70 points away from the top of the bull market channel!
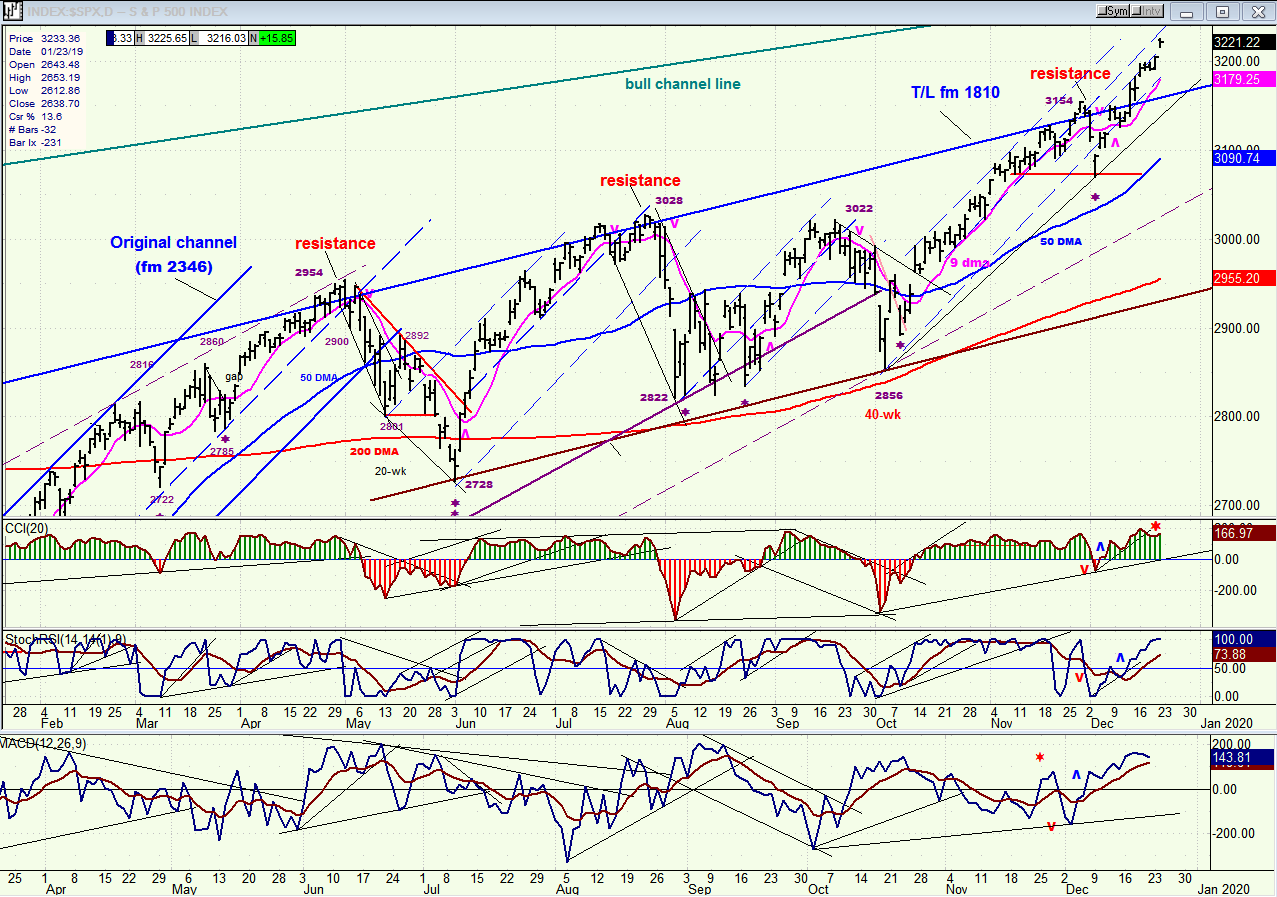
The long-term P&F chart suggests that a pause may be due at about 3240. With Friday’s close less than 20 points from that target, we could find out by next week how valid that projection will turn out to be.
There is nothing of particular interest in the current action of IWM, except that it continues to underperform SPX. On the other hand, the Dow Transports (also a leading index) are severely lagging and do not look predisposed to improve their performance.
SPX daily chart
With the passing of time, chart patterns change. The extension of the trend line from 1810 had formed the top of a channel in which the SPX had traded for several months, with well-defined boundaries. When the index reached 3154, it did what it had done in the past and turned down after finding resistance at the trend line extension; but that reversal was brief, and over the past three weeks SPX has reversed again to the upside and this time, has kept on going past the trend line extension from 1810.
The motive force behind this uptrend has been the 40-day cycle, which bottomed in early October and is now 12-weeks along. Ever since 2016, the 40-wk cycle has had a regular beat which has been interrupted consistently by a decline into its half-span: the 20-wk cycle. The next 20-wk cycle low is due in February, along with two other cycles (45-td, and 80-cd) which also have a fairly consistent effect on the market. In February, these three cycles are due to make their lows over the space of about a week. This would be an excellent reason for SPX to pause at its ~3240 P&F projection and reverse its trend into February. Then, after a rally the next important low is due in July where the following 40-week cycle low is due along with the 9-year cycle low. So, as you can see, SPX has an incentive to make an intermediate top around 3240 and a corrective move perhaps all the way into July 2020.
I also want to point out that negative divergence has reappeared in the daily CCI with last week’s move to a new price high.
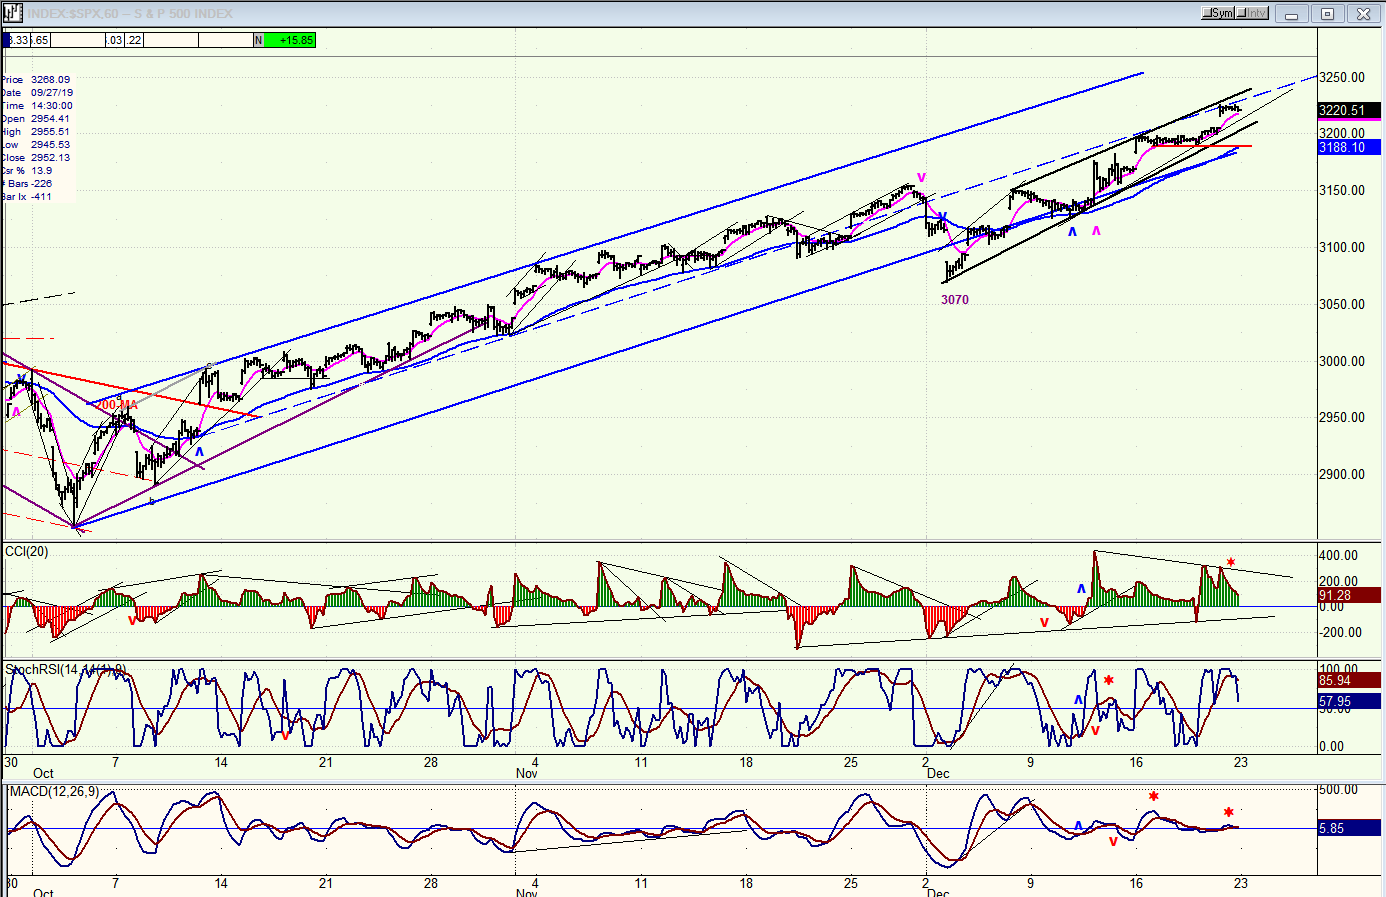
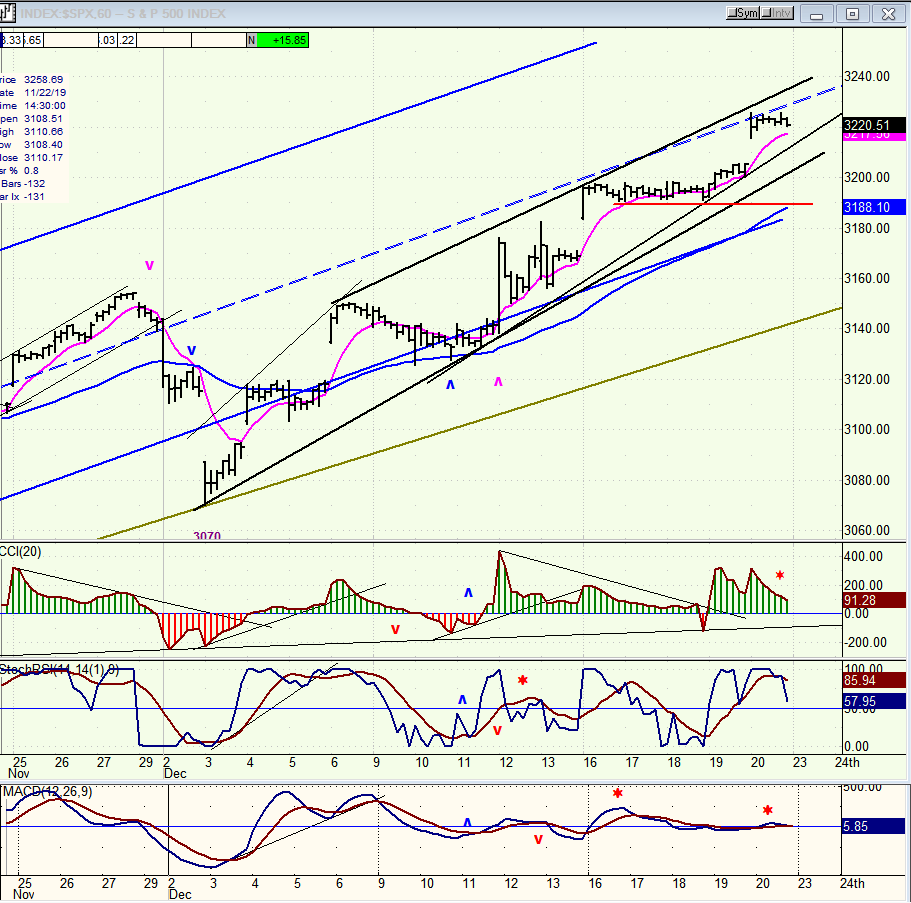
SPX hourly chart
Below, I have posted two charts of the SPX hourly chart. The first shows the entire uptrend since the low of the 40-wk cycle. The second is just the last phase of that uptrend.
The index has traded in the blue channel since 2856. It was breached when a 4th wave occurred, but prices quickly went back inside although they have remained below the mid-channel (dashed) line.
We’ll now turn to the second chart to examine the final phase (ostensibly a 5th wave) from 3070. In that last phase, I can draw a line across the tops, but I cannot connect the lows with a single trend line because the move is accelerating upward -- even after an uptrend of 353 points without a decent consolidation along the way. This looks to me like a climactic move which could be ready to reverse suddenly after reaching its destination (~3240???).
At the same time, negative divergence shows in all three oscillators, and it is most pronounced in the lowest one (A-Ds). I believe this is a time for caution if you are bullishly inclined.
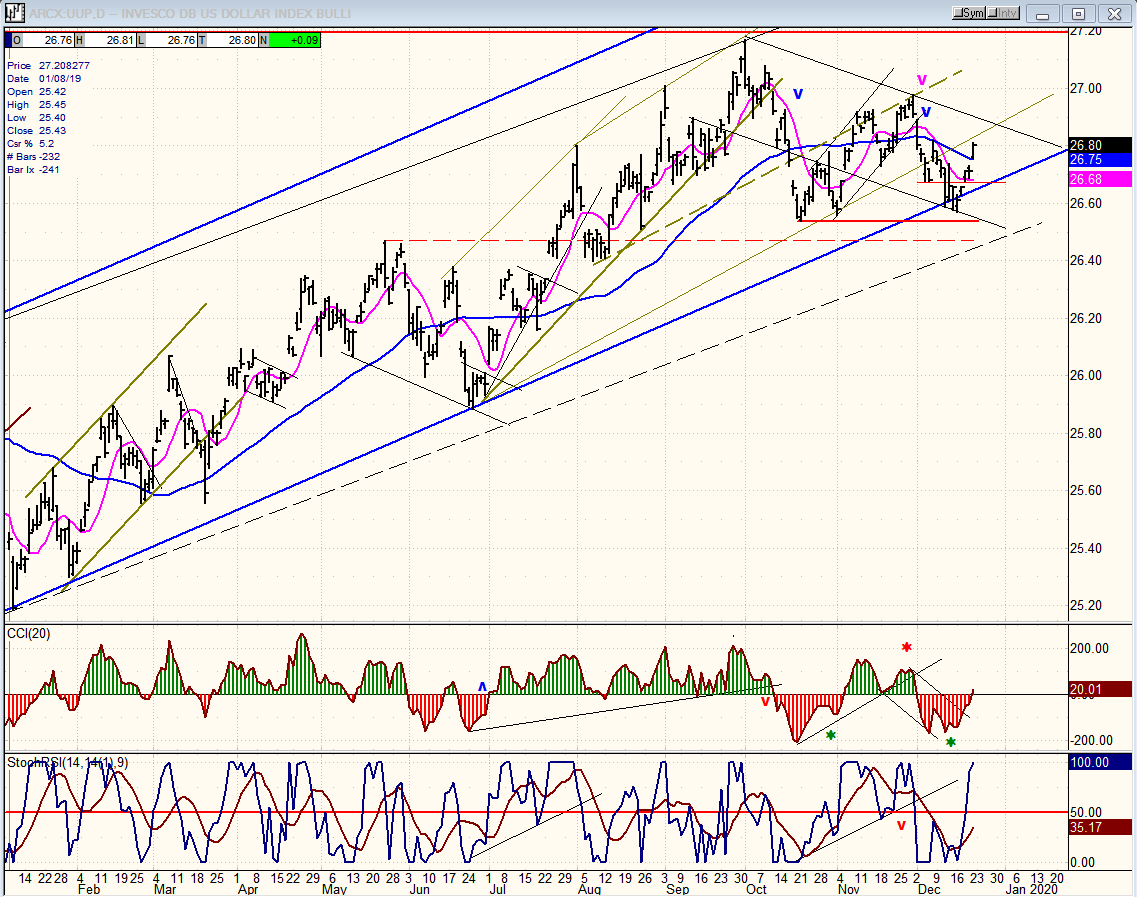
UUP (dollar ETF) daily
UUP has found support on the lower blue channel line and bounced. I’m not sure how much of a bounce we’ll get here, so I want to give it a little time before passing judgment.
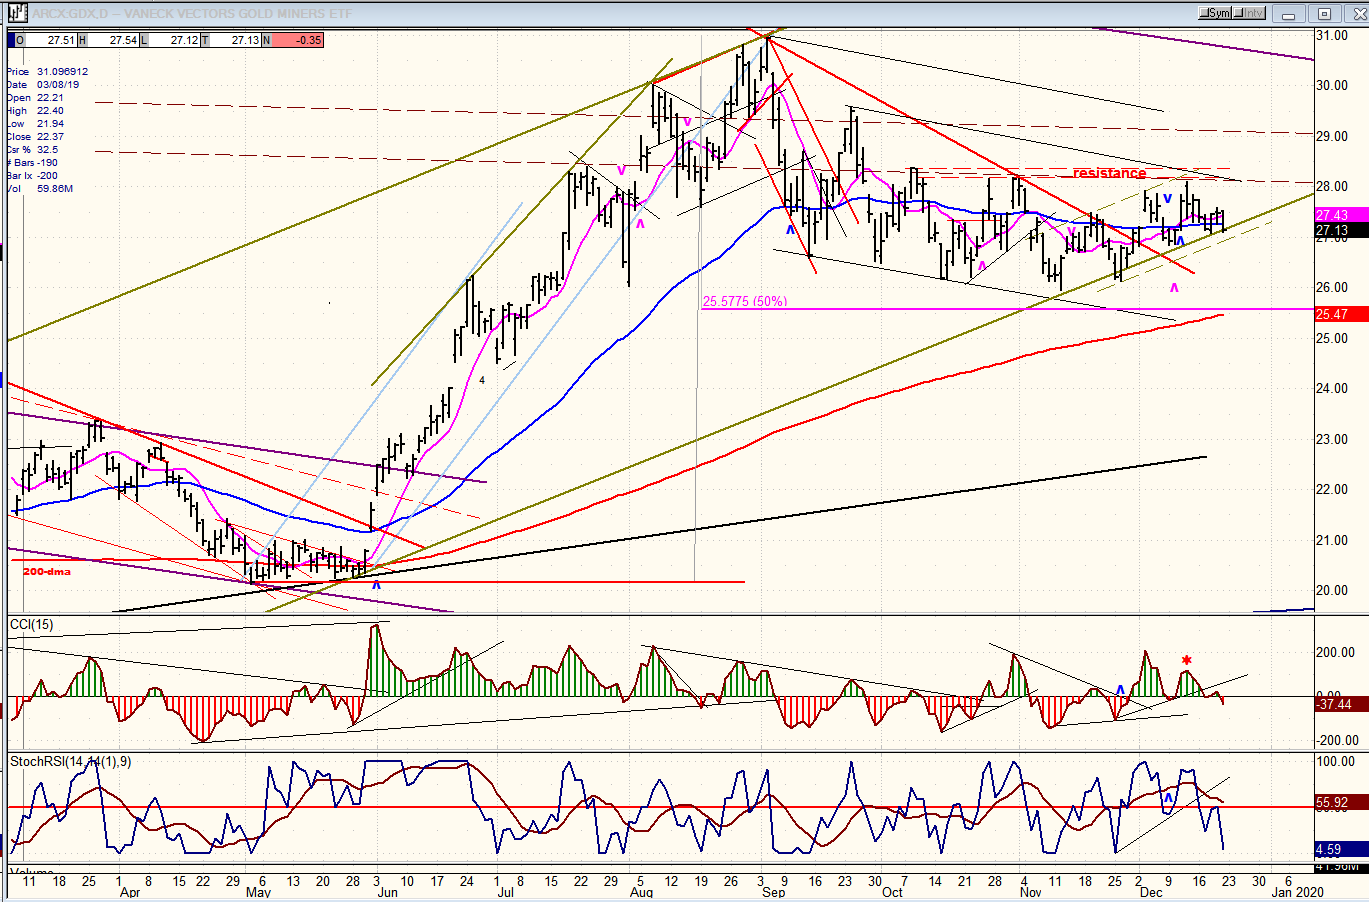
GDX (Gold miners ETF) weekly
GDX has corrected all the way down to the bottom of the green channel and has held the channel line ever since early November. It now looks vulnerable to breaking it, but perhaps not by much or for very long before reversing -- perhaps just long enough to complete the significant consolidation which has been taking place above 26.00.
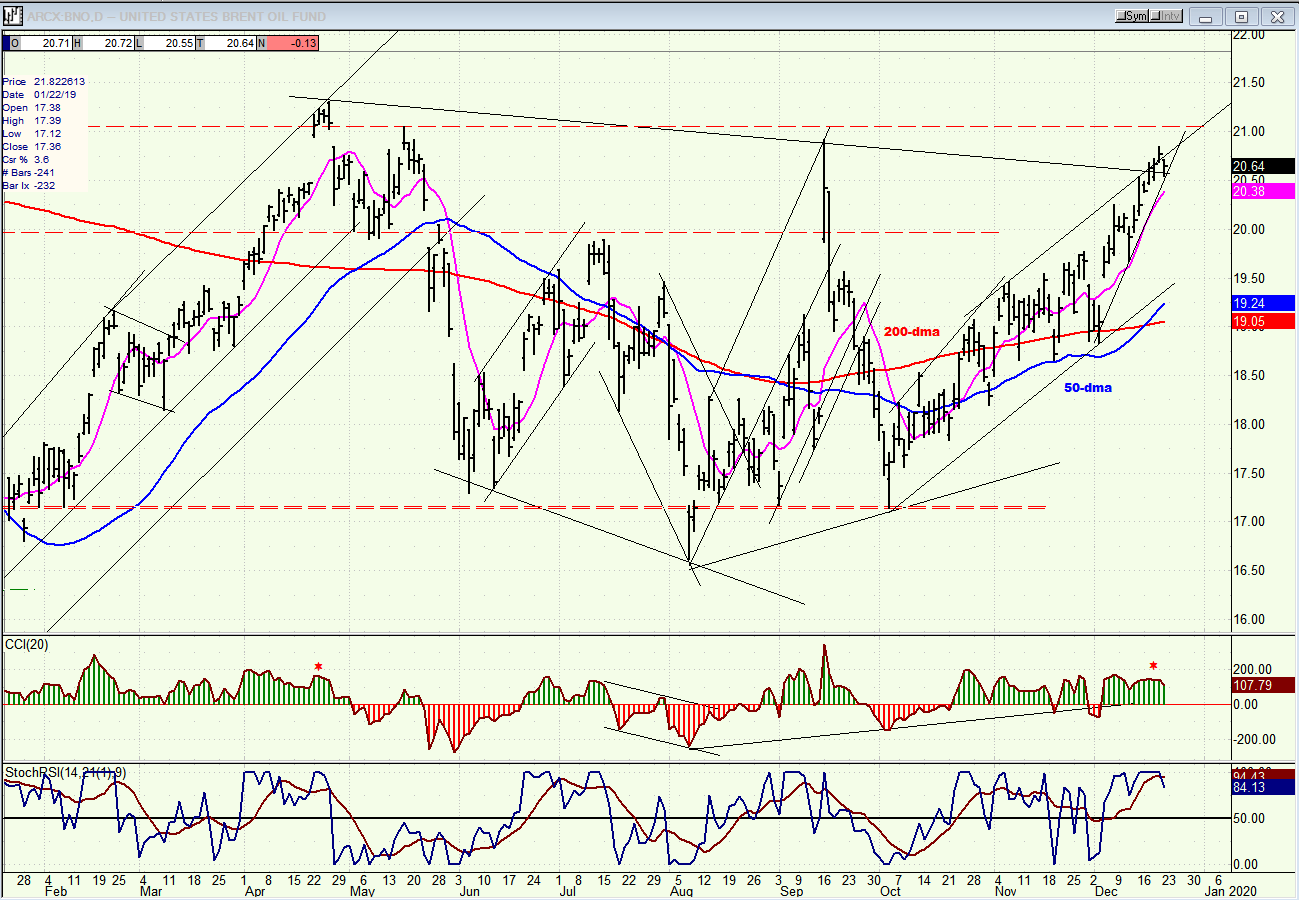
BNO (U.S. Brent oil fund) daily
BNO may have gone as far as it can before reversing. Both the price action and its oscillators suggest that it is ready to do so.
Summary
The combination of P&F projection to 3240 plus the cycles due to make their lows in February offer the best hope for an end to the uptrend from 2856. While P&F projections are only potential targets, they are often uncannily accurate and should not be dismissed lightly.
FREE TRIAL SUBSCRIPTON
With a trial subscription, you will have access to the same information that is given to paid subscribers, but for a limited time period. I think you will find that knowing how far a move can carry is one of the most useful benefits of this service, whether you are a trader or an investor -- especially when this price target is confirmed by reliable indicators which give advance warning of a market top or bottom. Furthermore, cycle analysis adds the all- important time element to the above price projections. For a FREE 4-week trial, further subscription options, payment plans, and for general information, I encourage you to visit my website at www.marketurningpoints.com.
The above comments about the financial markets are based purely on what I consider to be sound technical analysis principles. They represent my own opinion and are not meant to be construed as trading or investment advice, but are offered as an analytical point of view which might be of interest to those who follow stock market cycles and technical analysis.
*********

When Andre Gratian was a stock broker years ago, a friend introduced him to technical analysis of the market. Consequently, it is not an exaggeration to say that Andre fell in love with this approach! Ever since then, it has become an increasingly important part of his professional life. Gratian has studied the works of Wyckoff, Edwards & Magee, Edward J. Dewey (cycles) and many others. However, one of my most profitable undertaking has probably been to study Point & Figure charting, which he finds invaluable in analyzing stocks and indices. If he were restricted to one methodology, this is the one that he would choose. This well-rounded background has given him what he feels to be a special insight into the stock market, facilitating the recognition of meaningful patterns and the ‘turning points’ in all trends, whether they be short or long term. Andre feels very comfortable discussing the stock market and passing on meaningful information to others. His subscribers include individuals and money managers throughout the world. Moreover, his Newsletters are currently published on several financial sites, here and abroad.
More from Gold-Eagle


