Technical Analysis Of The Markets


Current Position of the Market
SPX: Long-term trend – There are no signs that the bull market is over.
Intermediate trend – Most likely near an intermediate top.
Analysis of the short-term trend is done on a daily basis with the help of hourly charts. It is an important adjunct to the analysis of daily and weekly charts which discusses the course of longer market trends.
Market Review
Point & Figure Overview of SPX
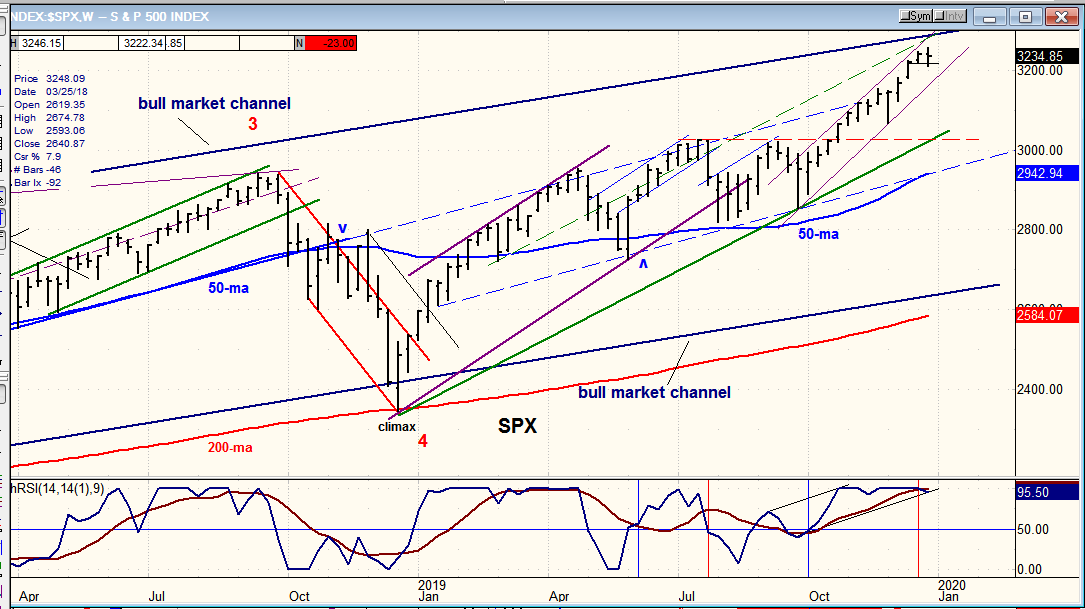
Long-term trend: The bull market which started in 03/09 shows no sign of having run its course. A rough count taken on the long-term Point & Figure chart gives us a potential target to as high as 4080. P&F does not predict time, only price. (no change)
Intermediate trend: The 3240 target was met on Friday 12/27/19. Some congestion (probably distribution) has formed at that general level since, but an intermediate top has not been confirmed, yet. It would take a decline down to at least 3220 to create a reversal on the long-term (3X10) P&F chart.
Market Analysis (All charts are courtesy of QChart)
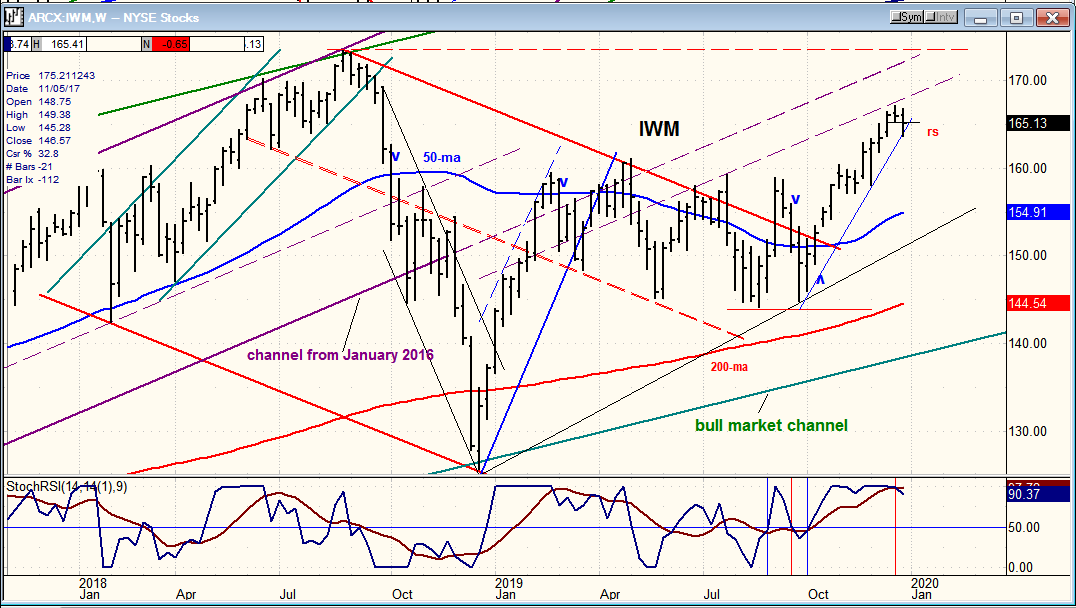
SPX-IWM weekly charts
Last week, SPX made another new all-time high, but also dipped slightly below the previous week’s low. IWM did not make a new high but it dipped even lower than SPX -- under the previous week’s low. This is a faint sign that IWM may be reasserting its relative weakness to SPX which would mean that we are getting close to a reversal. The price action of both indexes could suggest that the 3240 projection is valid, but it would be premature to regard this as more than a possibility at this time.
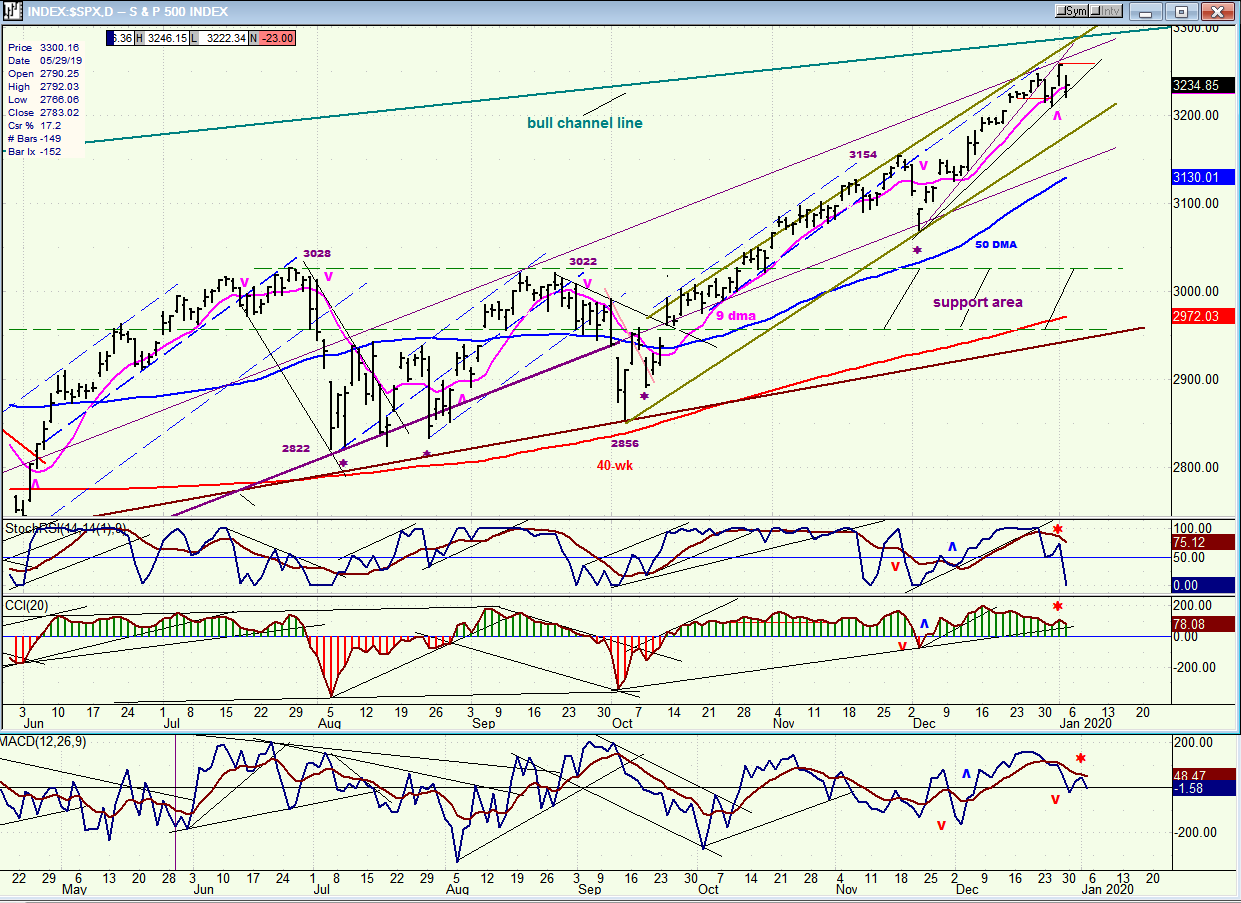
SPX daily chart
Whether you look at the price action or at the various indicators, there is some evidence that we could be close to a reversal of the trend which started at 2856. For the past week, SPX has traded in a limited range, which is in contrast with the previous steady uptrend and daily new, all-time highs. This may only be the beginning of a distribution pattern which will result in a decline when enough pressure is being exerted by the cycles scheduled to make their lows in February. These are not major cycles, but they are capable of bringing a respite to the seemingly endless series of new highs in the market.
Consolidations and corrections are normal in a bullish uptrend and they can best be forecast by oscillators which are usually the first to detect the loss of upside momentum and the beginning of a reversal, and this is what those at the bottom of the chart are suggesting. The sequence is always the same: first, negative divergence appears indicating that buyers are beginning to be less aggressive; next, the oscillators become negative as sellers regain the upper hand. Currently, only the SRSI has gone negative. It will take all three going into the red to confirm a decline in prices. We are not quite there yet, and this suggests that we could see more distribution taking place at the current level before the SPX rolls over.
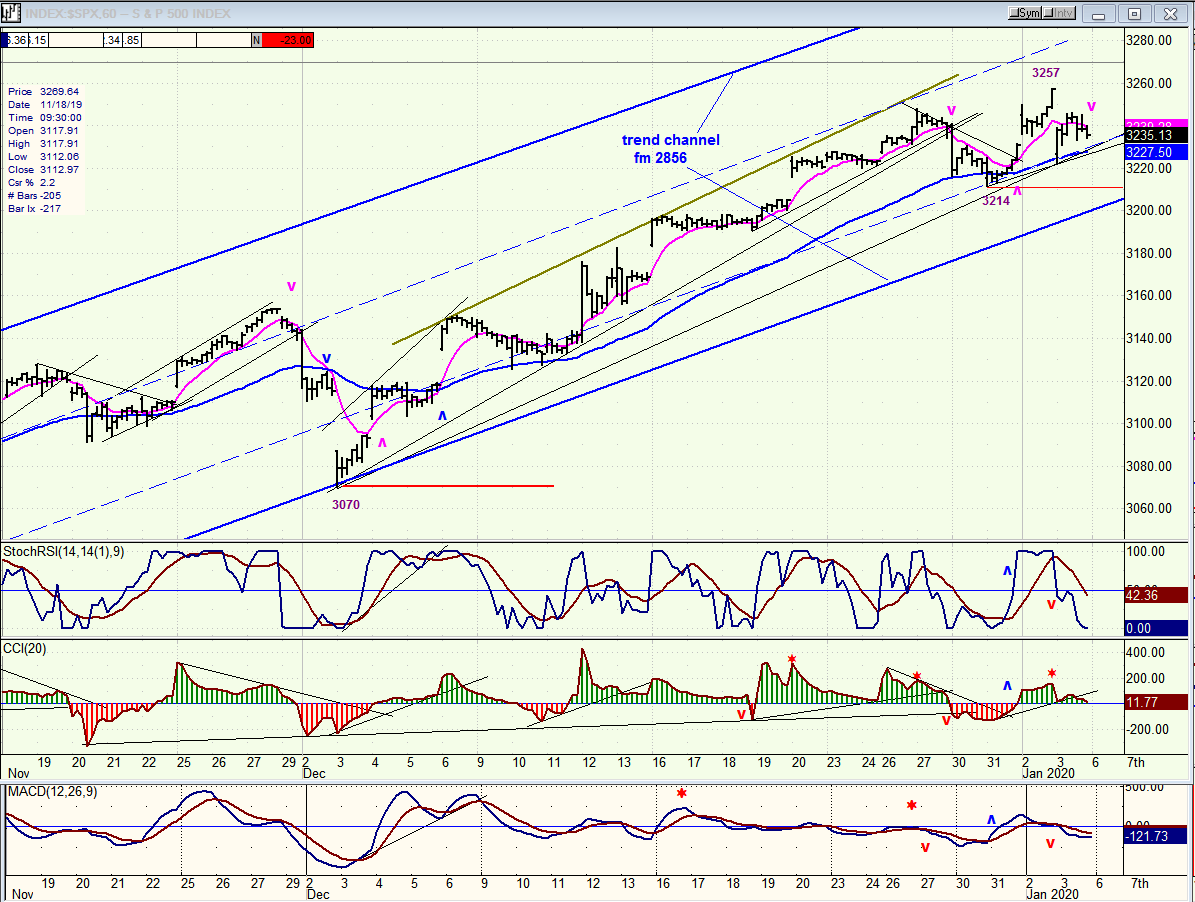
SPX hourly chart
The trend channel from 2856 broadened after the short-term correction to 3070. Since then, prices have continued to progress upward in roughly the middle third of the channel, and the index may be ready to challenge the bottom channel line if it can trade below 3214 as the current near term retracement makes its way lower. The hourly oscillators suggest this with two of them already negative and the CCI just about ready to join them after Friday’s close. If it finds support at/near the channel line, SPX could continue the topping process which appears to be underway. Or even move still higher if the uptrend continues until the trade agreement is signed on January 15. This is the most logical date for the rally from 2856 to end, unless Middle-Eastern events take precedence and derail the market sooner.
There are three cycles bottoming within a week or ten days of one another around February 15th. These should give us a correction into that date and the index is perhaps already preparing for this decline by starting to create a congestion top which will enable us to evaluate the extent of that correction when complete.
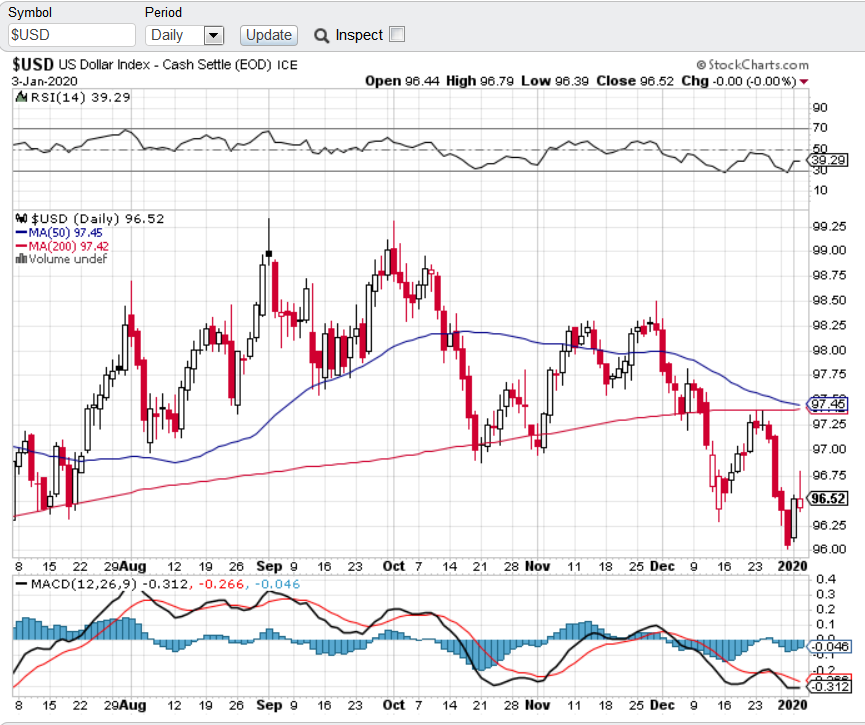
$USD daily (courtesy StockCharts)
The USD made a new correction low last week and, by staying above 96.00, may have signaled a short-term low which could hold prices above this level for some time.
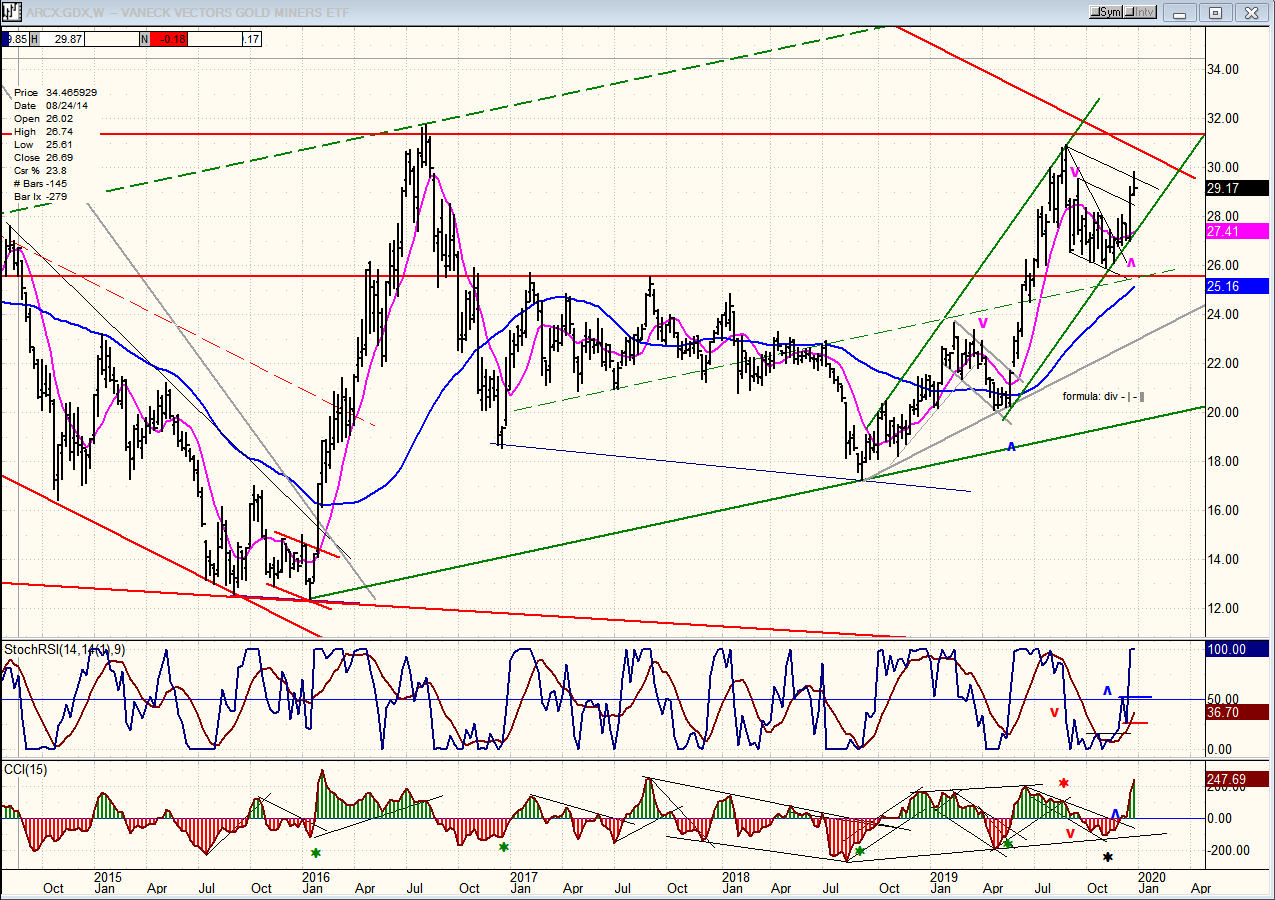
GDX (Gold miners ETF) weekly
GDX has concluded its corrective phase and started to move toward its next objective of 30.50-31 near-term, and 38-38.50 intermediate term. Longer term, GDX has built a base since December 2016 which is capable of supporting a move to about 61.00. The recent move outside of its consolidation phase appears to be wave 1 of intermediate wave 3 from the July 2019 low.
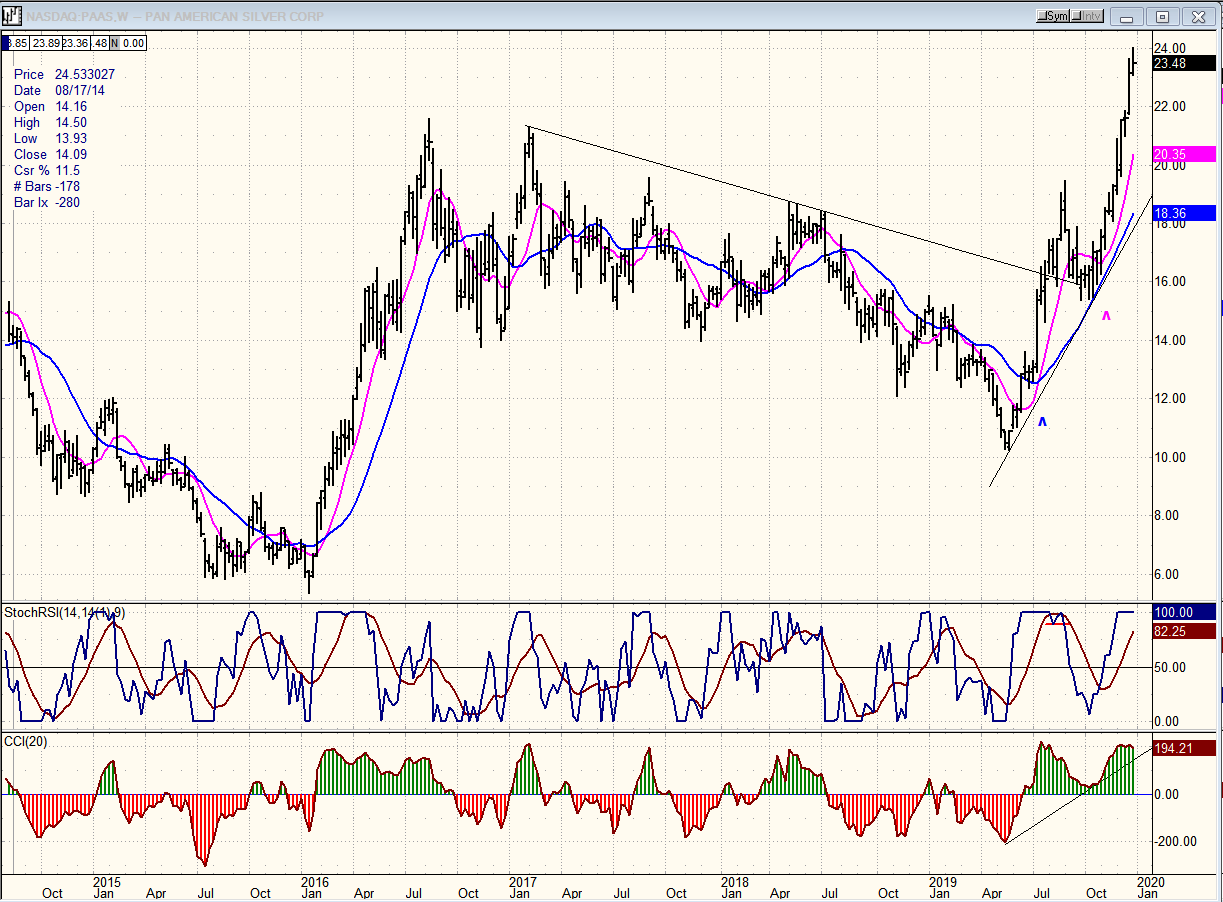
PASS (Pan American Silver Corp.) Weekly
The precious metals have built bases which can produce significant moves, and these are just starting. PASS has a weekly chart pattern which is very similar to GDX (above). Its P&F chart also gives it a similar potential with a count to 55-60.
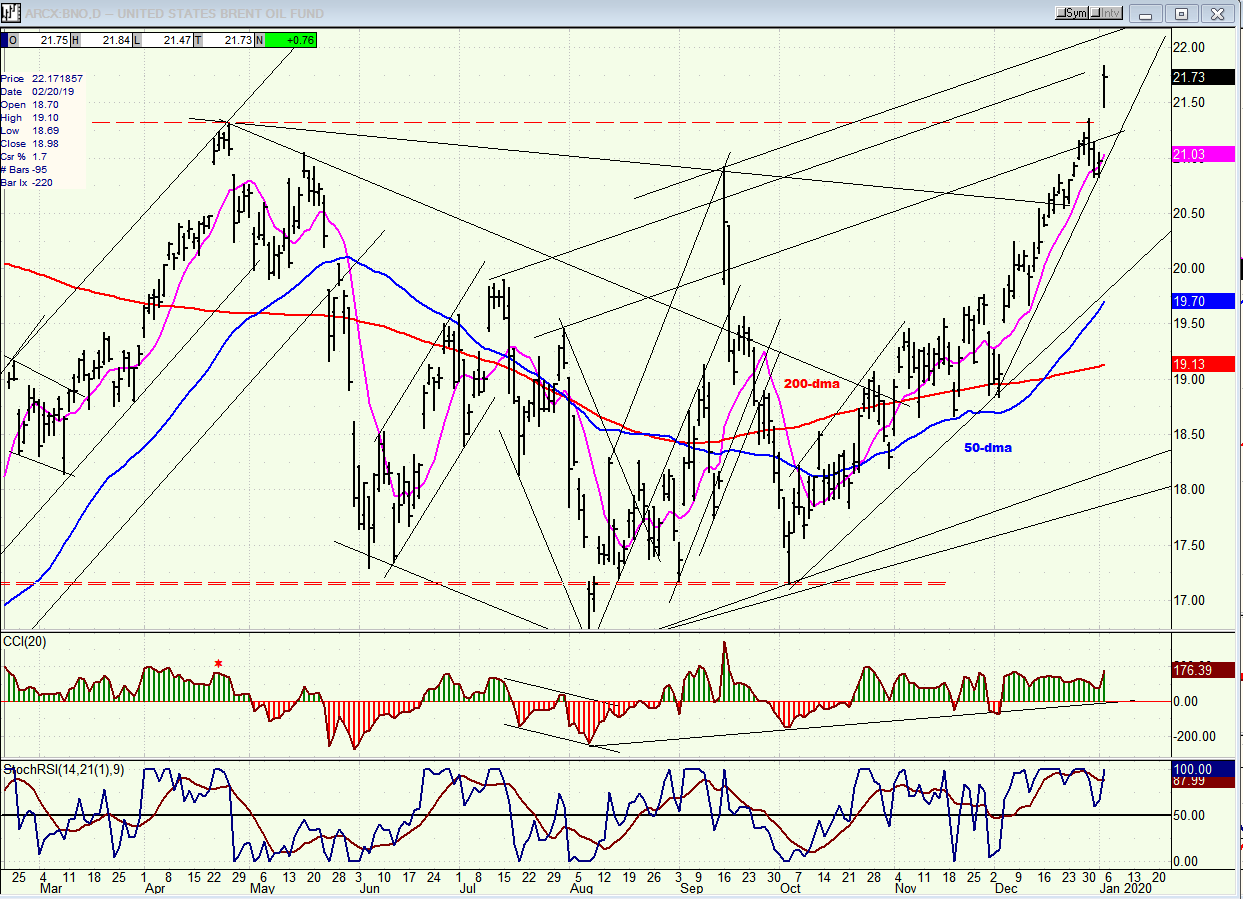
BNO (U.S. Brent oil fund) daily
BNO has profited from recent events in the Middle East and is quickly nearing its short-term projection to 22.00. Longer term, it is capable of reaching 31-35.
Summary
With January 15 being the prospective date for the signing of Phase One trade agreement between the USA and China, it would seem to be the logical time for SPX to end its uptrend from 2856 near that date. Because 3240 has already been exceeded, the next potential target of 3270-3300 could still mark the high of that phase. On the other hand, events in the Middle East could restrict any further price increase.
FREE TRIAL SUBSCRIPTON
With a trial subscription, you will have access to the same information that is given to paid subscribers, but for a limited time period. I think you will find that knowing how far a move can carry is one of the most useful benefits of this service, whether you are a trader or an investor -- especially when this price target is confirmed by reliable indicators which give advance warning of a market top or bottom. Furthermore, cycle analysis adds the all- important time element to the above price projections. For a FREE 4-week trial, further subscription options, payment plans, and for general information, I encourage you to visit my website at www.marketurningpoints.com.
The above comments about the financial markets are based purely on what I consider to be sound technical analysis principles. They represent my own opinion and are not meant to be construed as trading or investment advice, but are offered as an analytical point of view which might be of interest to those who follow stock market cycles and technical analysis.
********

When Andre Gratian was a stock broker years ago, a friend introduced him to technical analysis of the market. Consequently, it is not an exaggeration to say that Andre fell in love with this approach! Ever since then, it has become an increasingly important part of his professional life. Gratian has studied the works of Wyckoff, Edwards & Magee, Edward J. Dewey (cycles) and many others. However, one of my most profitable undertaking has probably been to study Point & Figure charting, which he finds invaluable in analyzing stocks and indices. If he were restricted to one methodology, this is the one that he would choose. This well-rounded background has given him what he feels to be a special insight into the stock market, facilitating the recognition of meaningful patterns and the ‘turning points’ in all trends, whether they be short or long term. Andre feels very comfortable discussing the stock market and passing on meaningful information to others. His subscribers include individuals and money managers throughout the world. Moreover, his Newsletters are currently published on several financial sites, here and abroad.


