Technical Analysis Of The Markets


Current Position of the Market
SPX: Long-term trend – Having rallied well past a .618 retracement of the decline into March 2020, it is time to consider the possibility that the retracement was only an interruption of the bull market which originated in 2009.
Intermediate trend – Up from March 23,2020.
Analysis of the short-term trend is done daily with the help of hourly charts. It is an important adjunct to the analysis of daily and weekly charts which discusses the course of longer market trends.
New Bull or Same Old One?
Important Cycles
Did the 4.5-year cycle bottom in March instead of waiting for its ideal low point in July? This is a possibility according to a Hurst analyst.
Point & Figure Overview of SPX
Intermediate projection: 3220-3250?
Market Analysis (Charts courtesy of QChart)
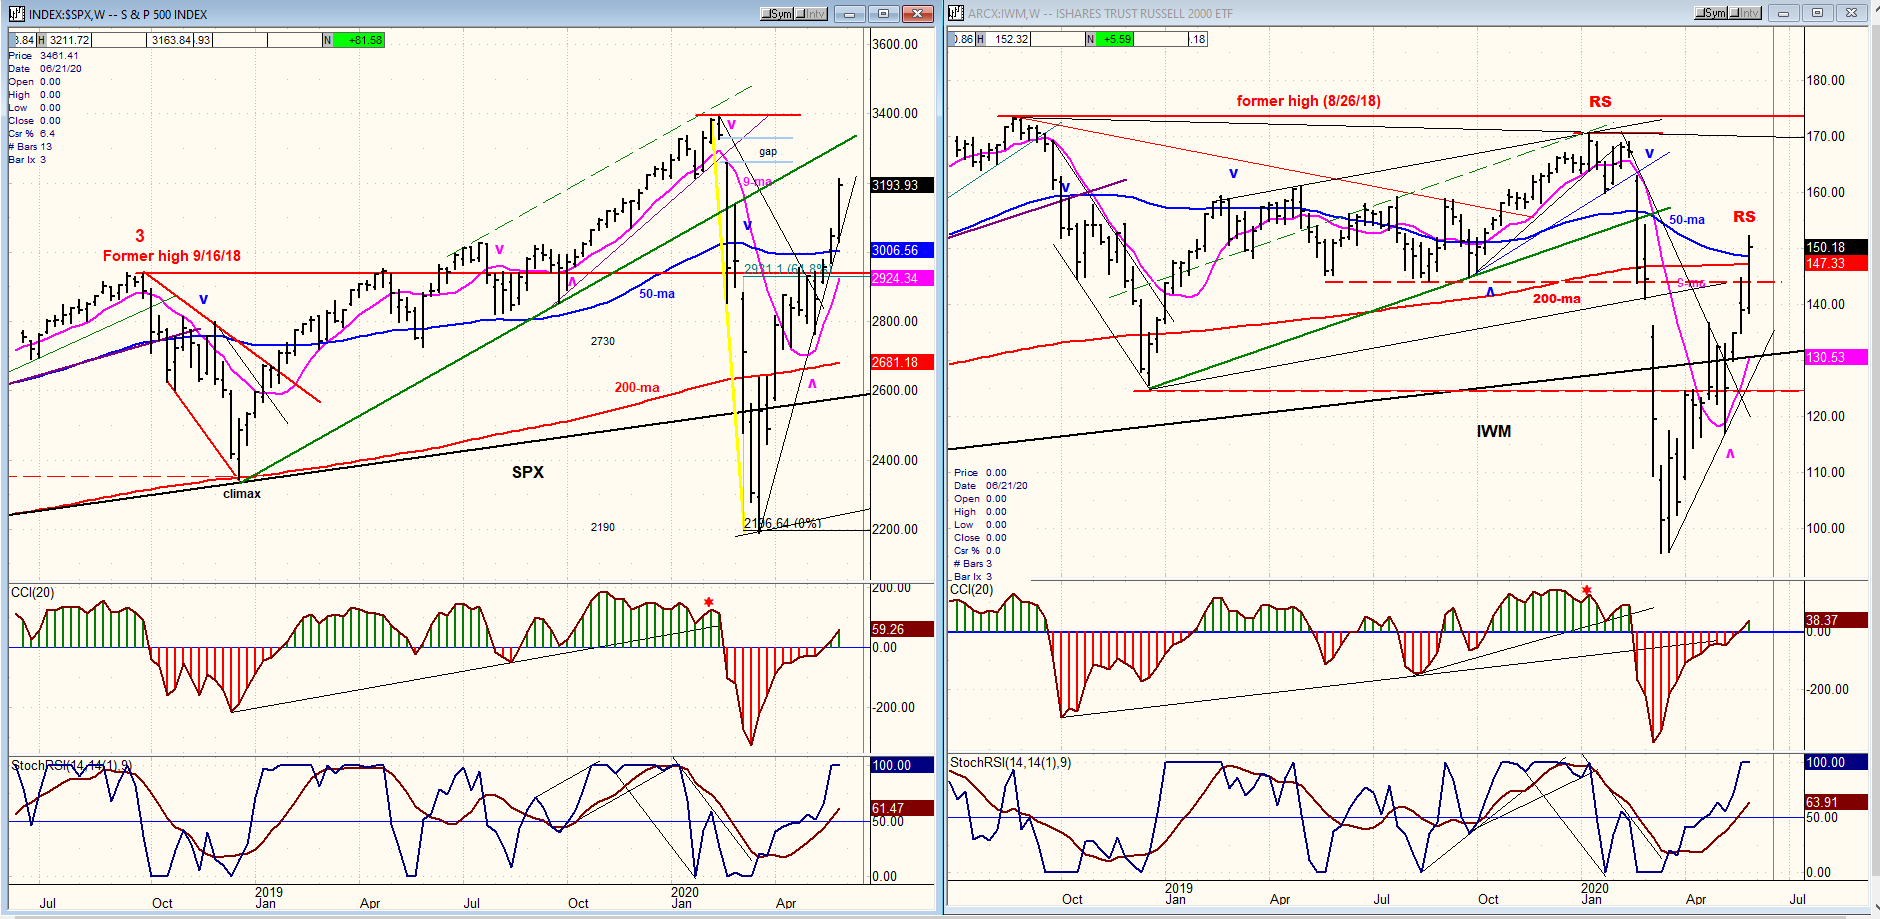
SPX-IWM weekly charts
Trying to reconcile the market action with the background of pandemic, riots, and economic statistics which rival those of the great depression can make your head spin! That is why technical analysis is the only sane alternative to understanding what is taking place. Keeping it simple, the market found a low in March and started a rally which just made a new high last Friday. This rally, for the time being at least, has taken the market out of the bear territory and opened the possibility that we have resumed the long-term trend which started in 2009. Possible! If the market continues its uptrend and makes a new high, this will be confirmed. But this is not yet a given, because it is also possible that the rally is about to come to an end. The base that was formed at the 2450 level by SPX had the potential of supporting a move to the 3220-3250 level (conservative count) or to about 200 points higher (liberal count). Any projection past these levels would include some “weak count” which is not reliable. Assuming the conservative count is correct, what happens over the next several weeks will decide whether we are still in a bull market.
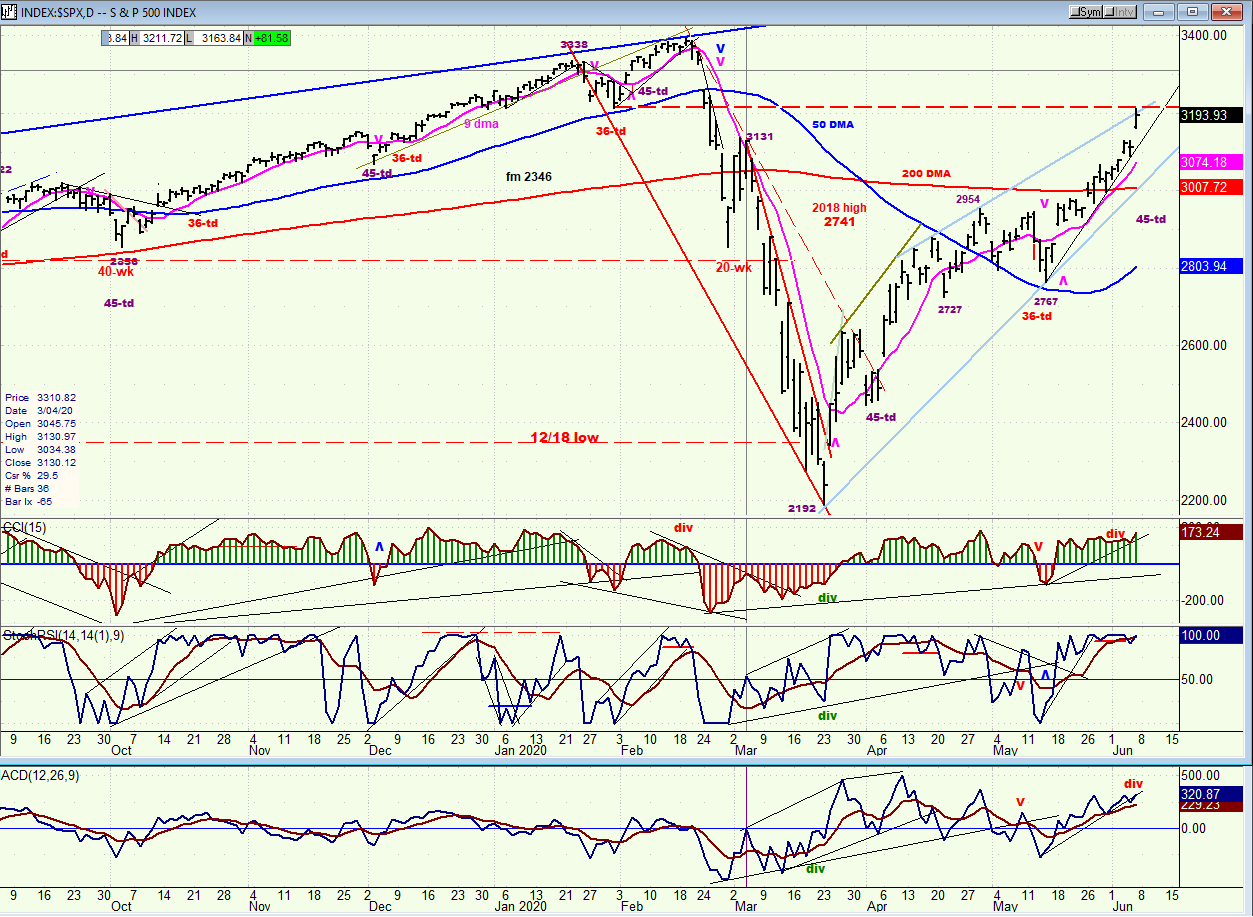
SPX daily chart
On Friday, SPX reached 3212 in what looks like a buying climax. Since the daily high occurred at resistance, very near the projection posted above, and there is still a chance that the 45-td cycle low (ideally due Tuesday) is still ahead of us, we could get a pull-back for a couple of days followed by another test of the projection area. This is what I would like to see to suggest that my analysis is correct.
To show that the move has ended, SPX needs first to fall below the near-term trend line. Next should come some congestion forming a topping area or, if we are going to move higher, forming a base for the next phase up.
The oscillators made new highs with the price. The only negative divergence remains in the A-Ds. That would indicate that higher prices should come before we start a decline; it does not tell us how much higher we need to go.
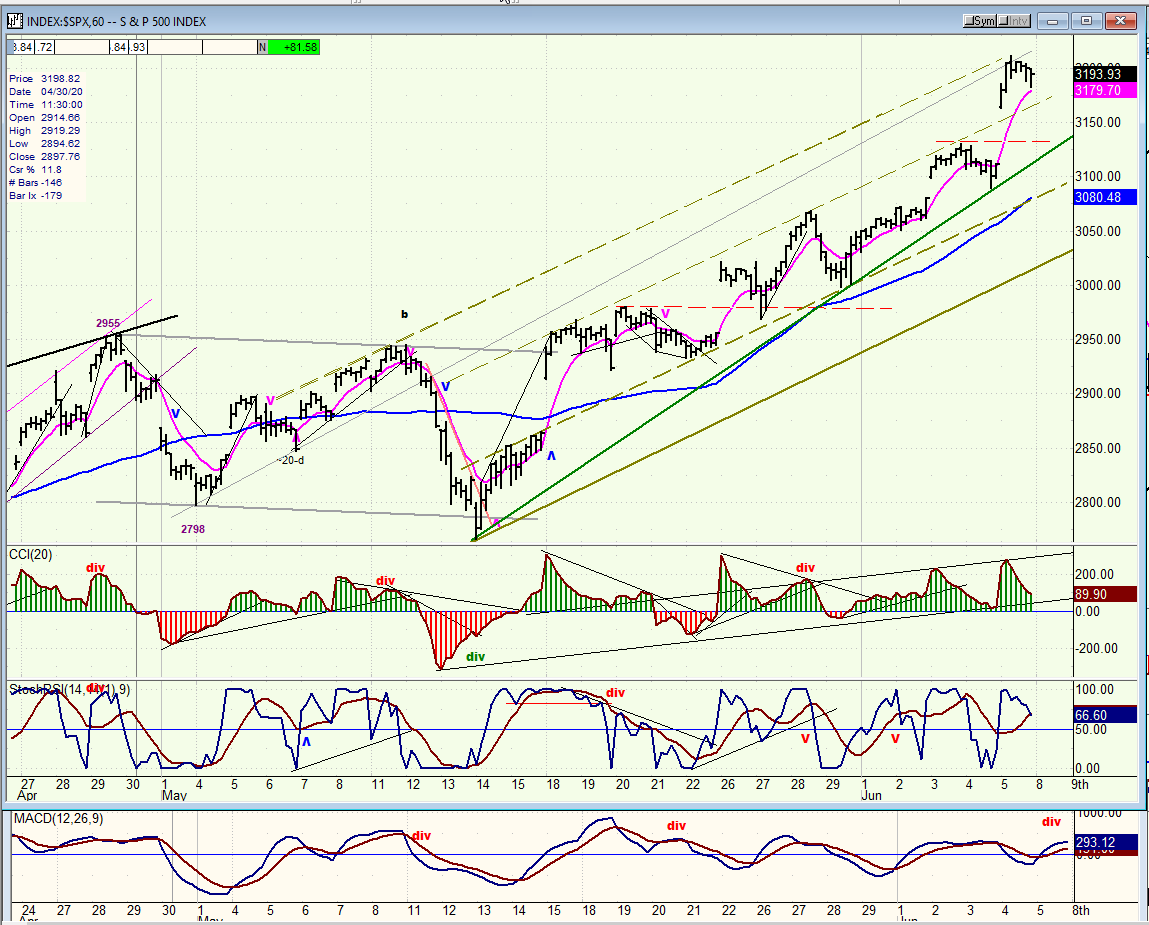
SPX hourly chart
In the last Newsletter, I had expected that a short-term correction was in the making, but it was cut short by the better than anticipated, non-farm payrolls report on Friday which seems to have come as a big surprise to analysts.
The uptrend started at 2767 and appears to have run into resistance at 3214 (shown on the daily chart) as well as from various trend and channel lines drawn on the hourly chart. There was not enough of a retracement to go beyond the shortest MA, or to cause the oscillators to give a sell signal. Nor was there clear enough negative divergence to indicate the probability of a top, except in the A-Ds. The futures lost a little more ground after the close, but not enough to be convincing. We should know better on Sunday night! If they continue to decline, it will probably suggest a lower opening on Monday.
At first glance, the move does appear complete, especially with what looks like an exhaustion gap taking place at Friday’s opening. If it is, at the very least we should expect it to be filled right away.
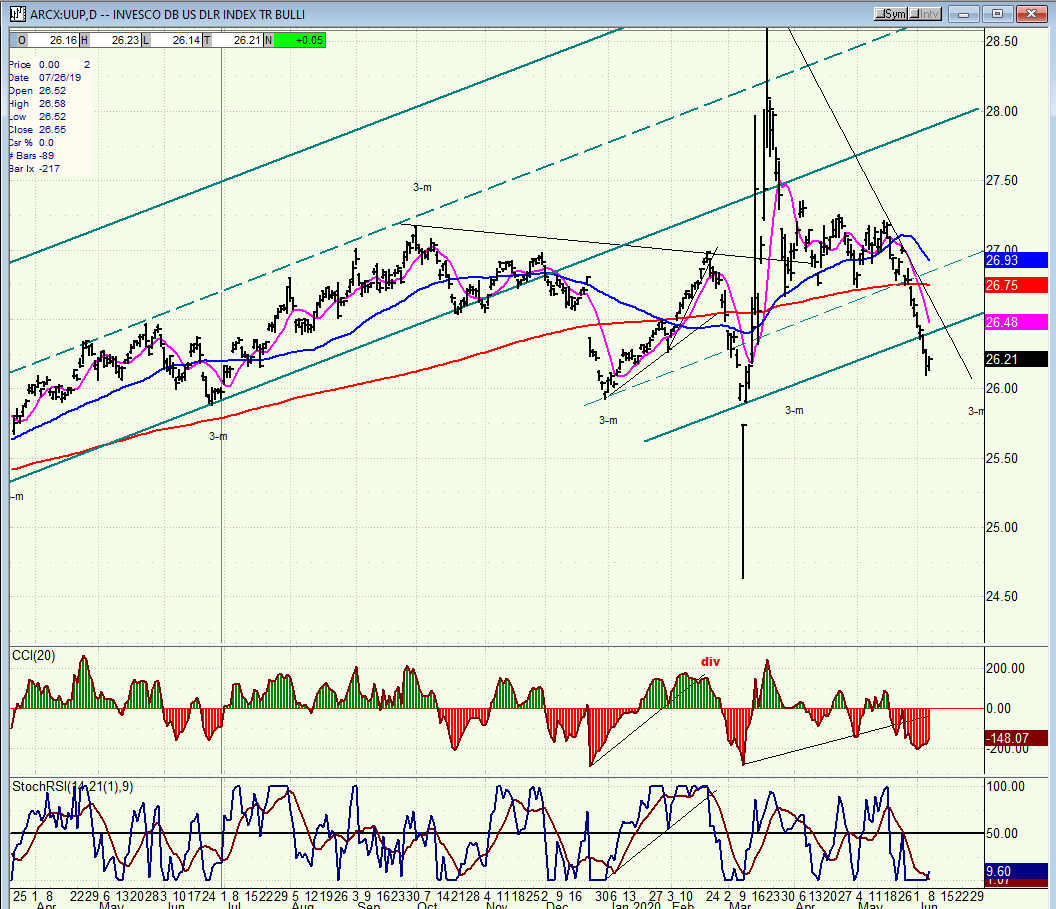
UUP (dollar ETF) daily
It’s interesting that the “good” report on Friday did not cause a stir in UUP. Perhaps this tells us that the data was distorted. In any case, the index continues to be pulled lower by the bottoming 3-mo cycle which has approximately three more weeks to go.
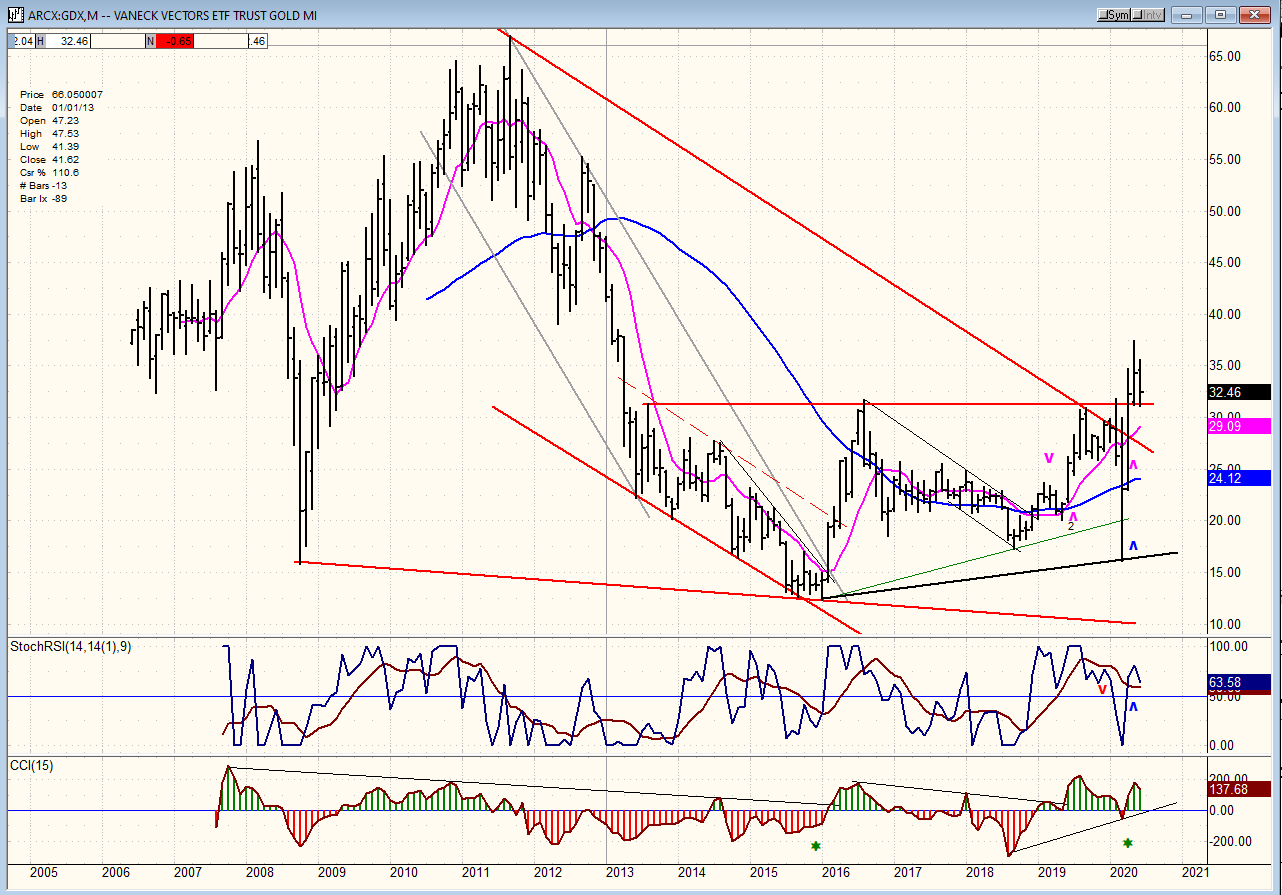
GDX (Gold miners ETF) monthly
The monthly chart of GDX shows that a significant base has been formed since 2013 and that the index has risen above it. This is suggestive of long-term price appreciation. Near-term, the index appears to be consolidating after breaking out of its base.
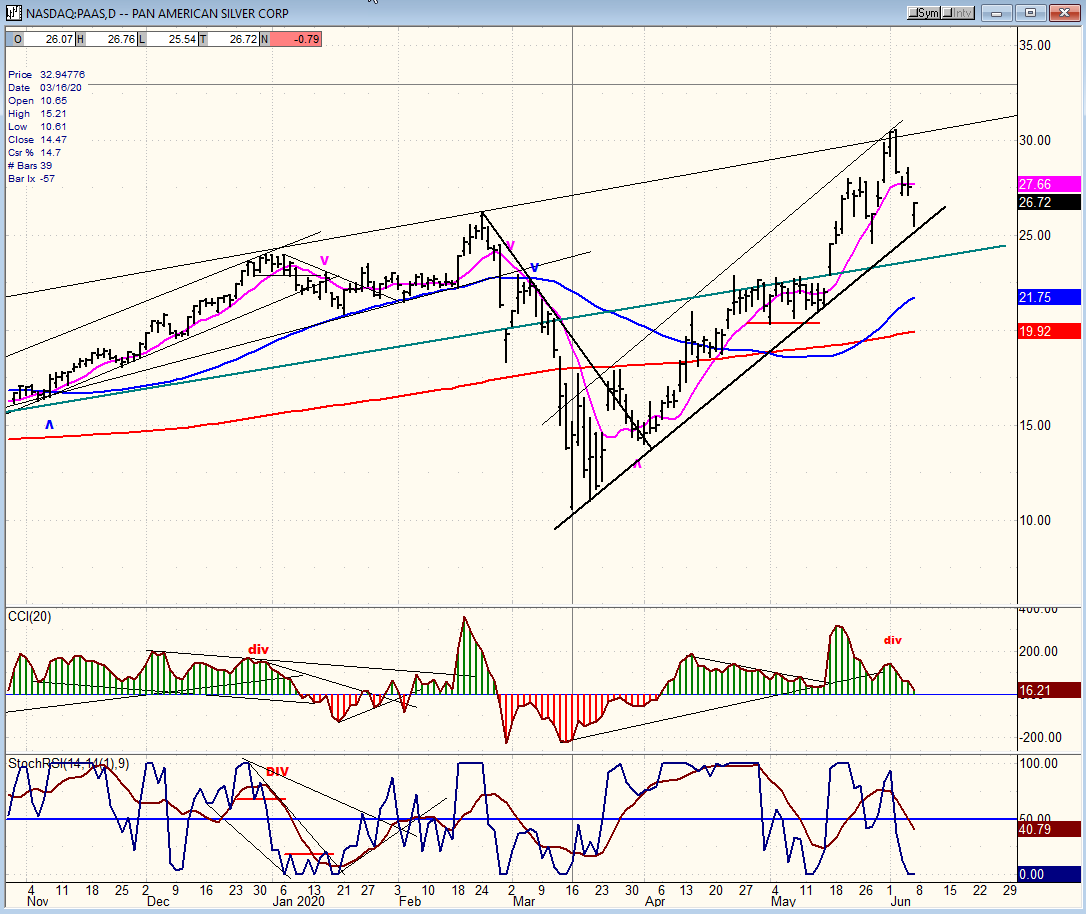
PAAS (Pan American Silver Corp.) daily
PAAS is also correcting after tracing a new recovery high from the severe sell-off in March. It has found resistance at the top of its current bullish channel, as well as at the top of a former, intermediate channel. As in GDX, the long-term base that it has built is indicative of higher prices. The current pull-back may only be short-term.
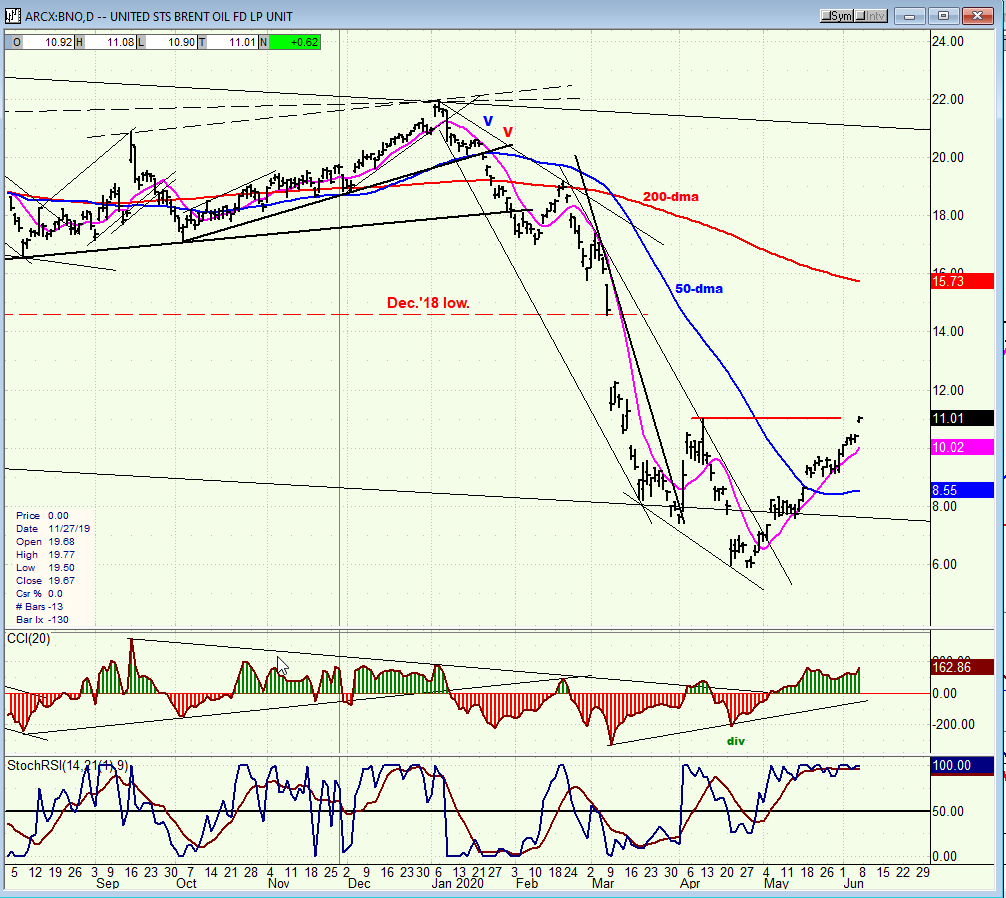
BNO (U.S. Brent oil fund) daily
BNO continues to move along with the market and will start to retrace when the market does. It is still expected to build a base before it can move substantially higher.
Summary
“… SPX has continued to drive towards its intermediate destination (which could be at least 2160) before the 40-wk cycle forces a severe retracement into mid-July.”
SPX has now surpassed the minimum recovery target provided by the base count, and has come much closer to the conservative intermediate target (mentioned above) which is more likely to show an end to the rally from the March low -- unless traders opt for the liberal count which could take prices a couple hundred points higher.
FREE TRIAL SUBSCRIPTON
With a trial subscription, you will have access to the same information that is given to paid subscribers, but for a limited time period. I think you will find that knowing how far a move can carry is one of the most useful benefits of this service, whether you are a trader or an investor -- especially when this price target is confirmed by reliable indicators which give advance warning of a market top or bottom. Furthermore, cycle analysis adds the all- important time element to the above price projections. For a FREE 4-week trial, further subscription options, payment plans, and for general information, I encourage you to visit my website at www.marketurningpoints.com.
The above comments about the financial markets are based purely on what I consider to be sound technical analysis principles. They represent my own opinion and are not meant to be construed as trading or investment advice, but are offered as an analytical point of view which might be of interest to those who follow stock market cycles and technical analysis.
*********

When Andre Gratian was a stock broker years ago, a friend introduced him to technical analysis of the market. Consequently, it is not an exaggeration to say that Andre fell in love with this approach! Ever since then, it has become an increasingly important part of his professional life. Gratian has studied the works of Wyckoff, Edwards & Magee, Edward J. Dewey (cycles) and many others. However, one of my most profitable undertaking has probably been to study Point & Figure charting, which he finds invaluable in analyzing stocks and indices. If he were restricted to one methodology, this is the one that he would choose. This well-rounded background has given him what he feels to be a special insight into the stock market, facilitating the recognition of meaningful patterns and the ‘turning points’ in all trends, whether they be short or long term. Andre feels very comfortable discussing the stock market and passing on meaningful information to others. His subscribers include individuals and money managers throughout the world. Moreover, his Newsletters are currently published on several financial sites, here and abroad.
More from Gold-Eagle


