Technical Analysis Of The Markets


Current Position of the Market
SPX Long-term trend: There is some good evidence that we are still in the bull market which started in 2009, and which could continue into the first quarter of 2021 before coming to an end.
SPX Intermediate trend: New intermediate uptrend underway since 2234.
Analysis of the short-term trend is done daily with the help of hourly charts. They are important adjuncts to the analysis of daily and weekly charts which determine longer market trends.
Congestion Top Forming?
Cycles: Looking ahead! 90-yr cycle – last low: 1932. Next low: 2022
7-yr cycle – last low: 2016. Next low: 2023
Market Analysis (Charts courtesy of QCharts
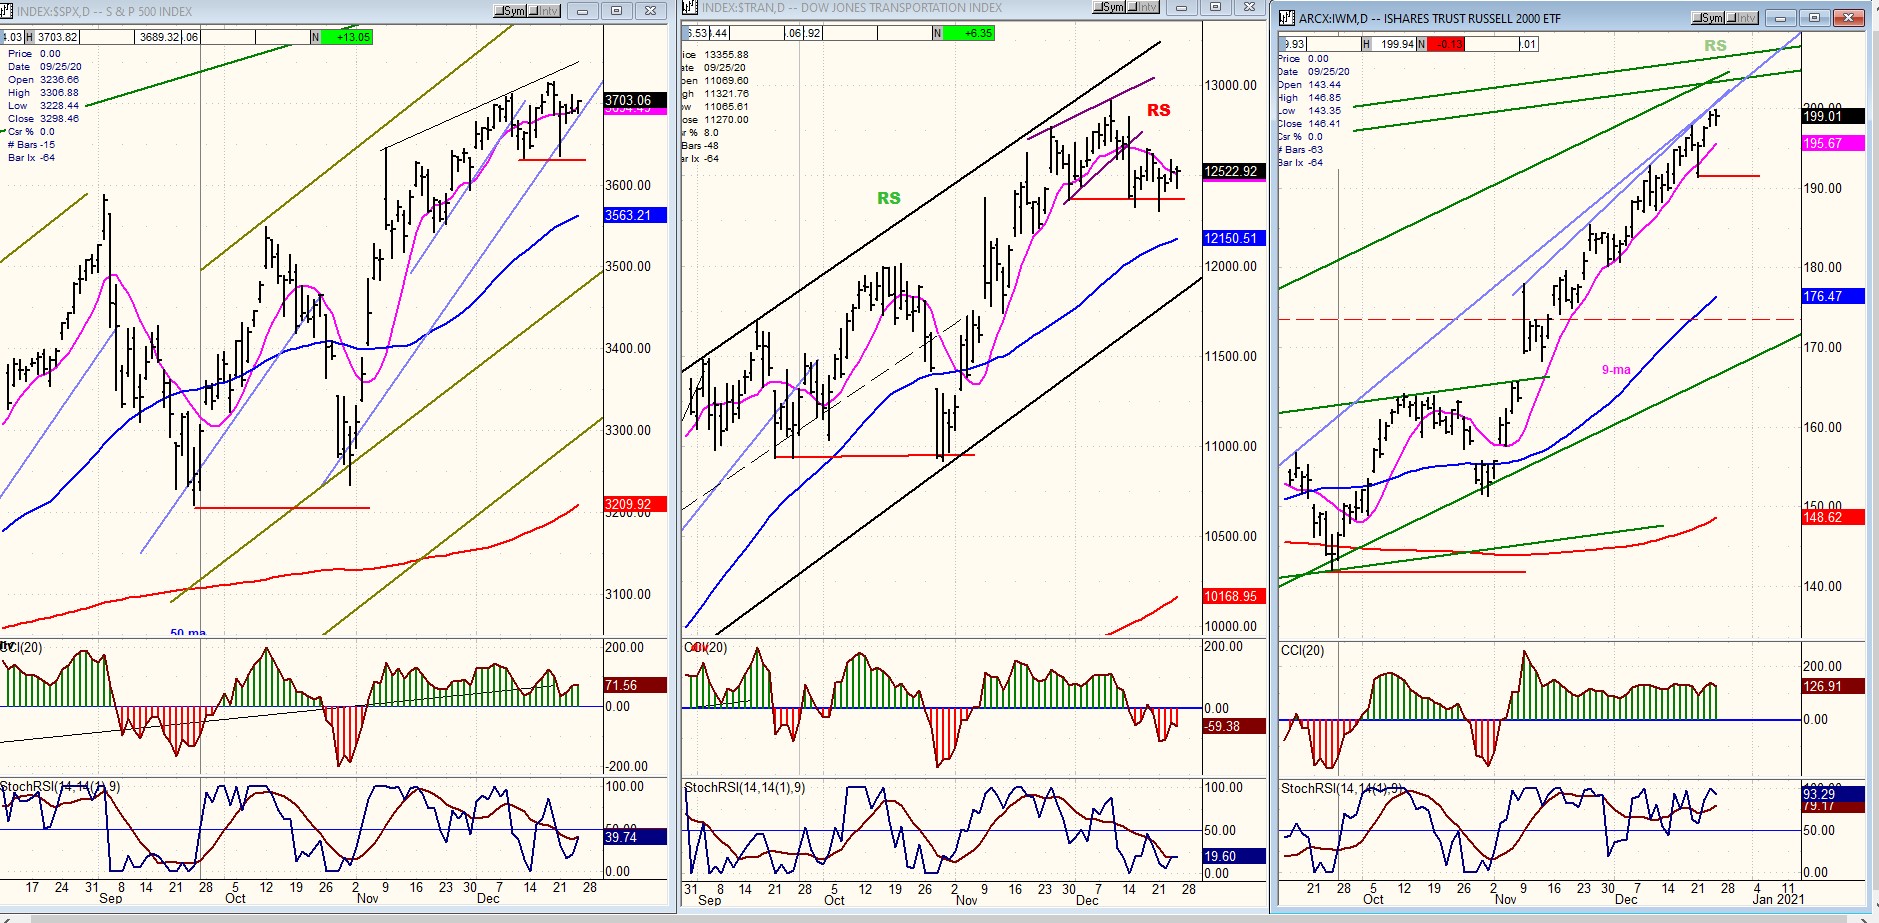
SPX-IWM weekly charts
There are two indexes which regularly give us advance warning of a market top. One is IWM and the other is TRAN. They both have an excellent track records but currently, they are out of sync with each other! TRAN is warning of an imminent top while IWM is still exhibiting relative strength to SPX. This could be because TRAN is more reflective of the DJIA’s action which has been sluggish. We’ll soon know which of the two is correct but even if we are due for a correction, worst case scenario would be an intermediate top.
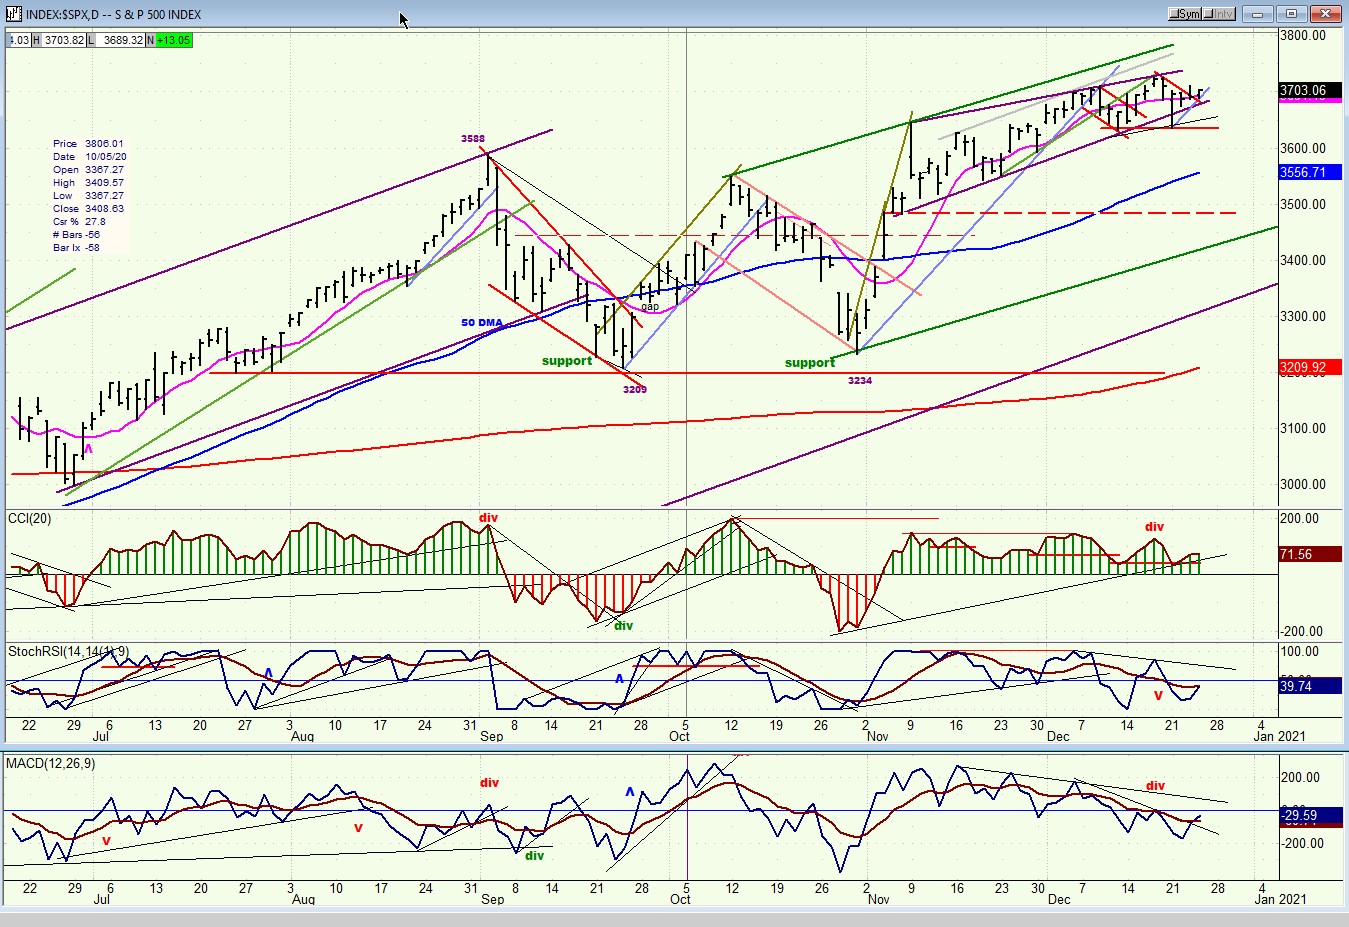
SPX daily chart
After making a new all-time high in mid-November, SPX has continued to advance, but reluctantly, forming a wedge pattern which has settled into a trading range over the past two weeks. The parameters of the diagonal are marked by the two converging heavy lines. The lower line was breached on Monday, but a rebound averted more immediate selling.
Since we are in the vicinity of a cycle which has regularly defined a top every 40 calendar days, it is unlikely that we can remain afloat much longer. If this indeed proves to be a wedge pattern, any decline starting from here could continue down to the level where the diagonal started or, in this case, 3485. This would be normal market action and the decline could be rapid – also normal market action after an ending diagonal – and it would take the index down to the dashed red line, corresponding to an exact 50% retracement of the move from 3234.
All that sounds reasonable! Perhaps too much so. Therefore, let’s keep it in the back of our minds and see what the market actually does. Enough congestion has already formed to give us a P&F count down to that level. In fact, there may be enough for a move down to 3420. This is why I don’t want to opt for anyting specific right now.
Needless to say, a move beyond 3725 would negate this entire formation, or at least delay its implication.
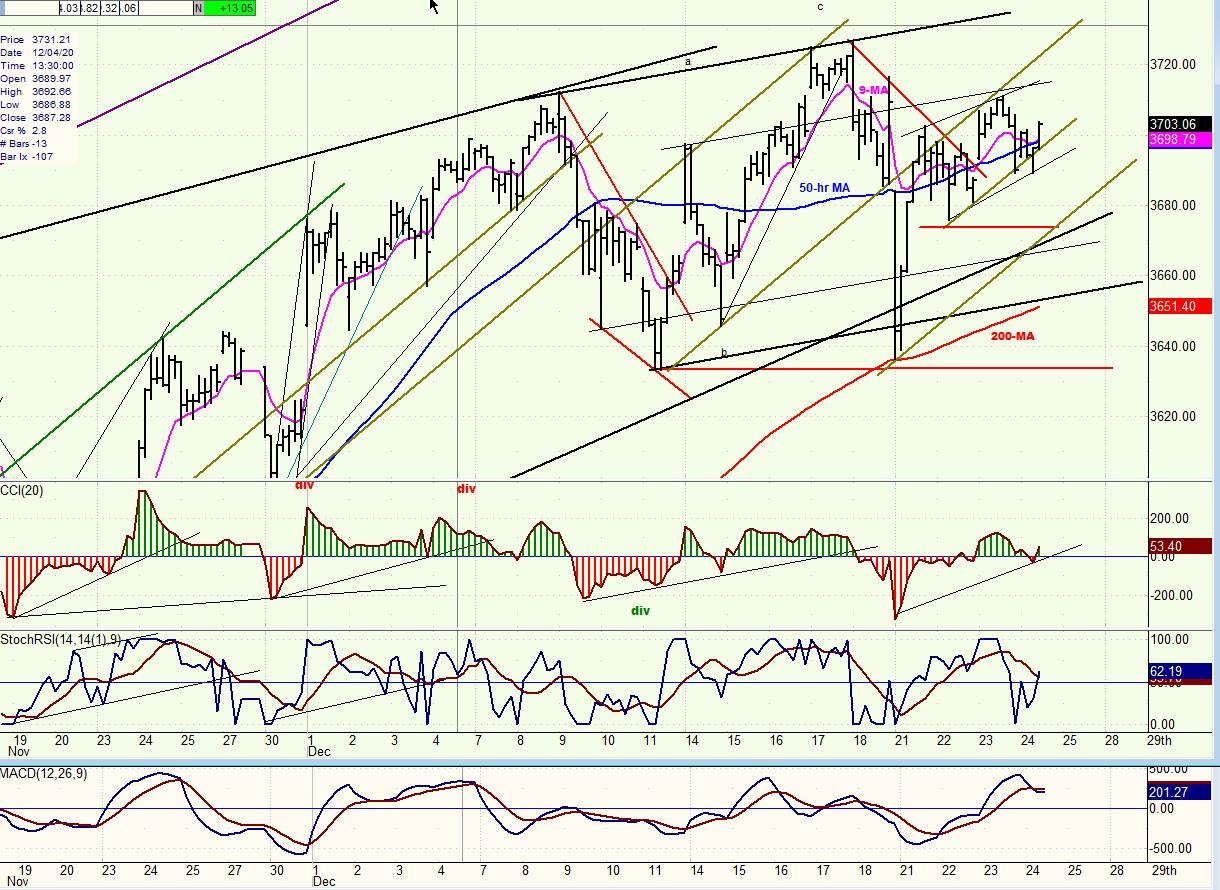
SPX hourly chart
I like to find relevant trend lines down to the micro level, and this is what I have done on the hourly chart, below. This identifies near-term patterns which can give the trader an early warning that the index is beginning to move out of a consolidation. I will simply point out a couple of them in this chart:
First, the sideways move of the past few days has brought the moving averages that I use into close-proximity, and during the last three days, SPX has been rotating in a narrow range around the 9-hr MA and 50-hr MA. About 15 points below, the 200-hr MA provided support for the last short-term low. If the index should fall below the 200-MA, it would undoubtedly mark the start of the anticipated correction. A warning would come sooner if the index broke below the trend line cluster coalescing around 3670. At the same time, the three oscillators would most likely go negative, suggesting that a sell signal had been given. A confirmation would follow with a move below 3630.
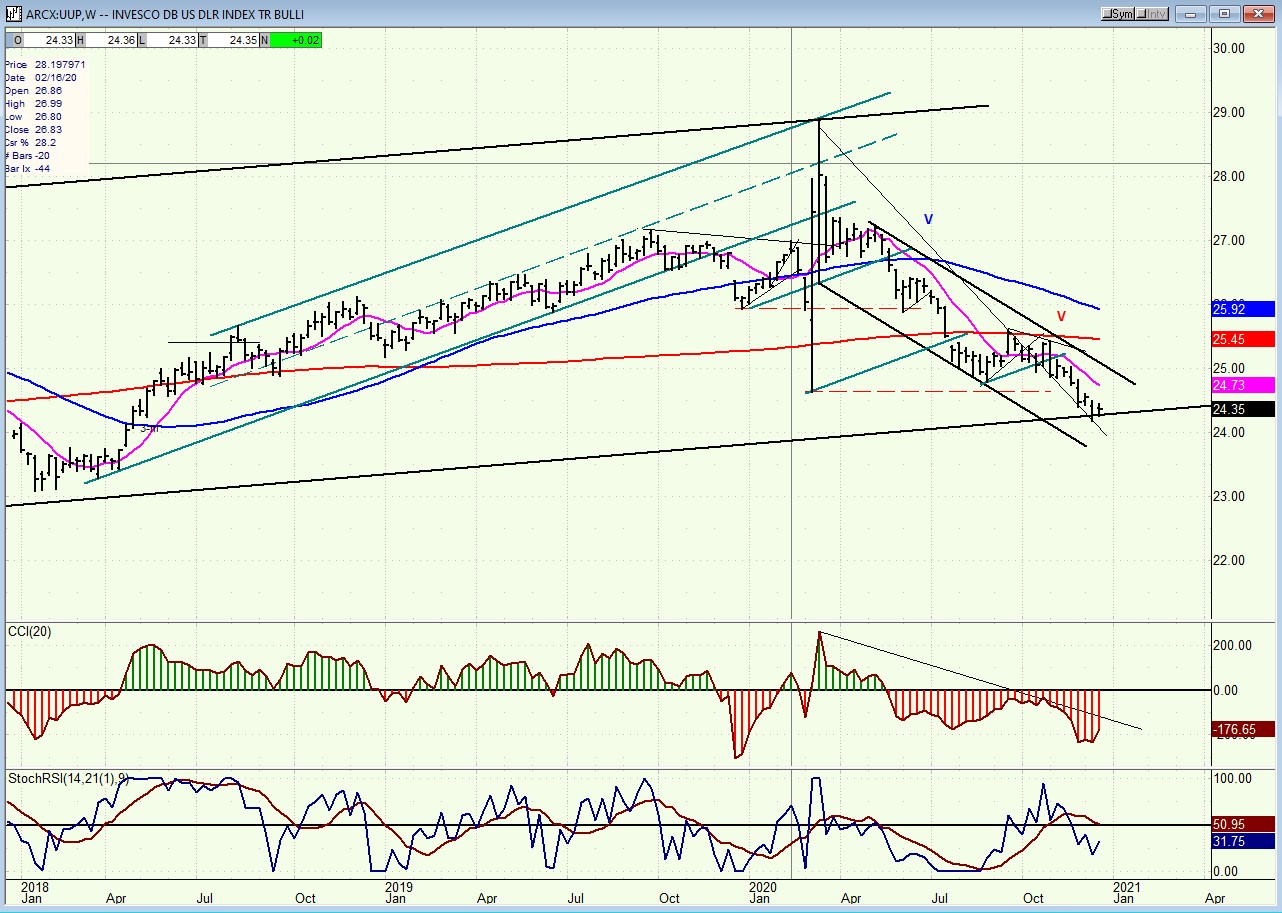
UUP (dollar ETF) WKLY ($USD chart not available from this data provider)
UUP has found temporary support on its long-term channel line and held for the past week. It does not show on the weekly chart, but the daily chart oscillators may be about to give a buy signal, which would suggest that UUP could rebound from this level.
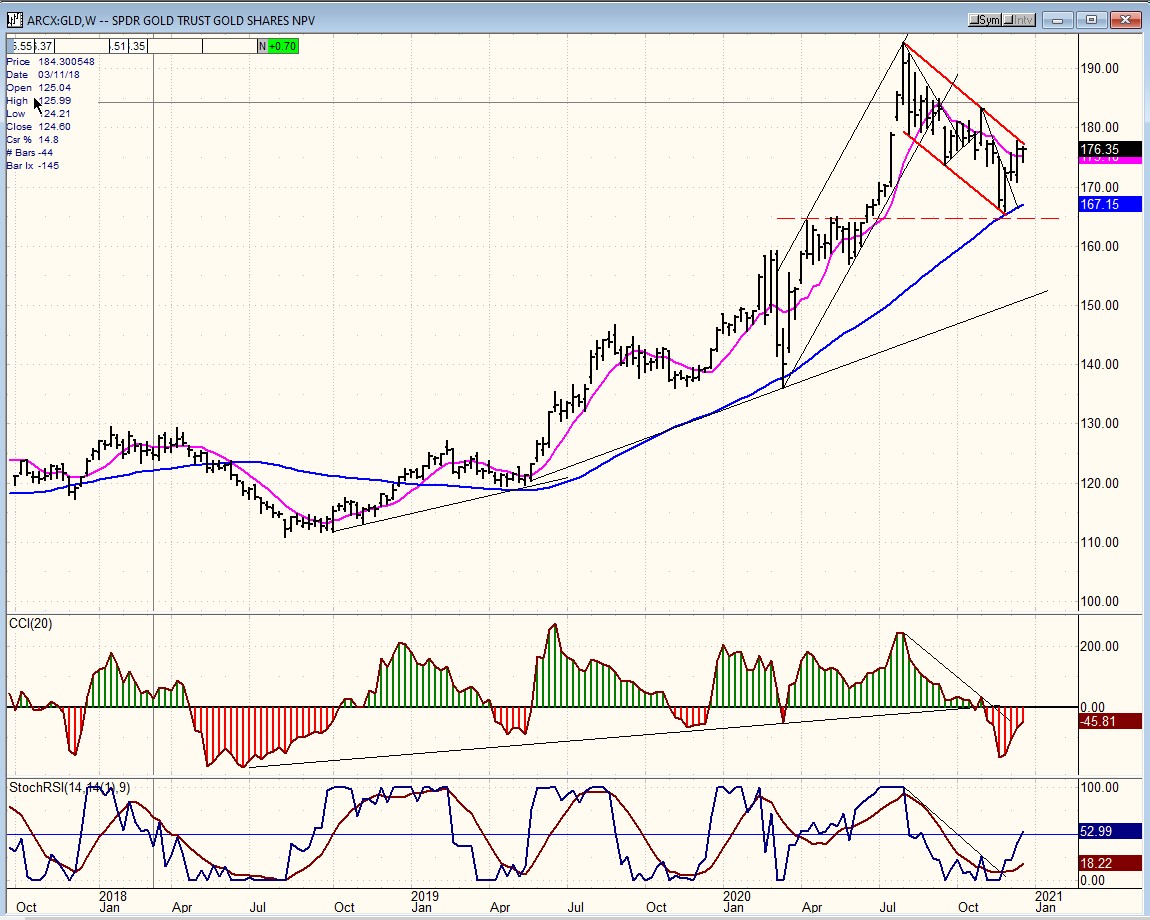
GLD (gold)-WKLY
GLD has rallied across the width of its consolidation channel but does not look willing to push through right away. This means that more consolidation is needed before it resumes its uptrend.
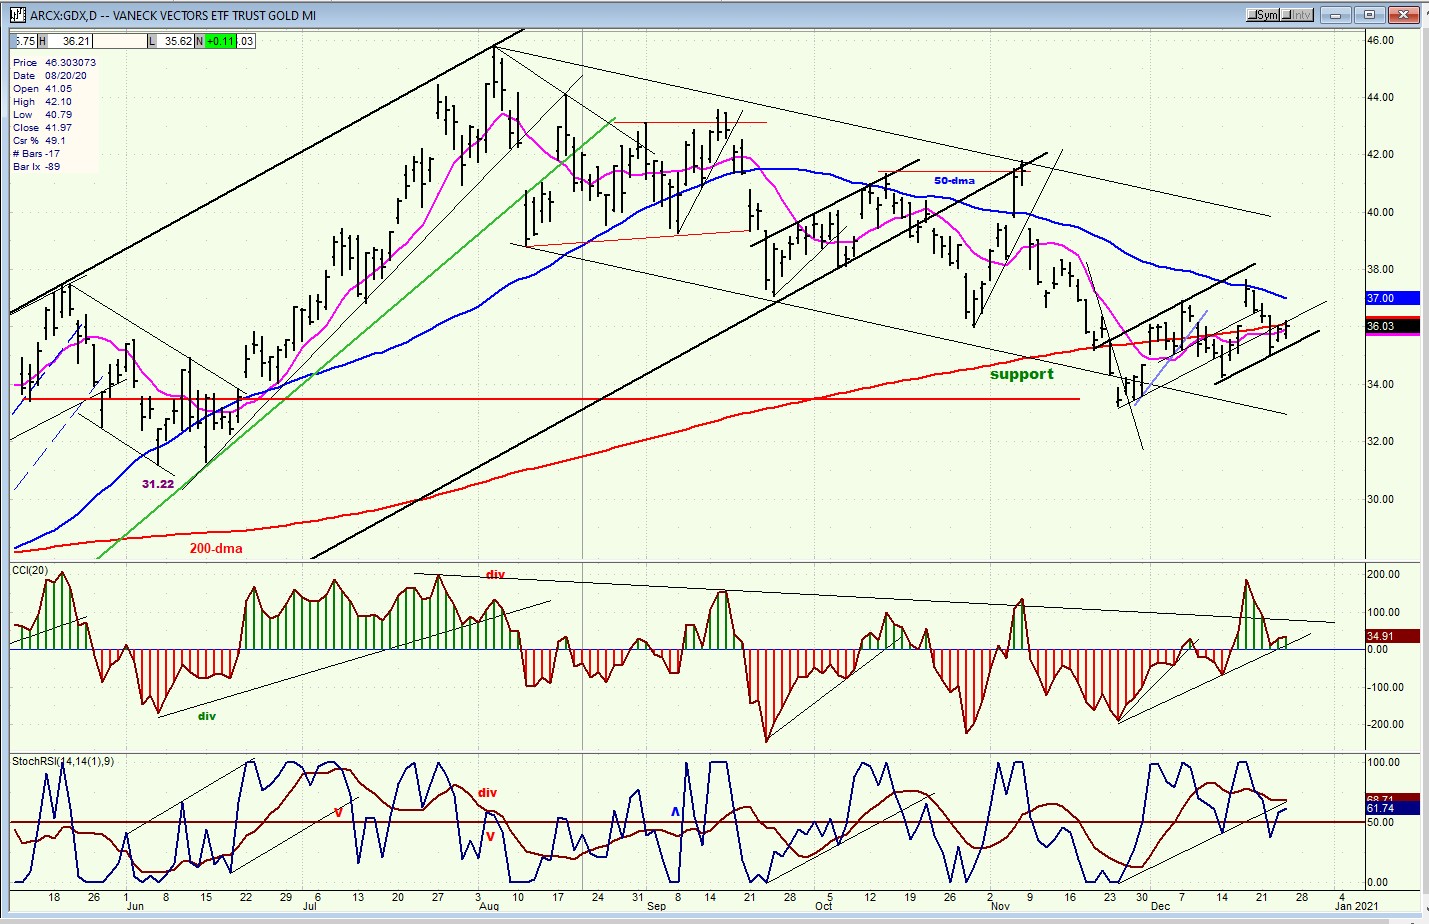
GDX (gold miners)-DLY
GDX is also hesitating after a bounce from its low. Until it has a clear break-out above its 50-dma, it should continue to consolidate.
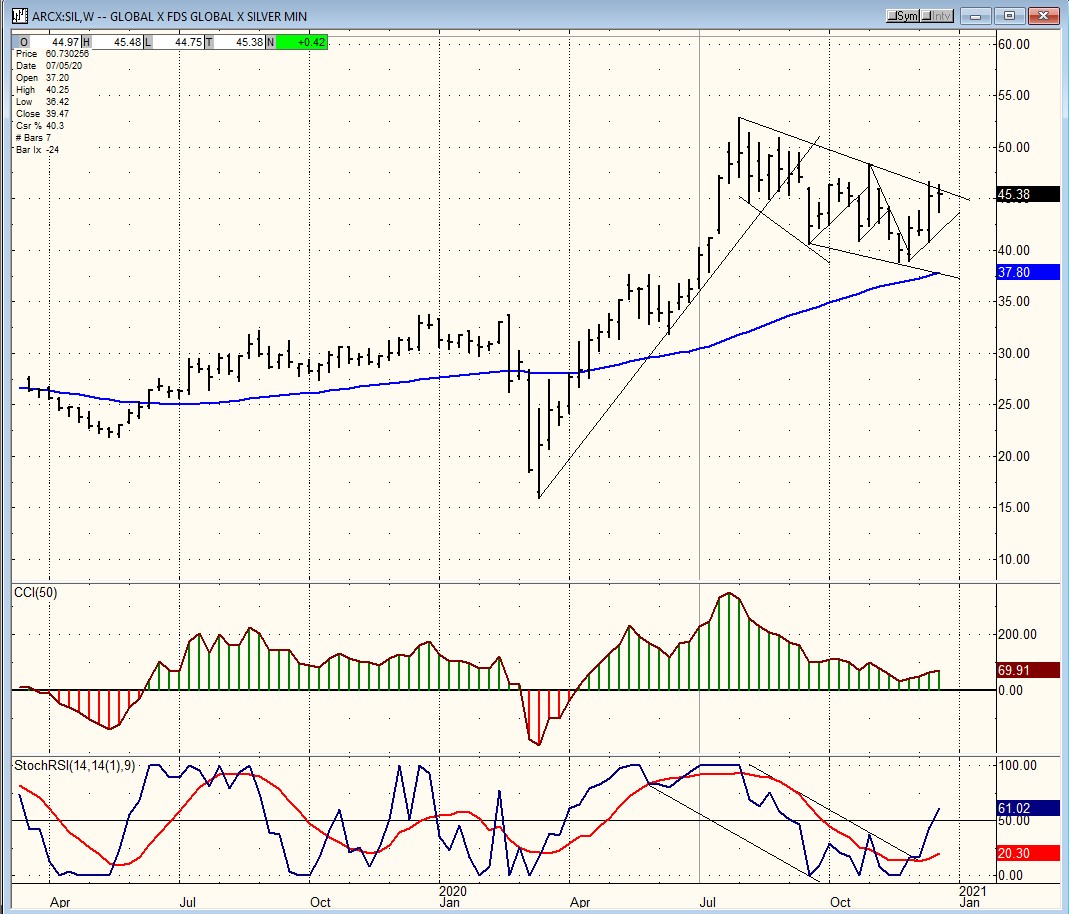
SIL (silver)-WKLY
Like GLD, SIL rebounded and stopped at the top of its correction channel. It will probably need more consolidation before moving out of it to resume its uptrend.
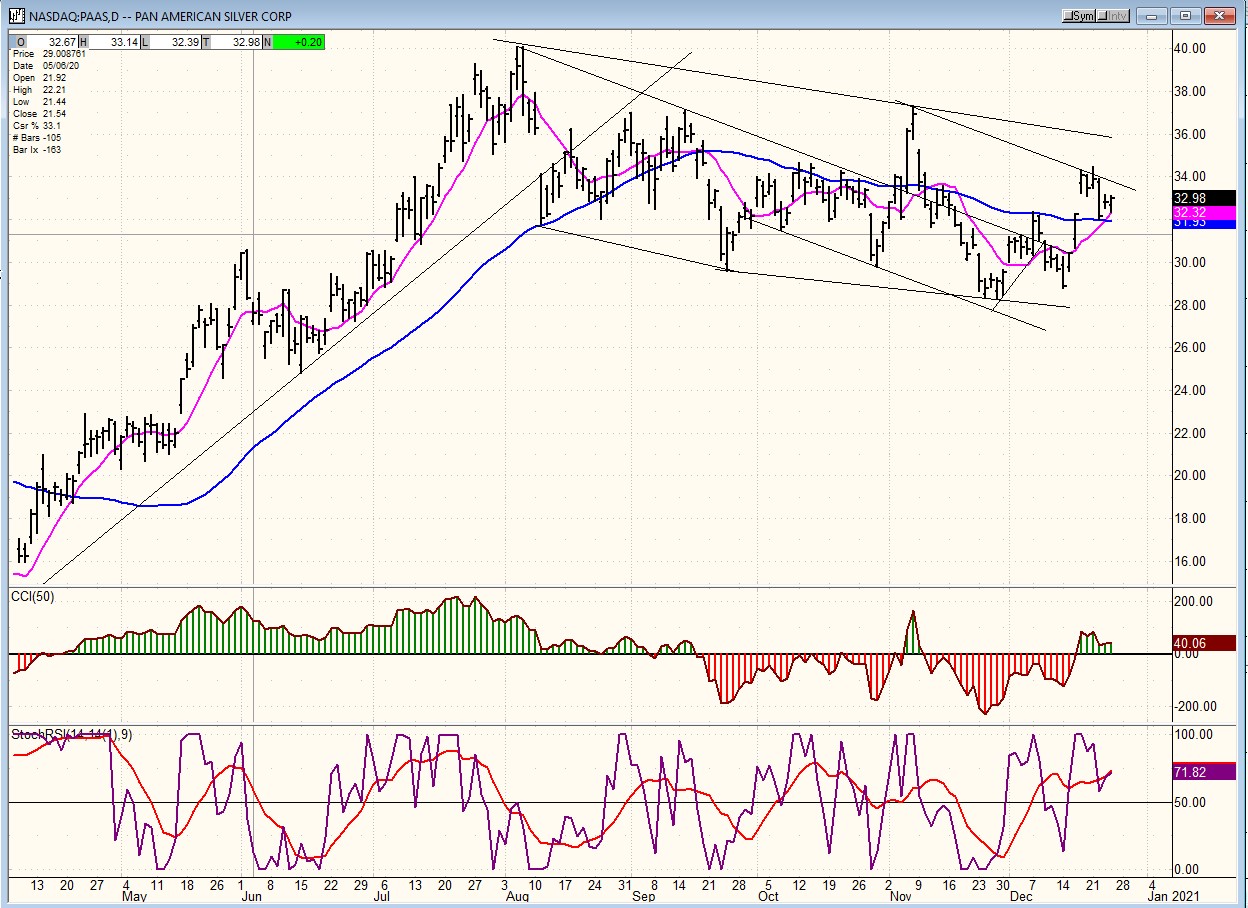
PAAS (Pan American Silver Corp-DLY)
PAAS may have gone as far as it can for now and will need more consolidation, especially if there is a retracement in stock prices.
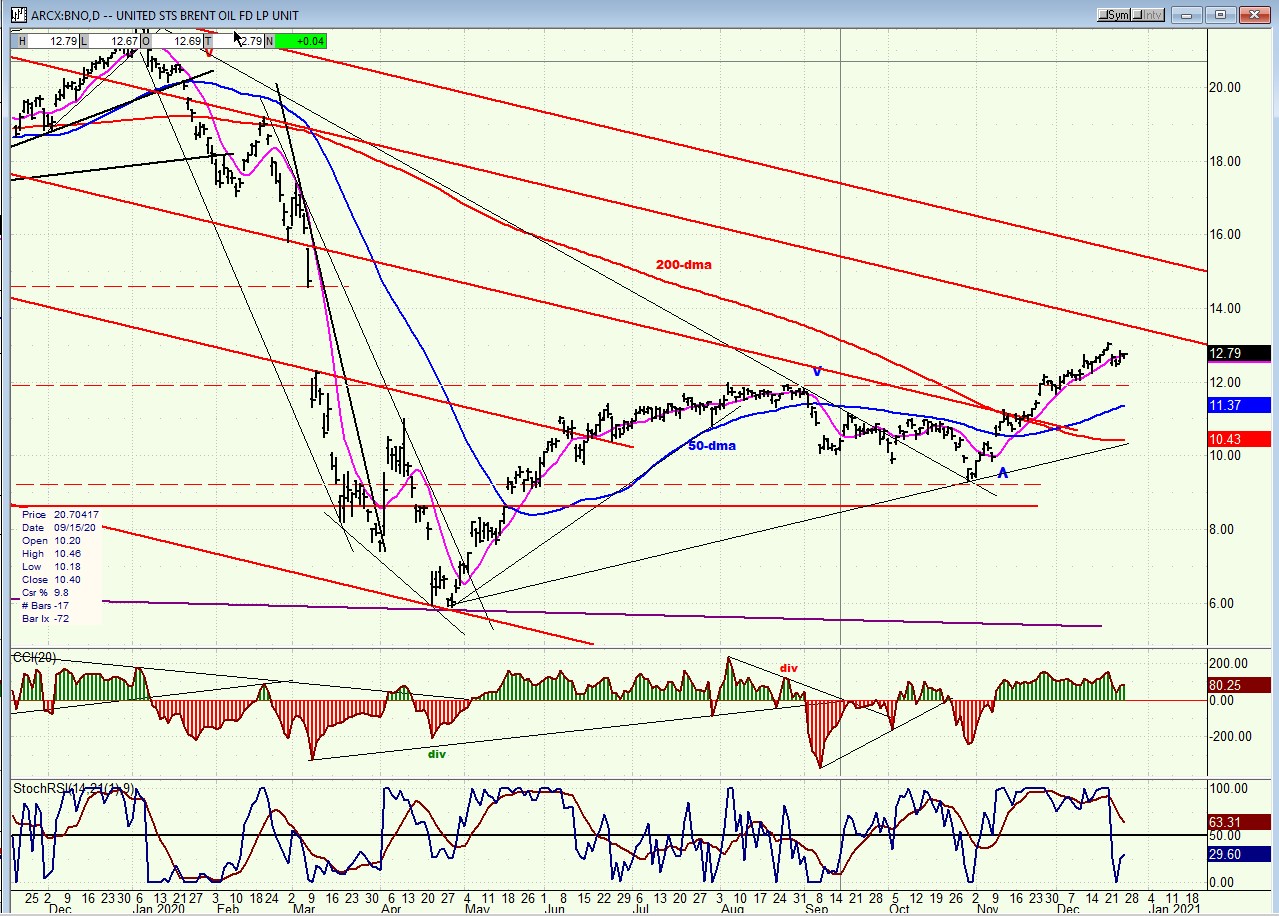
BNO (U.S. Brent Oil fund)
BNO has started a small consolidation pattern which could extend down to the dashed line support before it can continue its uptrend. The short-term projection remains 14+.
SUMMARY
SPX has now built a significant congestion pattern at its recent high which is more likely to be short-term distribution than re-accumulation. It should not take too long before we find out which it is.
Andre
You may view our website at https://marketurningpoints.com
Free trial subscription
With a trial subscription, you will have access to the same information that is given to paid subscribers, but for a limited time-period. Over the years, I have developed an expertise in P&F charting (price projection), cycles (timing), EWT (structure), and general technical analysis which enables me to warn subscribers of pending reversals in market trends and how far that trend can potentially carry. For a FREE 2-week trial, subscription options and payment plans, I encourage you to visit my website at https://marketurningpoints.com
The above comments and those made in the daily updates and the Market Summary about the financial markets are based purely on what I consider to be sound technical analysis principles. They represent my own opinion and are not meant to be construed as trading or investment advice but are offered as an analytical point of view which might be of interest to those who follow stock market cycles and technical analysis.

When Andre Gratian was a stock broker years ago, a friend introduced him to technical analysis of the market. Consequently, it is not an exaggeration to say that Andre fell in love with this approach! Ever since then, it has become an increasingly important part of his professional life. Gratian has studied the works of Wyckoff, Edwards & Magee, Edward J. Dewey (cycles) and many others. However, one of my most profitable undertaking has probably been to study Point & Figure charting, which he finds invaluable in analyzing stocks and indices. If he were restricted to one methodology, this is the one that he would choose. This well-rounded background has given him what he feels to be a special insight into the stock market, facilitating the recognition of meaningful patterns and the ‘turning points’ in all trends, whether they be short or long term. Andre feels very comfortable discussing the stock market and passing on meaningful information to others. His subscribers include individuals and money managers throughout the world. Moreover, his Newsletters are currently published on several financial sites, here and abroad.


