Technical Analysis Of The Markets


Current Position of the Market
SPX Long-term trend: There is some evidence that we are still in the bull market which started in 2009 and which could continue into the first half of 2021 before major cycles take over and it comes to an end..
SPX Intermediate trend: SPX may have completed a phase of its intermediate uptrend and is consolidating
Analysis of the short-term trend is done daily with the help of hourly charts. They are important adjuncts to the analysis of daily and weekly charts which determine longer market trends.
Is the Uptrend Already Resuming?
Cycles: Looking ahead!
90-yr cycle – Last lows: 1843-1933. Next low: ~2023
40-yr cycle -- Last lows: 1942 -1982. Next low: ~2022
7-yr cycle – Last lows: 2009-2016. Next low: ~2023
Market Analysis (Charts, courtesy of QCharts)
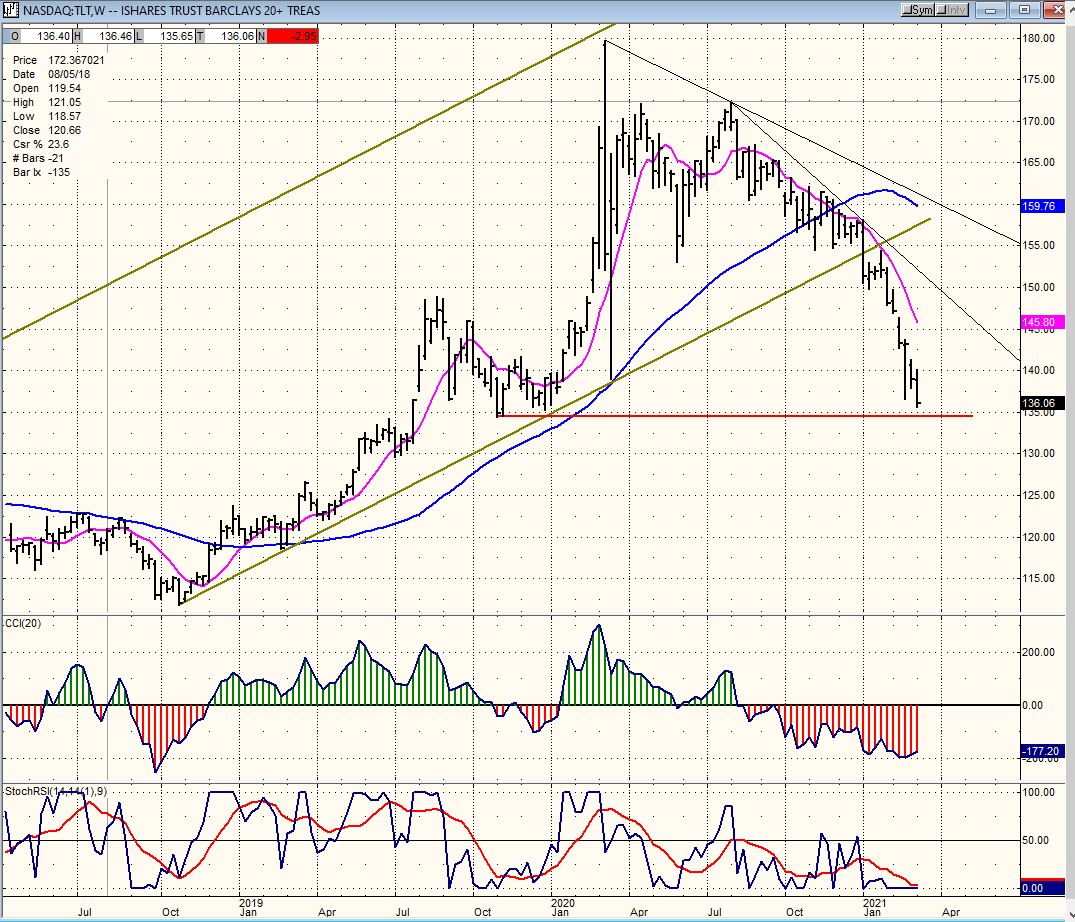
TLT (weekly)
TLT is the Ishare of the 20-year treasury bond ETF. Below is its weekly chart which shows that last week it traded at its lowest level since March/April of 2020. Conversely, its yield rose to the highest point since that date. It is also obvious that it is close to breaking a support level and could, over time, go on to challenge lower support levels which are, admittedly, much lower.
Rising yields equal rising inflation. At this point, it is very subdued, but a continued increase could begin to affect the market. Large tech growth stocks are particularly vulnerable to rising yields and the decline in the 20-year bond is probably the reason why the NDX has been relatively weak lately. We will also see if the move in TLT was enough to kick-start the languishing metals.
Last week, I mentioned that some important stock market cycles lie ahead. At some point they will affect the market, along with rising yields if this trend continues. But we are not there yet, and projections based on the congestion made at the March low suggest that SPX could rise about 400 more points before we should become concerned that the index has reached a major top. It is important to be aware, however, that the 12-year bull market is in the final months of its trend and that we should begin adjusting our thinking to that fact.
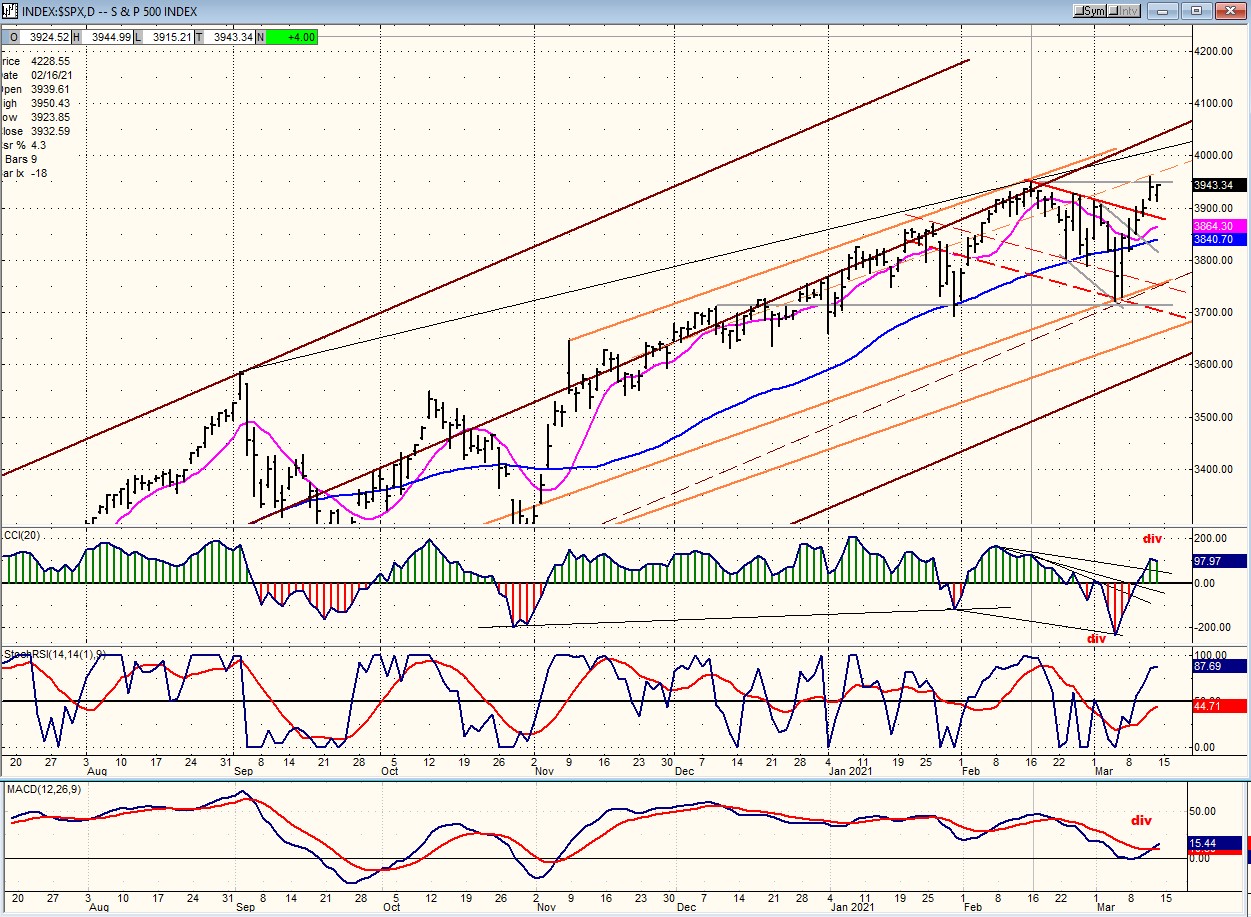
SPX daily chart
I had been looking for an intermediate correction in this time frame and, after reassessing the projection for a high, I came up with 3950-4030. Since we have already touched 3950, corrected down to 3730, and made a slightly new high to 3960 before meeting resistance, the next few days will serve to evaluate if we are ready to move higher right away or if more correction is first needed.
After touching 3950, SPX retraced 220 points, found support at former short-term highs, and rallied slightly past the former high without consolidating along the way. This action could have been fueled by the passage of a new relief bill, but it also filled near-term objectives of 3960-3990. The question is now: did we simply complete a b-wave (in other words only one half of the correction), or are we ready to move immediately to new highs? By Thursday, it was obvious that we could go no farther and needed to pull back. Friday was essentially a holding session, and we will have to wait until Monday to see the likely near-term future course of the index.
So far, the oscillators are not really confirming the move. While the index reached ten points higher on the rally, they all fell short of their former highs with the A-Ds showing the worst case of negative divergence. So, a retracement of sorts appears to be in order. It will simply be a matter of how much.
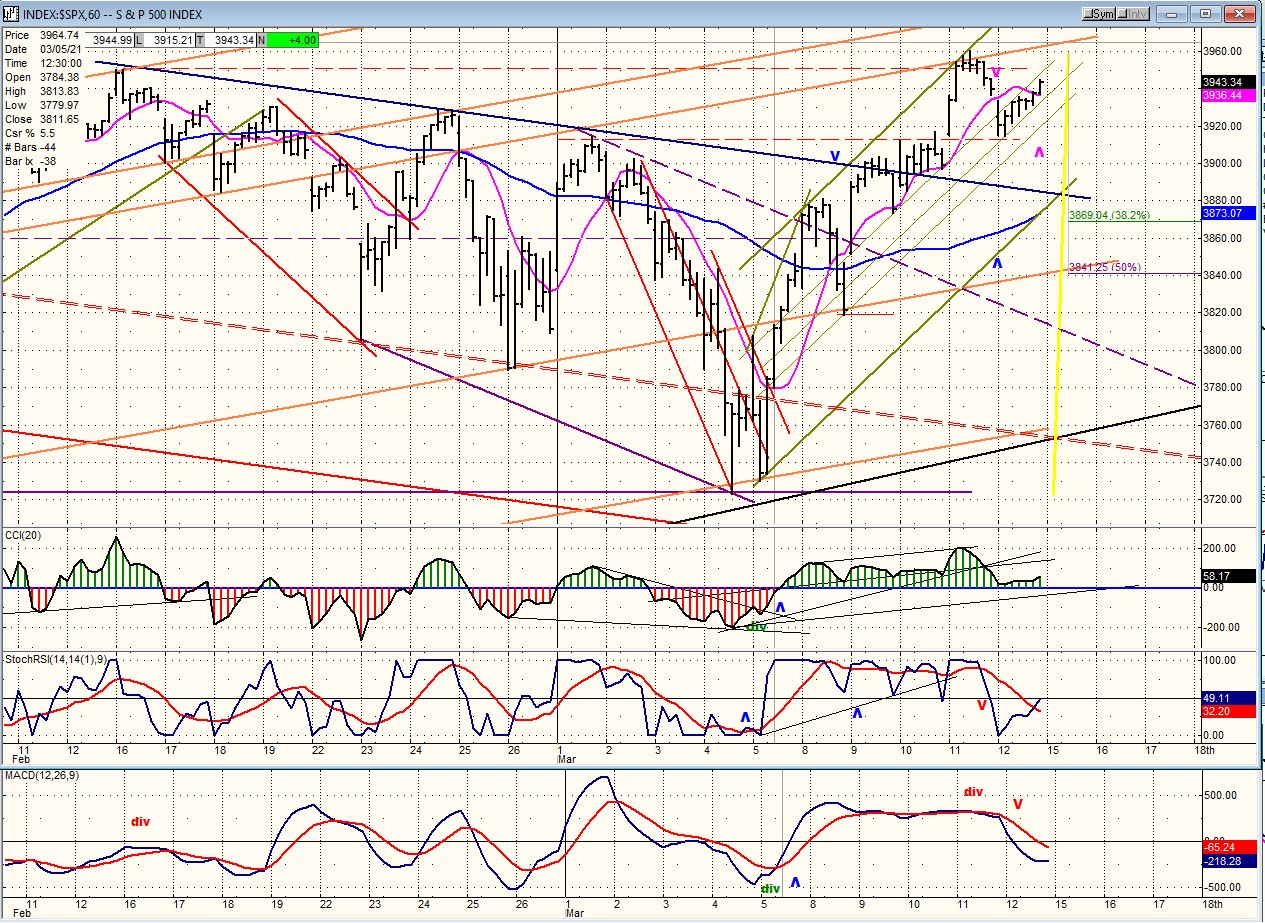
SPX hourly chart
The loss of momentum on a near-term basis shows up better on the hourly chart. SPX has moved in a short-term up-channel while adhering to the top channel line. In the last couple of days, it started to correct toward the mid-channel line where it found support on Friday and bounced. It also held at the top of the 3/1 top. The bounce is not all that energetic, and that means that it looks like we are making a little b-wave and need to pull-back lower, perhaps to the blue trend line, which would also correspond to the lower green channel line where we could find support for our next attempt at resuming the uptrend.
There is no distribution to speak of at this time, so we should not expect too much of a pullback. What will really define where we are in the uptrend is what comes after the next pullback. If we cannot exceed Thursday’s high and roll-over, we will have created more distribution and will most likely come out of the green rising channel. A pull-back would also find support on the blue 50-hr MA. Breaking below the MA would also put the index out of its channel, and then we would have to see if the orange parallel support line holds (50% retracement) or if we need to pullback all the way down to one of the dashed lines before finding support (look at daily chart for added perspective).
The oscillators strongly suggest that we need to have at least one more retracement before attempting to resume the uptrend.
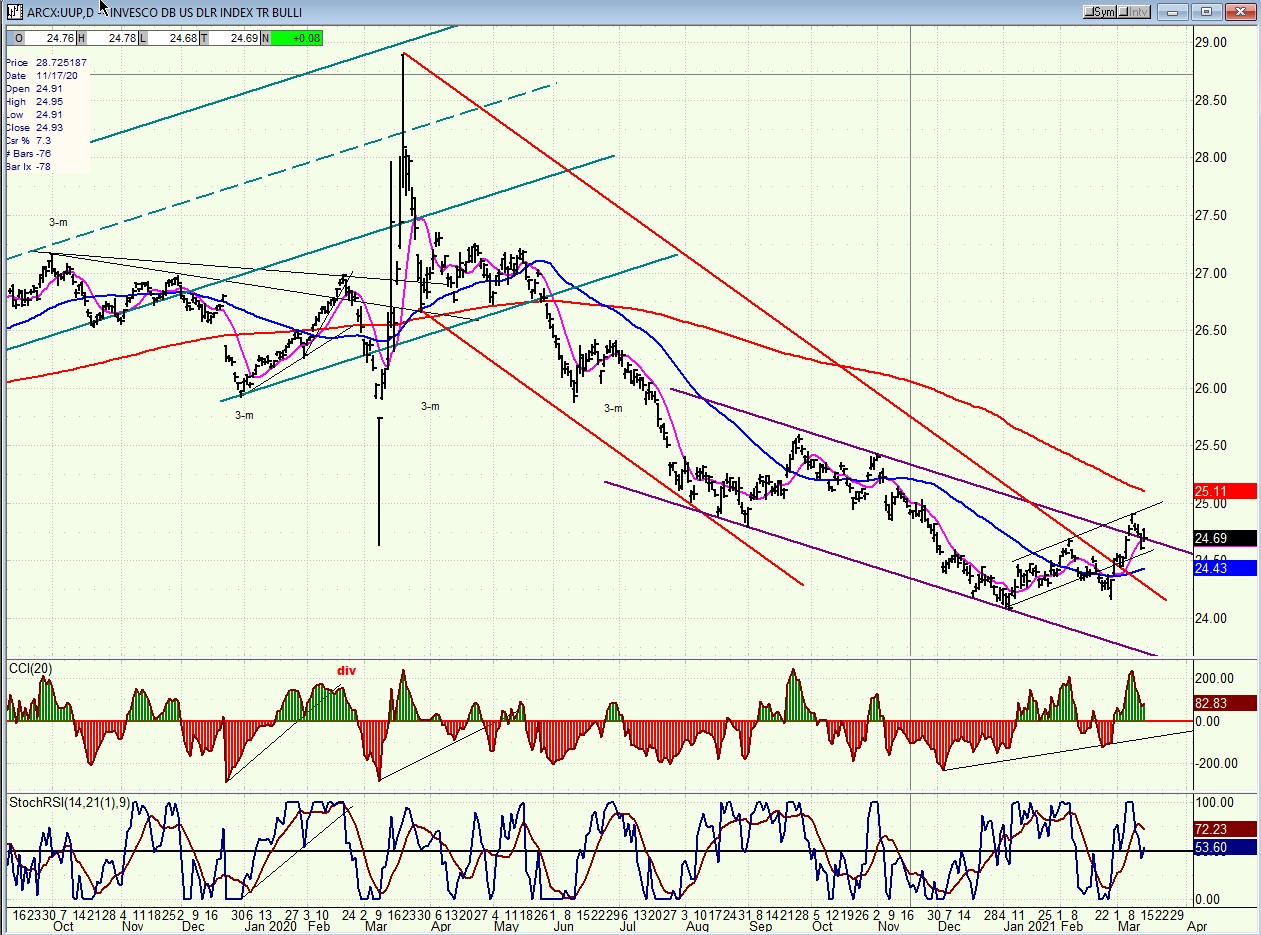
UUP (dollar ETF) DLY ($USD chart is not available from this data provider)
UUP has pulled back from last week’s high after finding resistance at the top of the minor rising channel line, but it remains in a short-term uptrend. If it cannot follow through on the upside and falls back into the purple deceleration channel, it may risk continuing its downtrend; but for now, the CCI remains positive, so we need to wait a little while longer to see if it can continue higher toward the 200-dma.
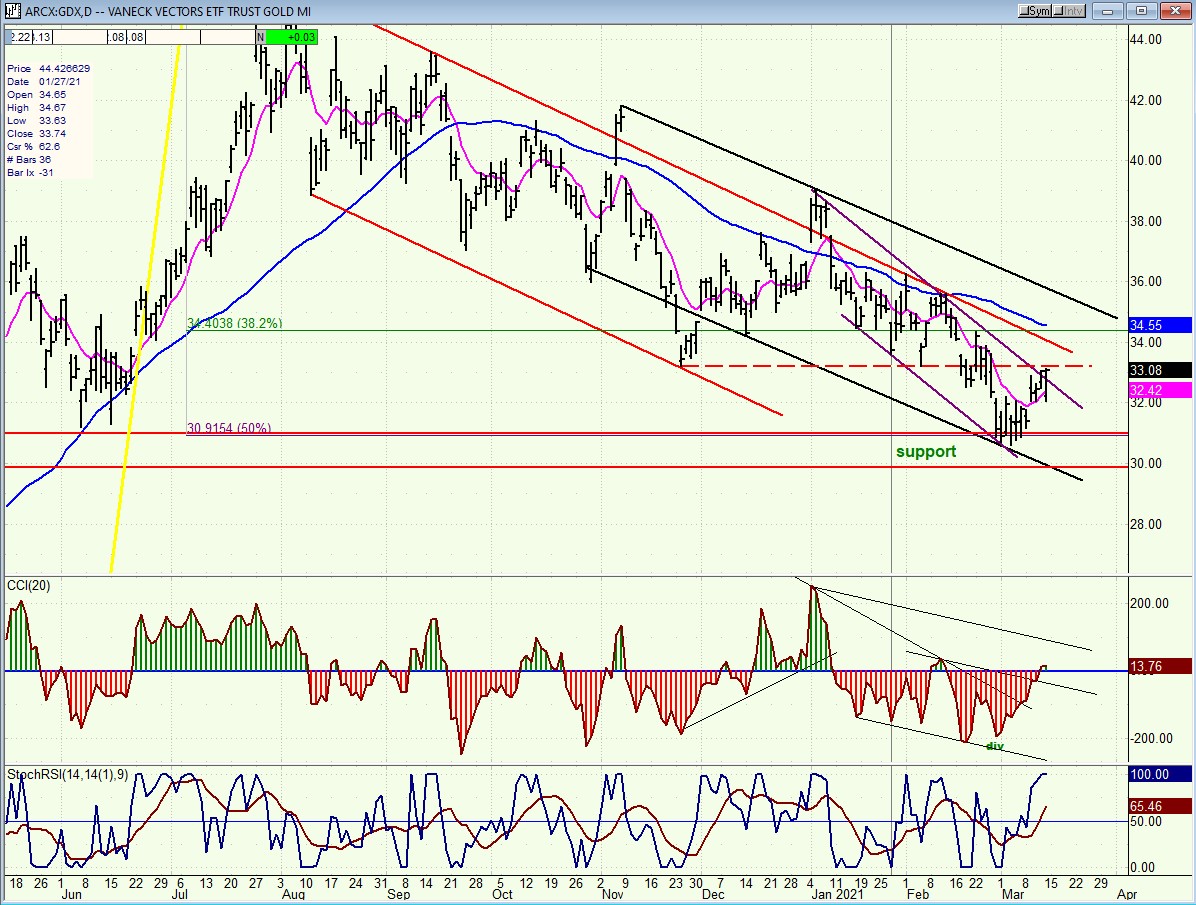
GDX (gold miners)-DLY
After a 50% retracement of its uptrend which took 7 months to complete, GDX tested a strong support level which held and caused a bounce. It is currently trying to extend that bounce and come out of its last minor correction channel (within the larger channel) and managed to close slightly outside of it on Friday. It is questionable if it will be able to make much headway right away since the CCI has not yet turned positive and price is already meeting resistance.
If it can push higher right away, it should be able to reach 35-35.50 before retracing and retesting its low.
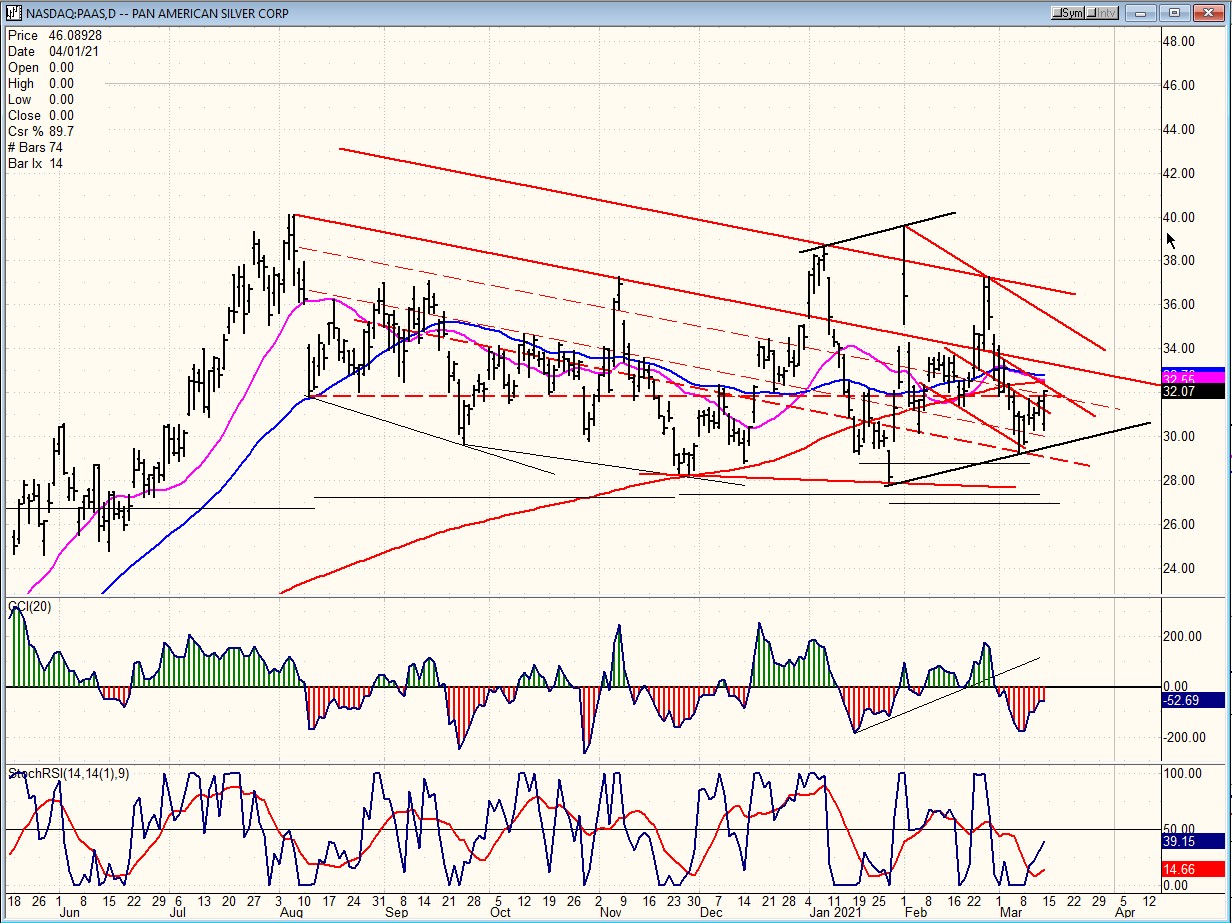
PAAS (Pan American Silver Corp-DLY)
PAAS tends to do what GDX does and it, too, is trying to move out of a minor channel. Its chart pattern is more positive than GDX as far as the entire correction is concerned (since it appears to have made its final low earlier) but its oscillators are weaker and still shy of giving a buy signal. PAAS will also have to get above its 9-dma and 50-dma before giving a short-term buy signal.
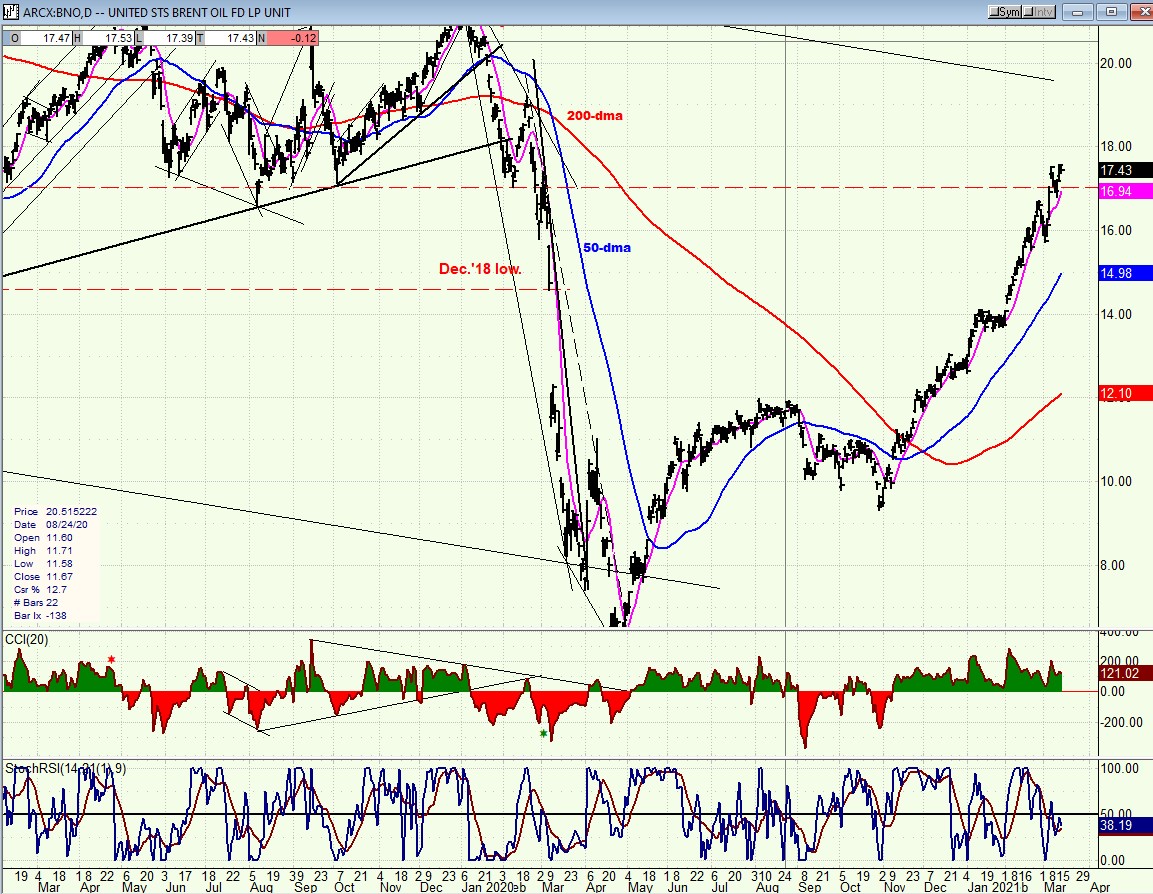
BNO (Brent oil fund) DLY.
BNO is still strong but a little profit taking is appearing as it runs into resistance. Nothing serious yet, but this could increase if it tries to move higher before consolidating. Also, the indicators are showing negative divergence and weakening.
SUMMARY
It is not clear if SPX has completed its deepest correction since the intermediate low, or only half of it. The next few days will clarify. Either way, a pullback is likely due.
Free trial subscription
With a trial subscription, you will have access to the same information that is given to paid subscribers, but for a limited time-period. Over the years, I have developed an expertise in P&F charting (price projection), cycles (timing), EWT (structure), and general technical analysis which enables me to warn subscribers of pending reversals in market trends and how far that trend can potentially carry. For a FREE 2-week trial, subscription options and payment plans, I encourage you to visit my website at www.marketurningpoints.com.
The above comments and those made in the daily updates and the Market Summary about the financial markets are based purely on what I consider to be sound technical analysis principles. They represent my own opinion and are not meant to be construed as trading or investment advice but are offered as an analytical point of view which might be of interest to those who follow stock market cycles and technical analysis.
********

When Andre Gratian was a stock broker years ago, a friend introduced him to technical analysis of the market. Consequently, it is not an exaggeration to say that Andre fell in love with this approach! Ever since then, it has become an increasingly important part of his professional life. Gratian has studied the works of Wyckoff, Edwards & Magee, Edward J. Dewey (cycles) and many others. However, one of my most profitable undertaking has probably been to study Point & Figure charting, which he finds invaluable in analyzing stocks and indices. If he were restricted to one methodology, this is the one that he would choose. This well-rounded background has given him what he feels to be a special insight into the stock market, facilitating the recognition of meaningful patterns and the ‘turning points’ in all trends, whether they be short or long term. Andre feels very comfortable discussing the stock market and passing on meaningful information to others. His subscribers include individuals and money managers throughout the world. Moreover, his Newsletters are currently published on several financial sites, here and abroad.
More from Gold-Eagle


