Technical Analysis Of The Markets


Current Position of the Market
SPX Long-term trend: There is some evidence that we are still in the bull market which started in 2009 and which could continue into the first half of 2021 before major cycles take over and it comes to an end.
SPX Intermediate trend: SPX is in the next phase of its intermediate uptrend.
Analysis of the short-term trend is done daily with the help of hourly charts. They are important adjuncts to the analysis of daily and weekly charts which determine longer market trends.
Minor Correction Due
Cycles: Looking ahead!
90-yr cycle – Last lows: 1843-1933. Next low: ~2023
40-yr cycle -- Last lows: 1942 -1982. Next low: ~2022
7-yr cycle – Last lows: 2009-2016. Next low: ~2023
Market Analysis (Charts, courtesy of QCharts)
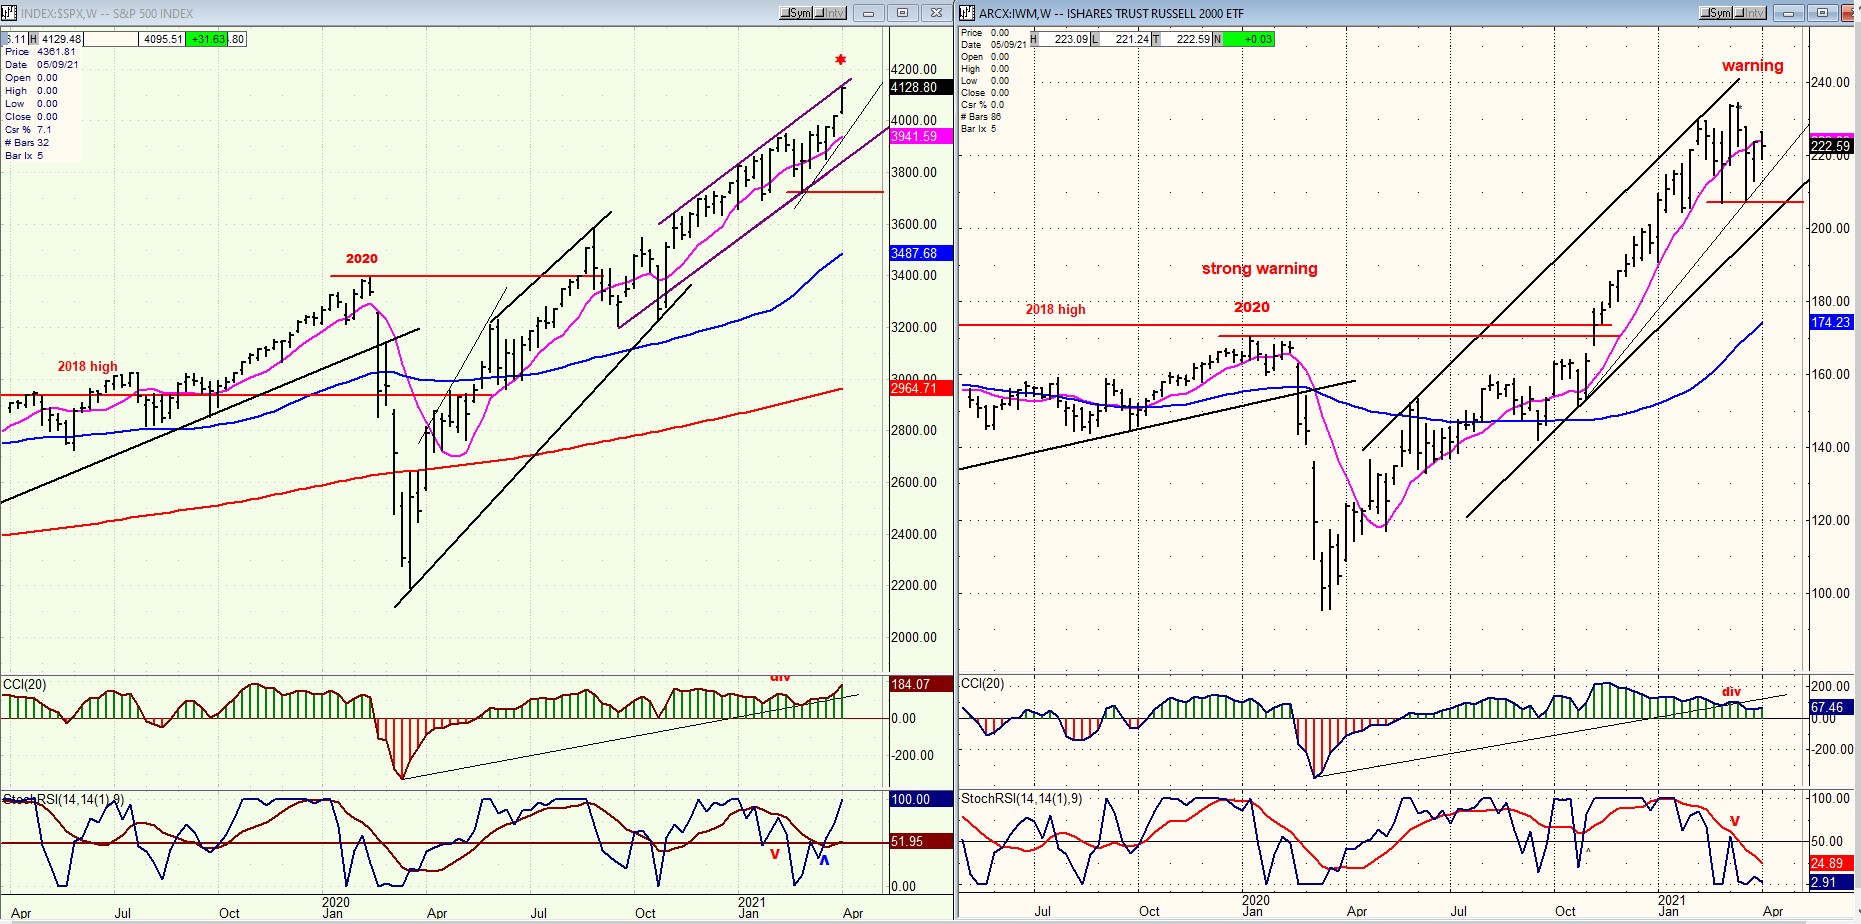
SPX vs. IWM (weekly)
IWM has a dependable history of topping ahead of the SPX. This is taking place again today with IWM peaking on 3/15 and correcting ever since. It may only be alerting us to an intermediate top in SPX which could bring about a two/three-week correction before it undertakes another phase toward a more important top.
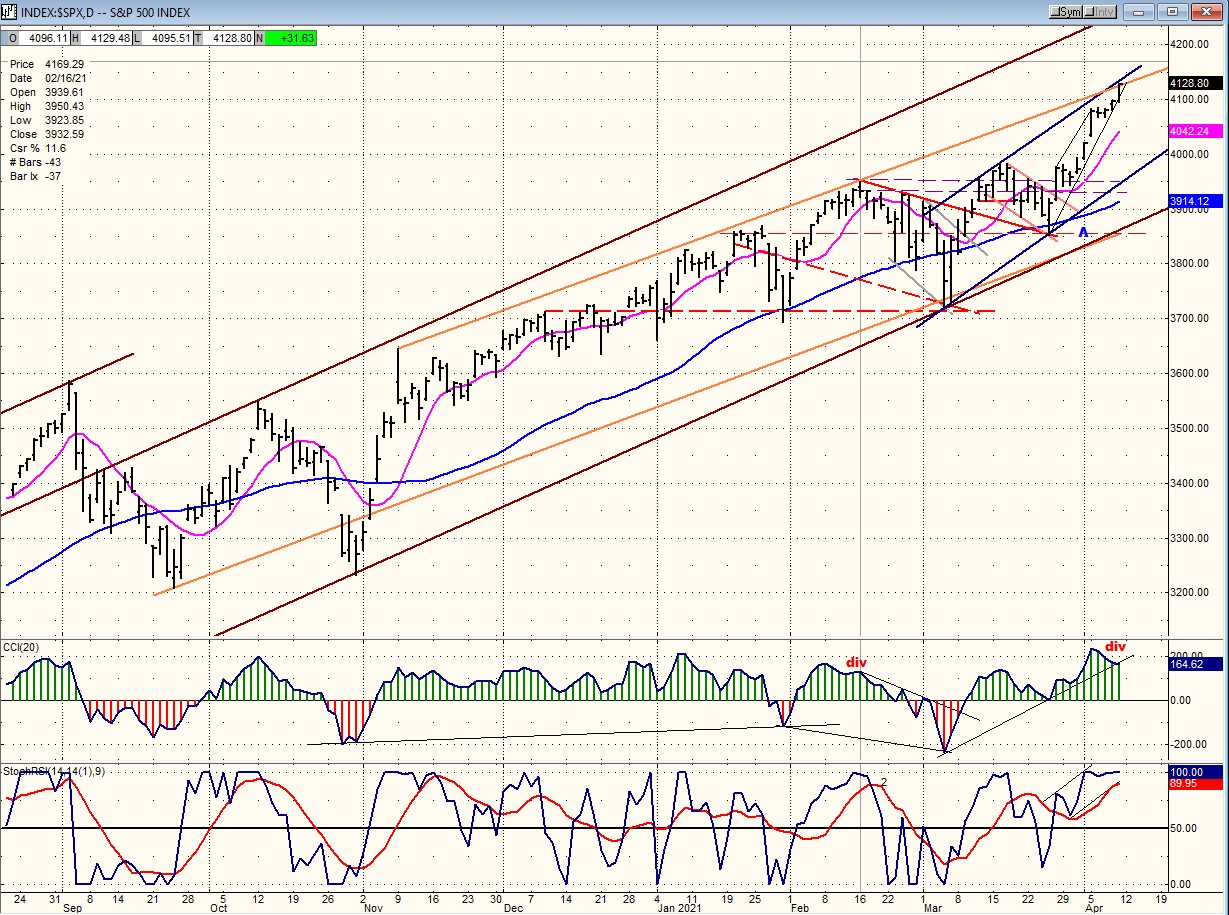
SPX daily chart
On Friday, SPX reached the top of the channels that I had drawn on the chart the week before: a small dark-blue channel from 3723, and the orange intermediate channel, the top line of which started from 3646. These were expected to create some resistance for the move from 3853 which had a partial projection target of about 4100. But Friday’s action indicated that 4130-35 could be reached before a minor consolidation takes place and is followed by a move to about 4180 to complete the current phase. After a 2 to 3-week correction, we could then start on the final bullish trend from 3723 to about 4350, from which a larger correction would be expected.
In the comments that I made above about IWM, I suggested that the latter was warning of an SPX top. That would probably be the end of the move expected to come around 4180-4200. That warning is also appearing in the daily CCI (below) in the form of negative divergence.
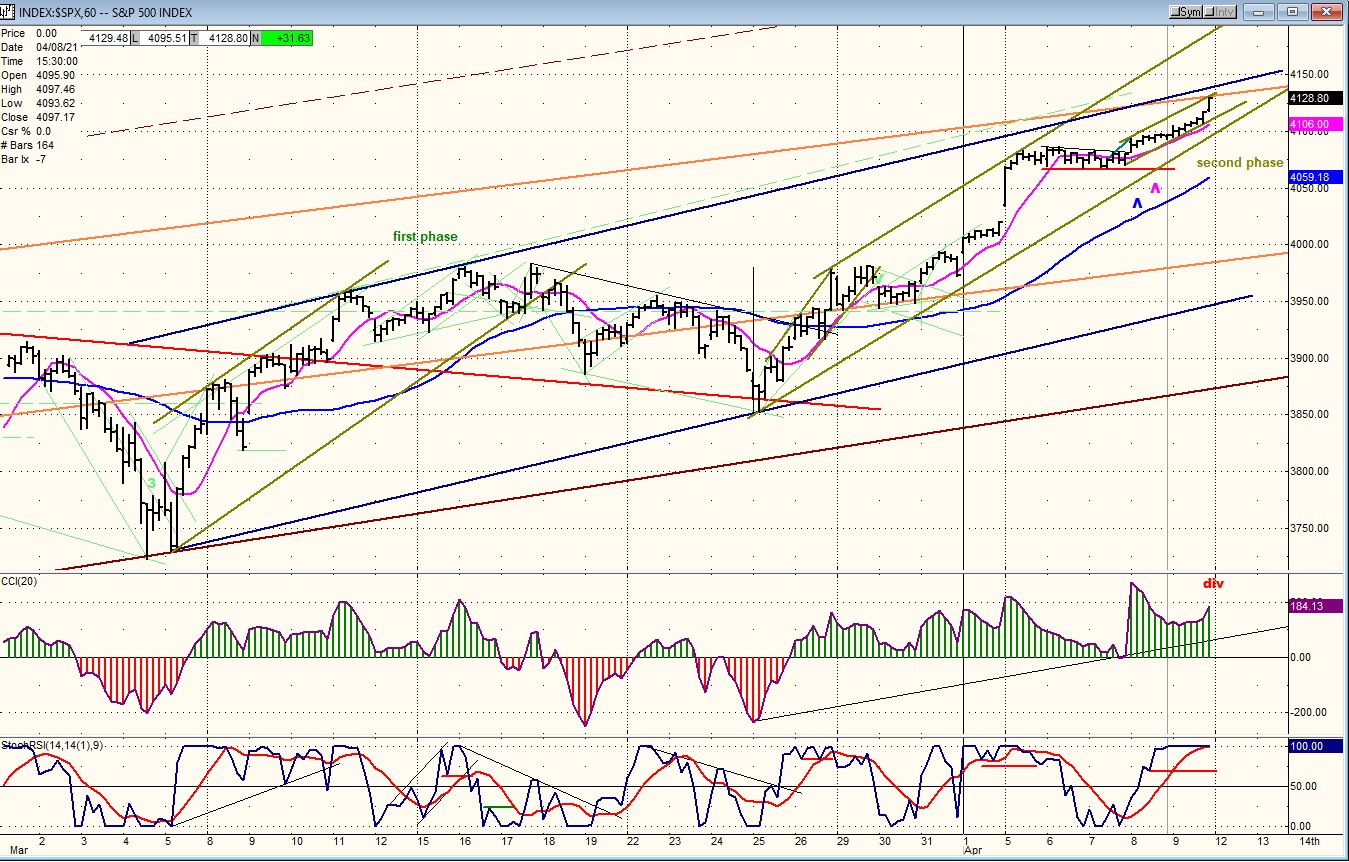
SPX hourly chart
On the hourly chart, I have added one more short-term channel to define the second phase which is progressing within the dark-blue channel from 3853. It shows that the move could extend beyond the outside of the larger blue and orange channels -- perhaps even before the current phase is complete. But the resistance encountered at Friday’s close (which corresponds to ~4130 on the P&F chart) suggests that a near-term pullback should occur before we end the second phase around 4180-4200.
The divergence which is showing in the CCI is also warning that a reversal is close, but because the oscillator still has a strong positive value there may be only a short pull back and then a move to the final high of this phase before the indicator goes negative and gives a sell signal.
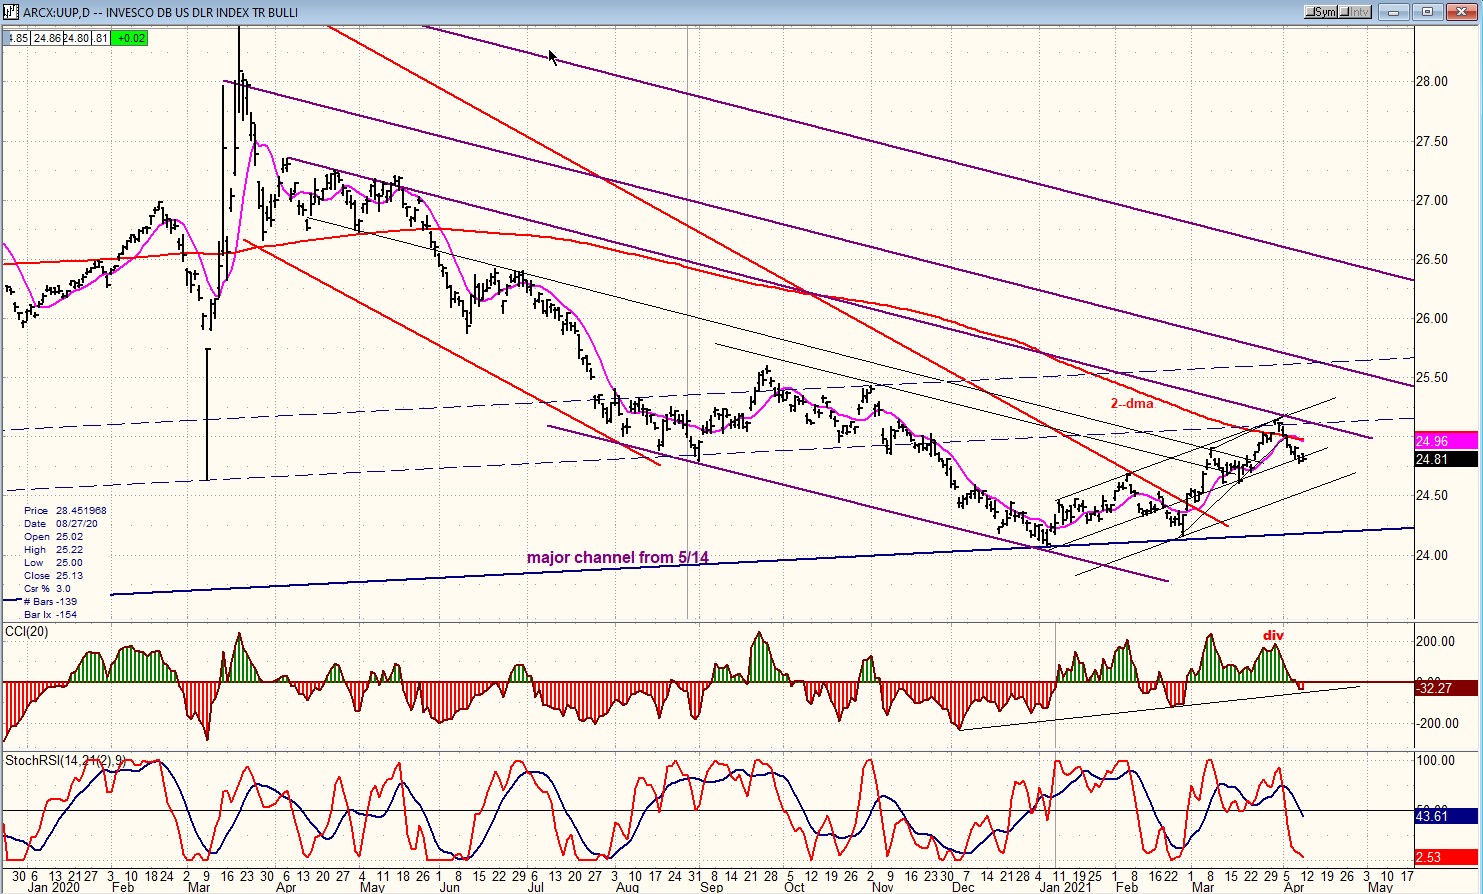
UUP (dollar ETF) DLY ($USD chart is not available from this data provider)
UUP found resistance at the 200-dma and at the trend line drawn as a parallel to the lower channel line, and this caused a minor pullback to a mid-channel line of the short-term uptrend channel, which could hold the price for a little while. Even if it continues lower, it is likely to find support at the bottom of the channel and reverse. We will then see if UUP continues its uptrend, or if some additional base building is required before attempting another uptrend.
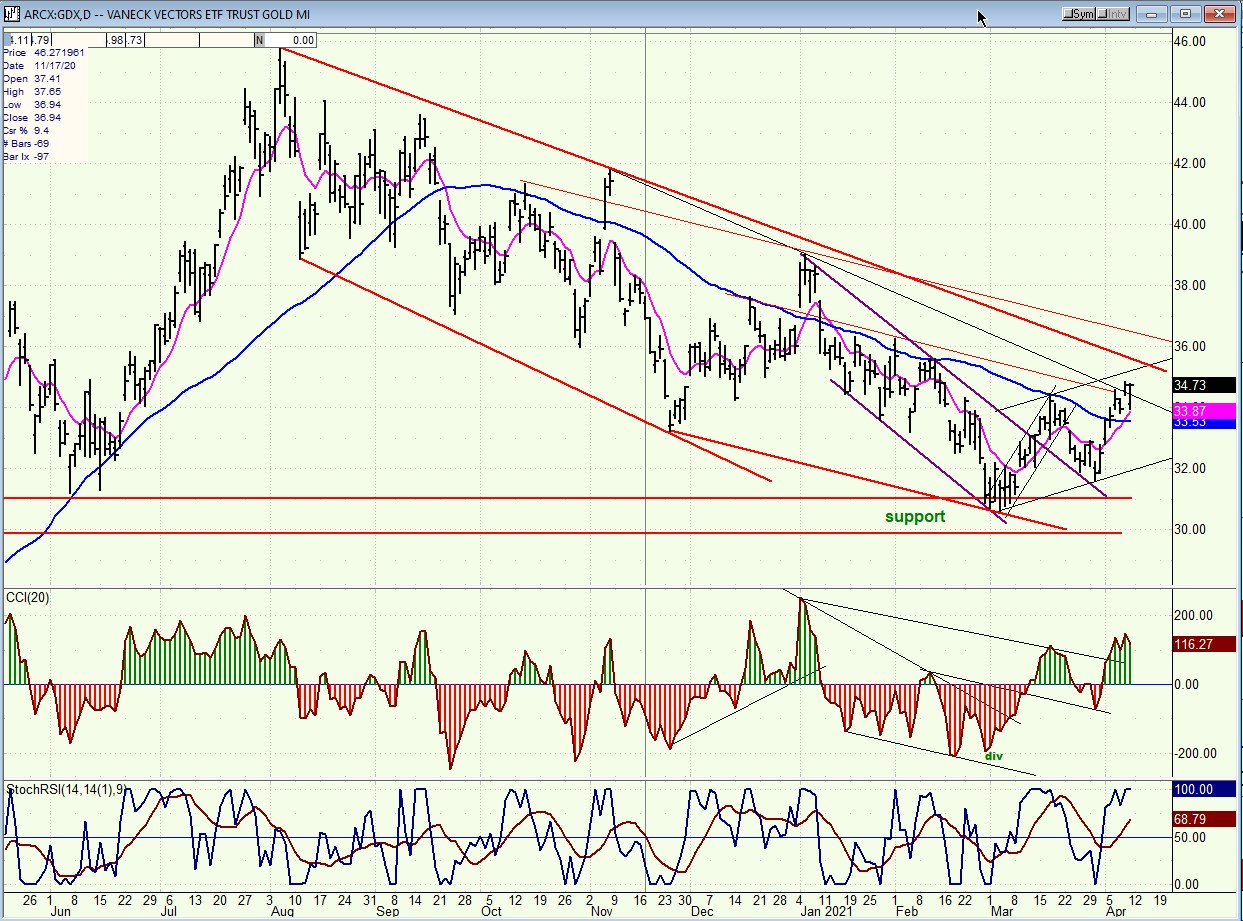
GDX (gold miners)-DLY
GDX took advantage of a pullback in UUP to start on another move slightly higher. Trend lines and parallels have worked well on this index and it seems to be pushing though a secondary trend line, which could lead to testing the top of the corrective channel around 35.50. How it is repulsed by that trend line will give us an indication of whether and when it can break through the top of the channel and end its correction.
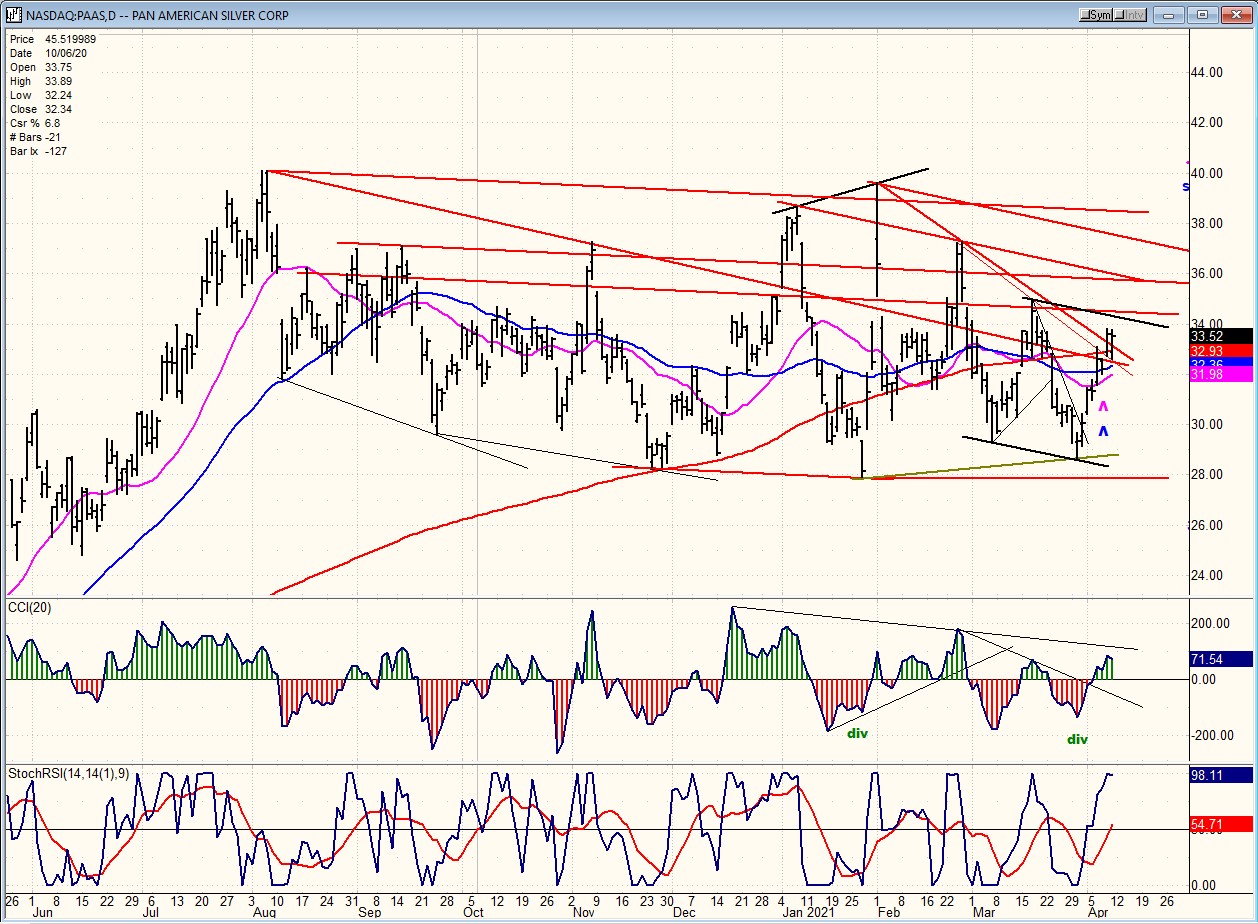
PAAS (Pan American Silver Corp-DLY)
PAAS is about to run into some resistance which can end its short-term uptrend. Its correction has spanned a broader channel than GDX, so it is still a long way from the top of its corrective channel top, but it is pushing above the original downtrend line and this is important. Still, like GDX, it moves with SPX and may require some additional consolidation of another two or three weeks before it is ready to resume its uptrend.
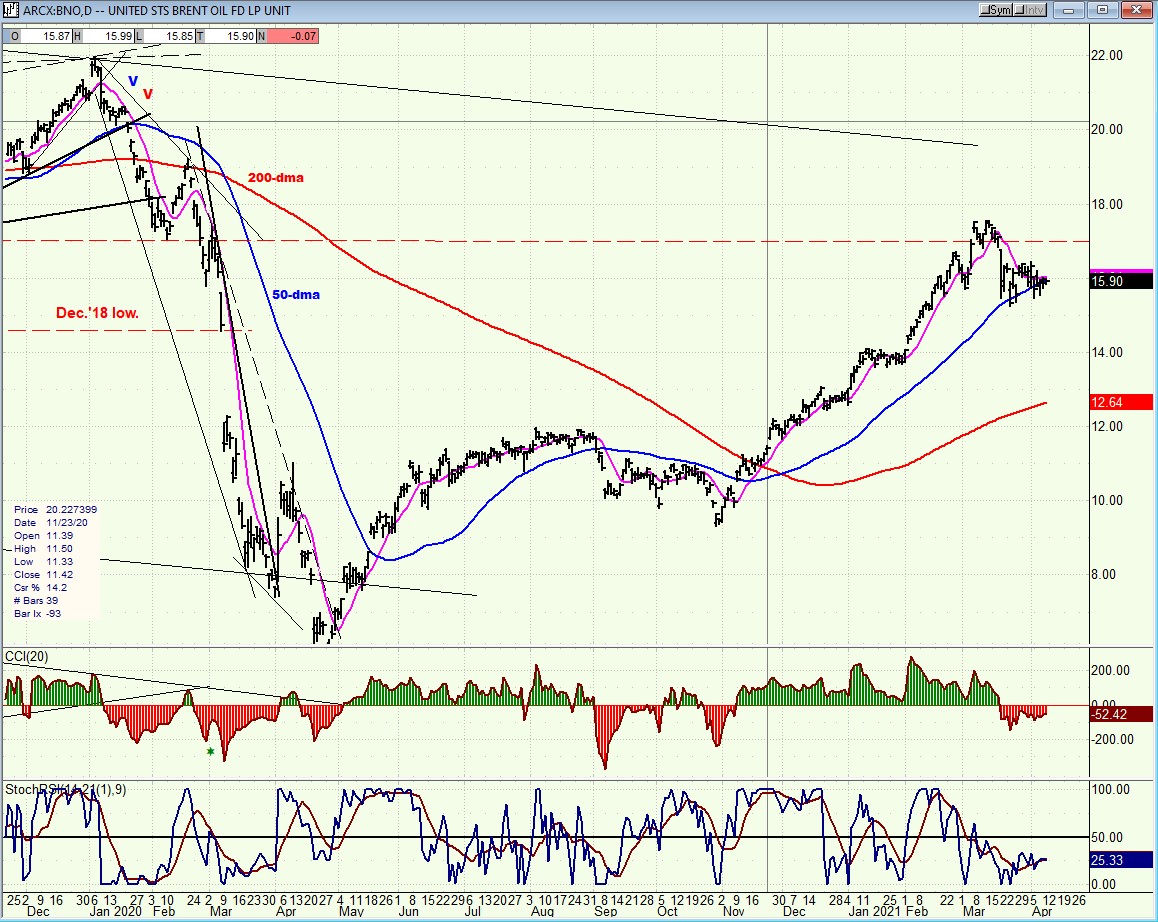
BNO (Brent oil fund) DLY.
BNO is finding support on its 50-dma. If it breaks below it, this could extend its correction by several weeks.
SUMMARY
SPX should end its second phase from 3723 around 4180-4200 and reverse for a two/three-week correction before starting on the third and final phase of this intermediate uiptrend.
Free trial subscription
With a trial subscription, you will have access to the same information that is given to paid subscribers, but for a limited time-period. Over the years, I have developed an expertise in P&F charting (price projection), cycles (timing), EWT (structure), and general technical analysis which enables me to warn subscribers of pending reversals in market trends and how far that trend can potentially carry. For a FREE 2-week trial, subscription options and payment plans, I encourage you to visit my website at www.marketurningpoints.com.
The above comments and those made in the daily updates and the Market Summary about the financial markets are based purely on what I consider to be sound technical analysis principles. They represent my own opinion and are not meant to be construed as trading or investment advice but are offered as an analytical point of view which might be of interest to those who follow stock market cycles and technical analysis.
*********

When Andre Gratian was a stock broker years ago, a friend introduced him to technical analysis of the market. Consequently, it is not an exaggeration to say that Andre fell in love with this approach! Ever since then, it has become an increasingly important part of his professional life. Gratian has studied the works of Wyckoff, Edwards & Magee, Edward J. Dewey (cycles) and many others. However, one of my most profitable undertaking has probably been to study Point & Figure charting, which he finds invaluable in analyzing stocks and indices. If he were restricted to one methodology, this is the one that he would choose. This well-rounded background has given him what he feels to be a special insight into the stock market, facilitating the recognition of meaningful patterns and the ‘turning points’ in all trends, whether they be short or long term. Andre feels very comfortable discussing the stock market and passing on meaningful information to others. His subscribers include individuals and money managers throughout the world. Moreover, his Newsletters are currently published on several financial sites, here and abroad.


