Technical Analysis Of The Markets


Current Position Of The Market
SPX Long-Term trend: If the market strength persists, the long-term trend may need to be re-evaluated.
SPX Intermediate-Trend: SPX intermediate P&F count to 2300 is still possible before a reversal occurs.
Analysis of the short-term trend is done on a daily-basis with the help of hourly charts. It is an important adjunct to the analysis of daily and weekly charts which discuss longer market trends.
Uptrend On Borrowed Time
Market Overview
The rally of the past two days failed to lift the DJIA to 20,000 once again, but it should get one more chance at reaching it next week. Beyond then, the opportunity may be gone for a while. The reasons for a top to materialize in this time frame remain the same: An SPX P&F projection, and cycles! A rally to 2240-2300 has been the preferred count for the uptrend which started at 1810 ever since the index got past 1940, although some uncertainty that it would get there did develop along the way. Now, even the most recent pattern of re-accumulation seems to be re-confirming the 2300 target. Topping cycles are also suggesting that the uptrend is living on borrowed time. If the SPX reaches 2300 next week -- a move of nearly 30 points from where we ended the week -- it would be inconceivable for the DJIA not to rise the remaining 115 points needed to reach 20,000.
If we are to make a high next week, the current cyclical configuration calls for a decline into April-May. If this materializes, it would bring more than just a minor correction. A .382 retracement of the entire uptrend from 1810 would amount to 180 points. But the current wave structure of the rally from that level may be suggesting an alternate scenario of continued strength. The next few weeks should clarify the market’s intention.
Analysis (This chart and others below, are courtesy of QCharts.com.)
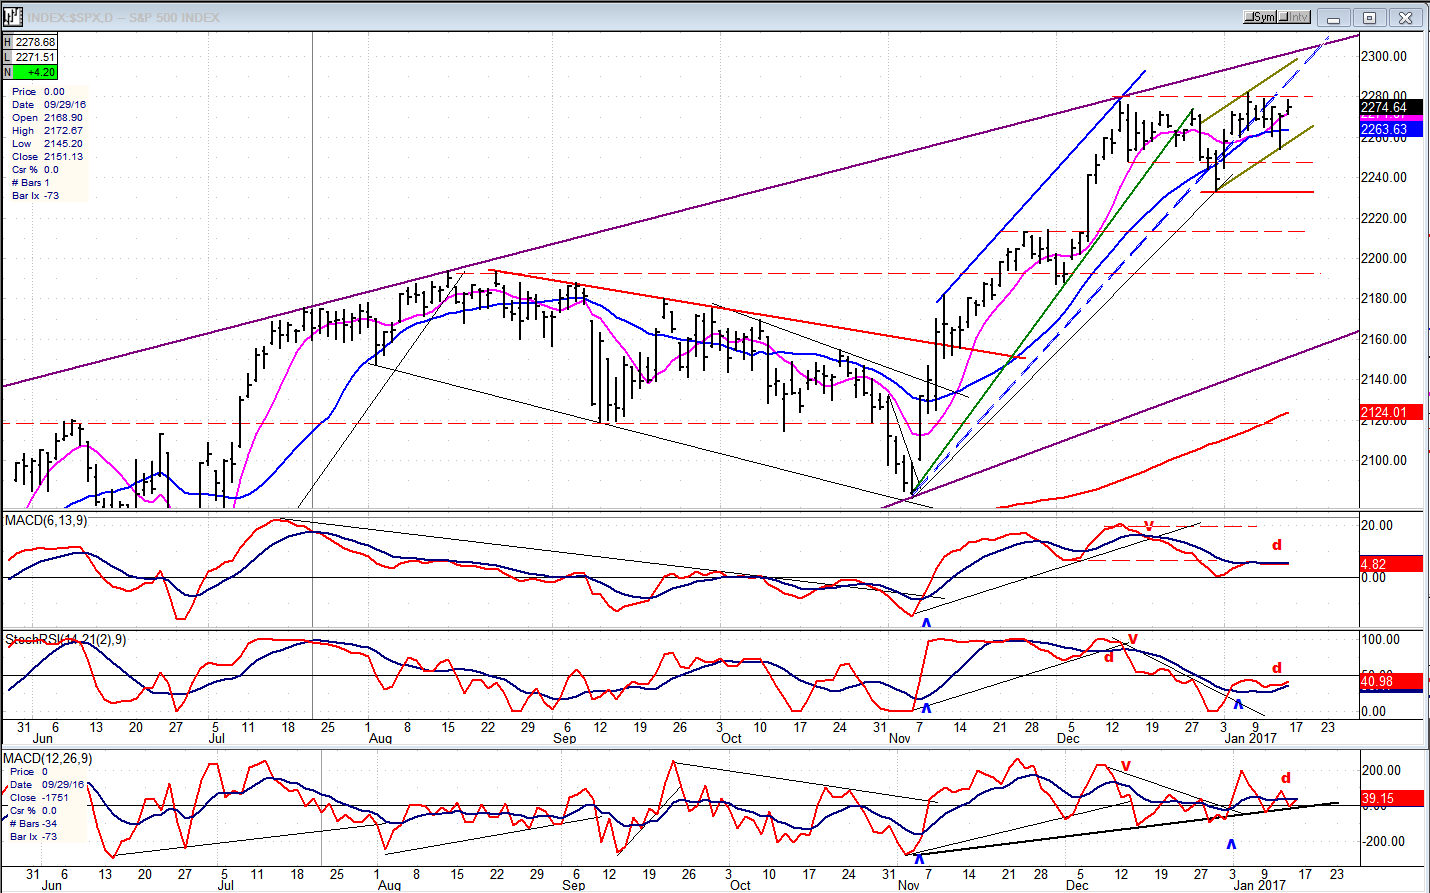
Daily Chart
SPX has done little since its high of 2278 a month-ago. There was another attempt at rallying which did make a new high of 2282, but it was pushed back immediately. We are trying one more time to get past the resistance band which extends from 2270 to 2286. The rally stalled on Friday, ahead of the three-day weekend without losing much ground, and short-term cycles look favorable for another push this week. After that, there does not appear to be much of an incentive to continue the uptrend, especially if we rally to 2300 next week, but in order to confirm a reversal, the index will need to drop below 2234.
In spite of the probability of making a new all-time high next week, the pattern from 1810 could still be a wedge. In its favor are topping intermediate cycles and a bottom count which would be filled at 2300.
As it stands, the oscillators already show negative divergence, and if they retain it as SPX makes a new high, it will be additional evidence that a top is in the making.
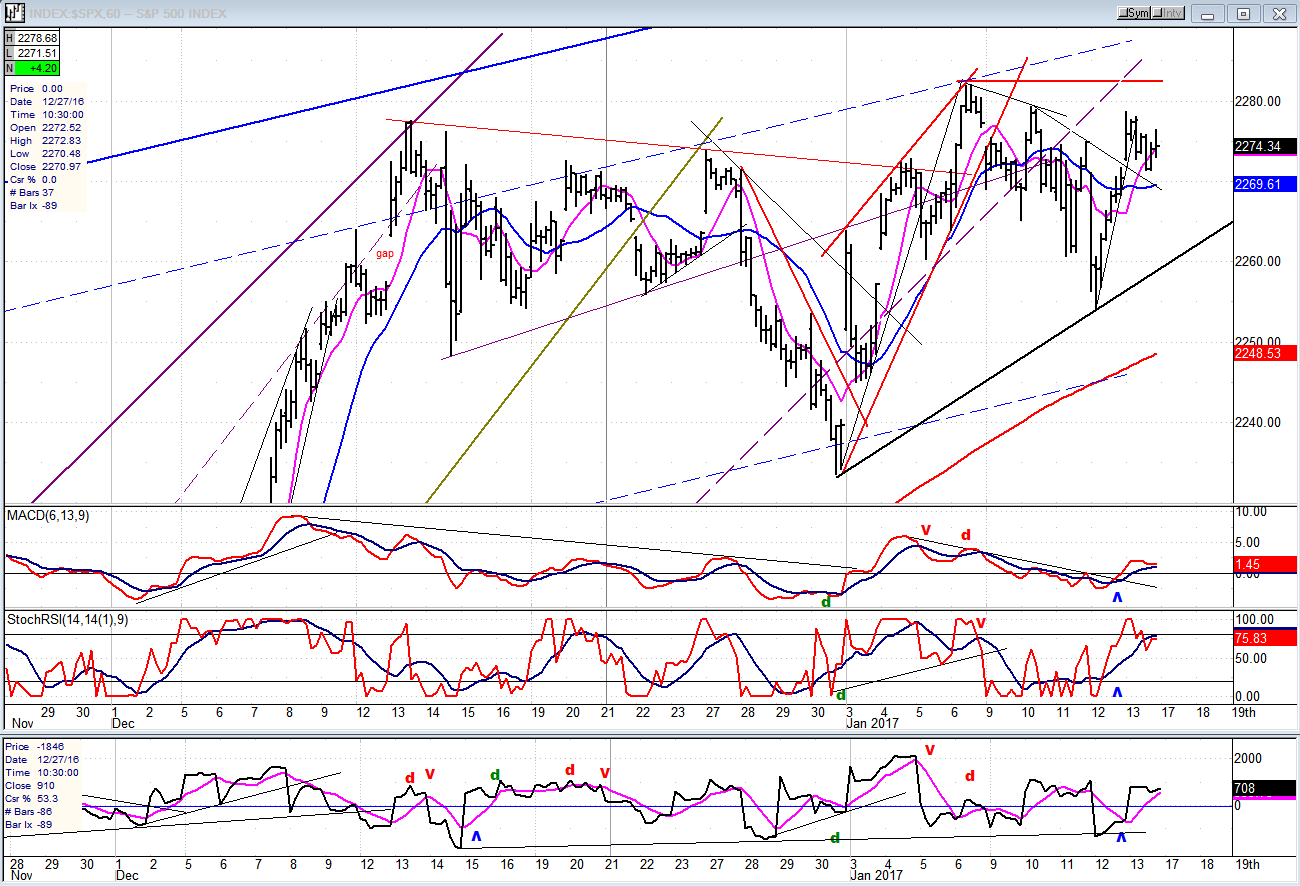
Hourly Chart
The rally of the past two days has pierced through most of the overhead resistance before stopping at the old high of 2278 and backing off. It was extended on a near-term basis and a little consolidation ahead of a three-day weekend is understandable. It could even retrace down to 2269 without damaging its uptrend. Beyond that could be problematic for the short-term. The higher it remains above the minor trend line which connects the two lows, the better its chances of making a new high next week and reaching the 2300 target.
If the index pulls back to 2269, it will generate a near-term sell in the oscillators. Then a final high would be confirmed with negative divergence in the daily as well as in the hourly oscillators.
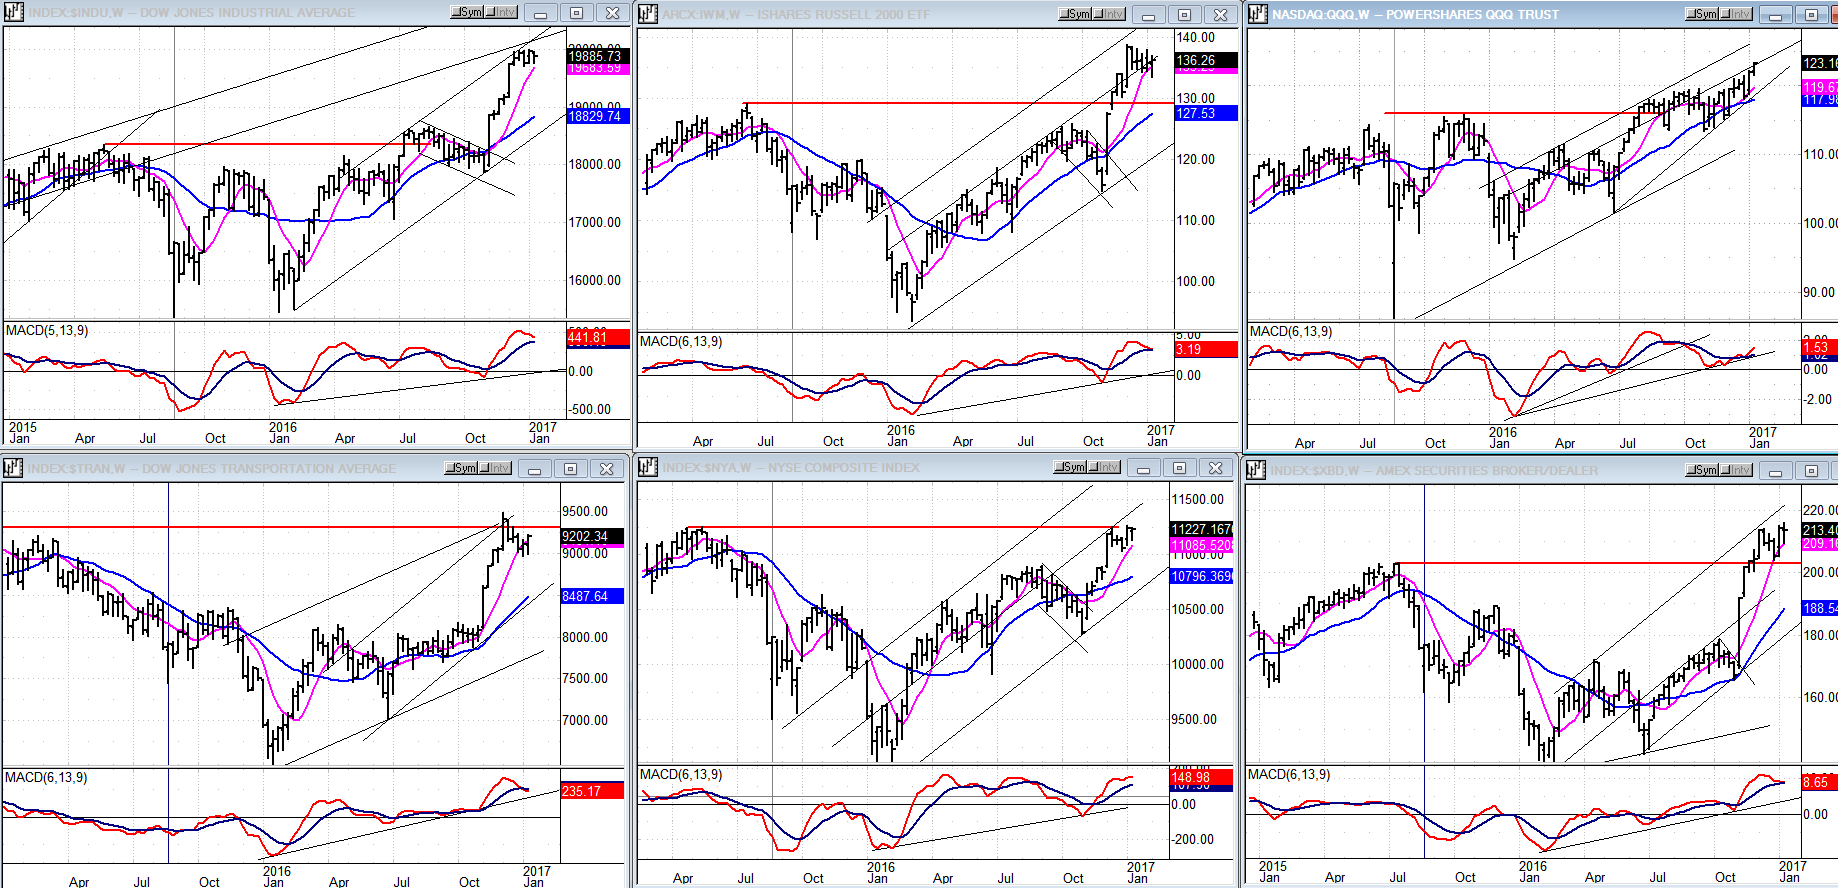
An Overview Of Some Major Indexes (Weekly Charts)
There is a little more congestion showing in all the indices as the consolidation continues. QQQ (top right) has pushed a little higher while the others are essentially going sideways. The patterns vary slightly, but they all look like preparation for moving a little higher to finish the advance from October. What follows will determine the longer-term market position. The MACD patterns are still the weakest in QQQ and NYA (bottom center.)
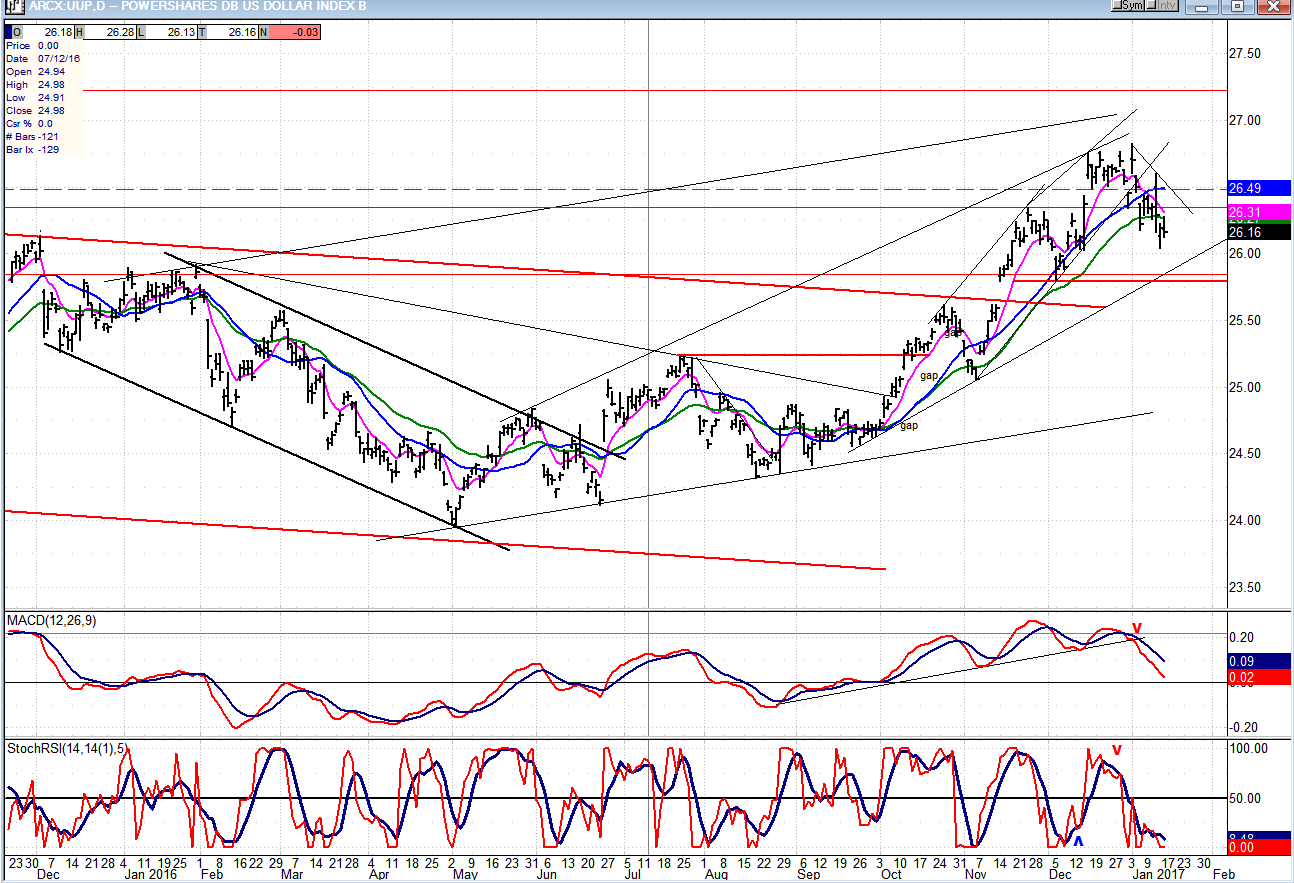
UUP (Dollar ETF)
UUP is correcting but should be ready for a mid-point bounce of its corrective pattern.
GDX (Gold Miners ETF)
GDX has broken out of the downtrend which started in August. The initial up-thrust from the low is most likely coming to an end and the index should begin to pull back down to about 20.50 -- and perhaps lower. This would form the base from which we could determine the extent of the next uptrend.
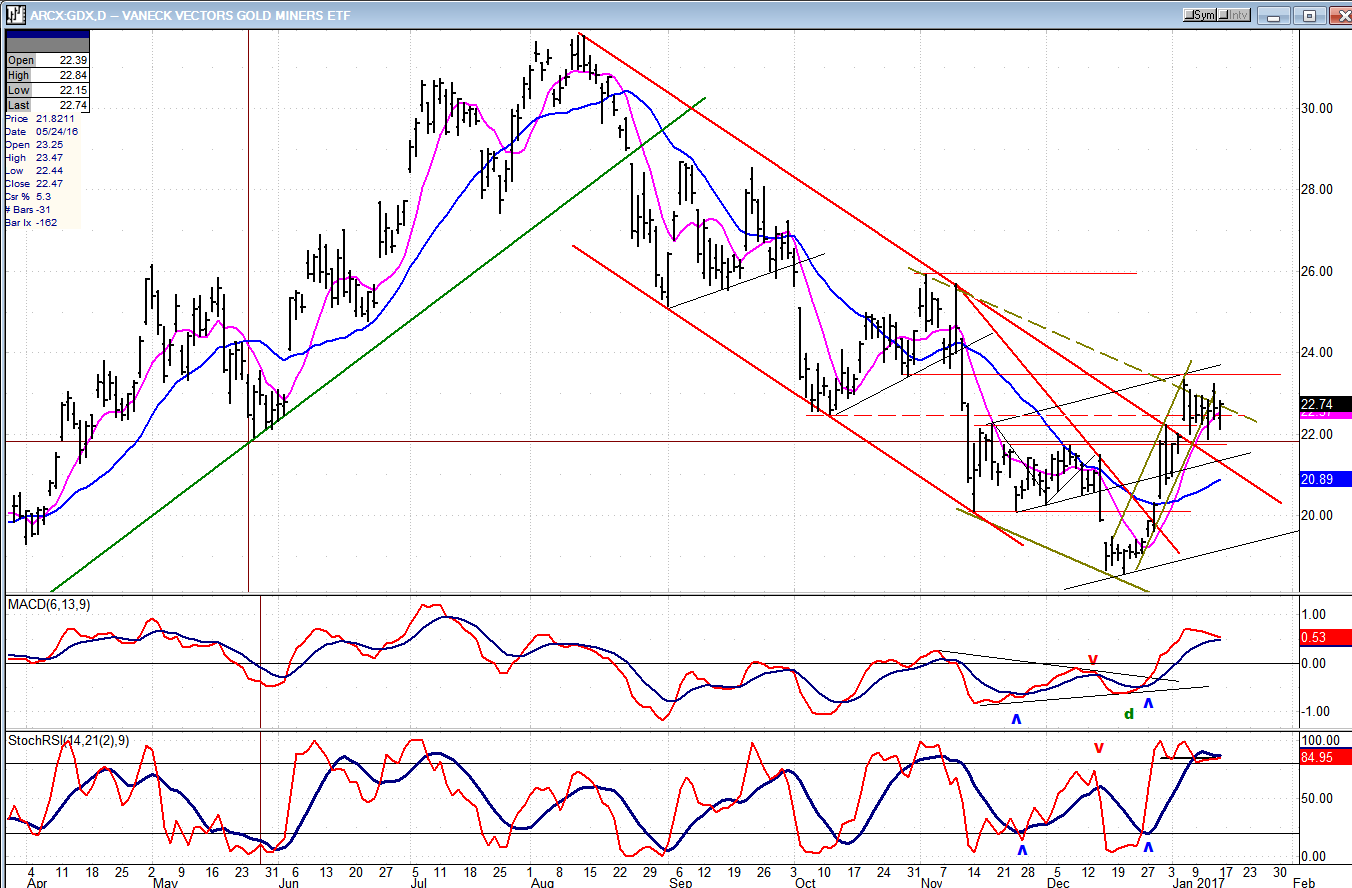
Note: GDX is now updated for subscribers several times throughout the day (along with SPX) on Marketurningpoints.com.
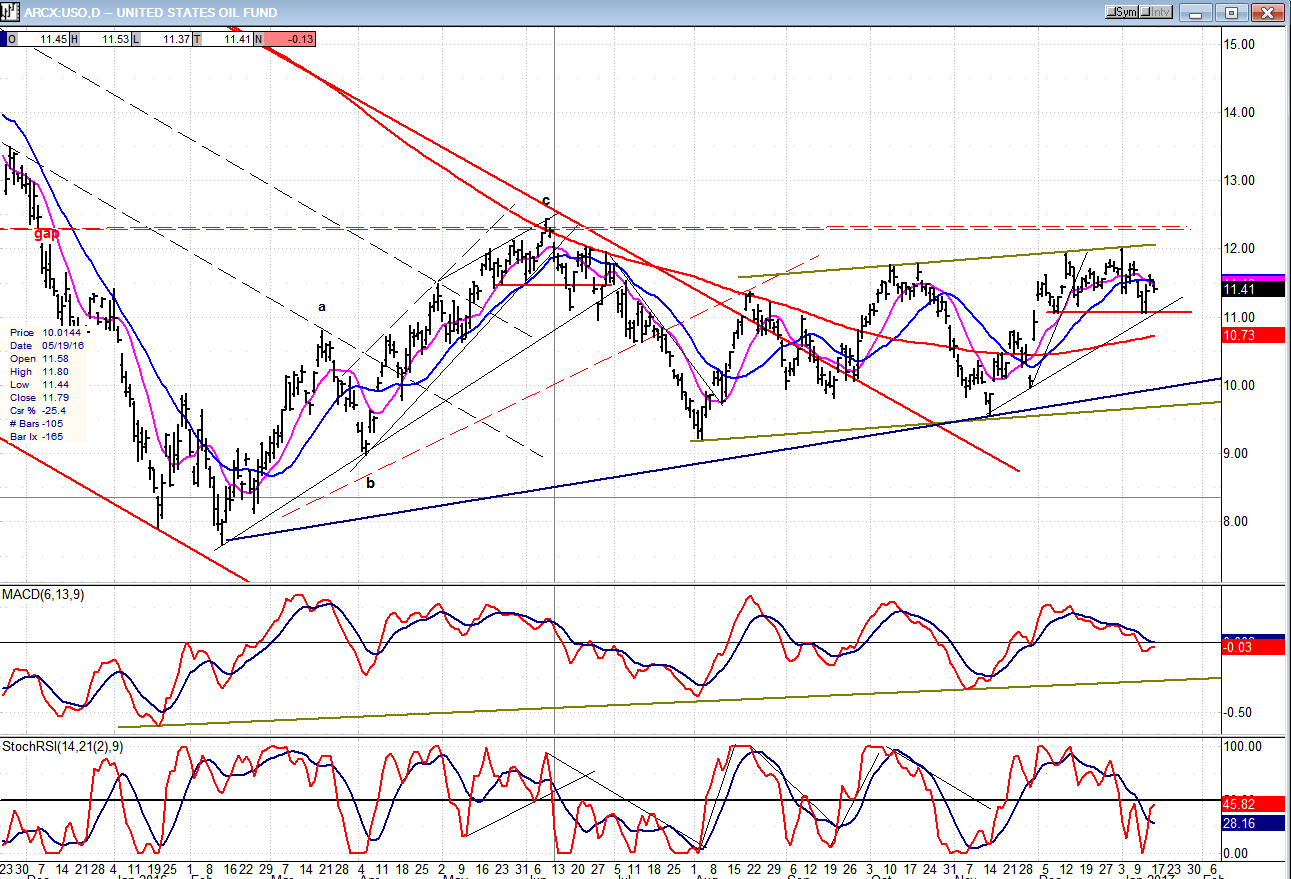
USO (US Oil Fund)
USO is holding well and increasingly looks as if it wants to move higher. If more weakness does not occur in the next few days, it may break out of its base and start a rally to about 15-15.50
Summary
SPX looks ready to put in a top in the vicinity of 2300 and start a correction. The extent of the initial retracement will be determined after we have evaluated the amount of distribution which takes place at that level.
********
For a FREE 4-week trial, send an email to [email protected], or go to www.marketurningpoints.com and click on “subscribe”. There, you will also find subscription options, payment plans, weekly newsletters, and general information. By clicking on "Free Newsletter" you can get a preview of the latest newsletter which is normally posted on Sunday afternoon (unless it happens to be a 3-day weekend, in which case it could be posted on Monday).
The above comments and those made in the daily updates and the Market Summary about the financial markets are based purely on what I consider to be sound technical analysis principles. They represent my own opinion and are not meant to be construed as trading or investment advice, but are offered as an analytical point f view which might be of interest to those who follow stock market cycles and technical analysis.

When Andre Gratian was a stock broker years ago, a friend introduced him to technical analysis of the market. Consequently, it is not an exaggeration to say that Andre fell in love with this approach! Ever since then, it has become an increasingly important part of his professional life. Gratian has studied the works of Wyckoff, Edwards & Magee, Edward J. Dewey (cycles) and many others. However, one of my most profitable undertaking has probably been to study Point & Figure charting, which he finds invaluable in analyzing stocks and indices. If he were restricted to one methodology, this is the one that he would choose. This well-rounded background has given him what he feels to be a special insight into the stock market, facilitating the recognition of meaningful patterns and the ‘turning points’ in all trends, whether they be short or long term. Andre feels very comfortable discussing the stock market and passing on meaningful information to others. His subscribers include individuals and money managers throughout the world. Moreover, his Newsletters are currently published on several financial sites, here and abroad.
More from Gold-Eagle


