Gold’s most extreme drawdowns signal tactical reassessments, not durable regime shifts
NEW YORK (February 10) Gold’s sharp selloff on January 30 – after reaching the edge of $5,600 per ounce – appears to be a positioning and volatility reset rather than a rejection of gold’s long-term investment case, according to Christopher Gannatti, Global Head of Research at WisdomTree.
In a detailed analysis, Gannatti wrote that the recent price plunge, though extreme, was consistent with prior liquidity-driven repricing episodes.
“The January 30 selloff in gold's price was not a repudiation of gold's longer-term investment case, but it could have been a violent correction within an already elevated volatility regime,” he said. “By late January, gold prices had reached levels that reflected not only heightened macro anxiety but also increasingly compressed time horizons. Moves that would historically have unfolded over quarters, or even years, were instead realized over days. After reaching an intraday high near $5,595 per ounce on January 29, gold reversed sharply, falling below $5,000 intraday the following session, highlighting how stretched momentum and positioning had become.”
Gannatti then looked at the move on January 30 within the context of other historical selloffs.
“On April 15, 2013, gold fell roughly 9% in a single session, then its largest one-day decline since the early 1980s,” he noted. “That episode marked a violent reset after an extended narrative-driven rally, shifting the market from macro storytelling to microstructure dynamics, forced selling, exchange-traded fund (ETF) outflows, and a rapid pickup in physical demand.”
“The lesson was not that gold ‘failed,’ but that crowded trades reprice discontinuously,” he said.
The next such move occurred in March 2020, when safe havens were sold to cover liquidity events.
“During the COVID-era ‘dash for cash,’ gold declined alongside equities as investors sold liquid assets to meet margin calls and reduce leverage,” Gannatti wrote. “Research from the New York Fed and the Office of Financial Research shows that in systemic stress, gold can temporarily behave less like a hedge and more like a source of balance-sheet liquidity.”
He pointed out that these large selloffs in gold often happen around “regime repricing events.”
“Gold's sharpest down days tend to coincide with abrupt shifts in expectations around monetary policy credibility, real interest rates, and the U.S. dollar,” he said. “The January 30, 2026 decline fits this pattern, as markets rapidly repriced the perceived Federal Reserve reaction function rather than reassessing gold's long-term role.”
“History argues that moves of this magnitude are more likely driven by positioning, leverage, and volatility feedback loops than by a sudden collapse in gold's strategic case,” Gannatti said. “The critical question is not whether gold fell sharply, but whether post-selloff behavior, flows, volatility, and real-rate dynamics, resembles a liquidity flush or a durable regime shift."
"Sitting in January 2026, investors that may have been focused on gold or allocating to gold over the recent strong price performance need to review how different instruments performed in the face of January 30, 2026's market volatility.”
Gannatti then analyzes the performance of two of the most popular vehicles for gold investment in the wake of the selloff, GLD and GDX, as well as WisdomTree’s Gold Plus Gold Miners Strategy Fund (GDMN), and Gold Plus Equity Strategy Fund (GDE), against the S&P 500.
“The SPDR Gold Shares (GLD) had more than $170 billion of assets under management as of the market's close on January 30th,” he said. “This represents physical gold sitting in a vault. When gold's spot price performance is referenced, this is the type of strategy that could closely reflect it.”
“Some have seen gold's performance and have reached for equity-like upside via the shares of gold miners in the VanEck Gold Miners ETF (GDX), which historically offered leveraged sensitivity to movements in the gold price—but come with operational risk and higher volatility,” he added. “After January 30, 2026, this strategy represented nearly $29 billion in assets under management.”
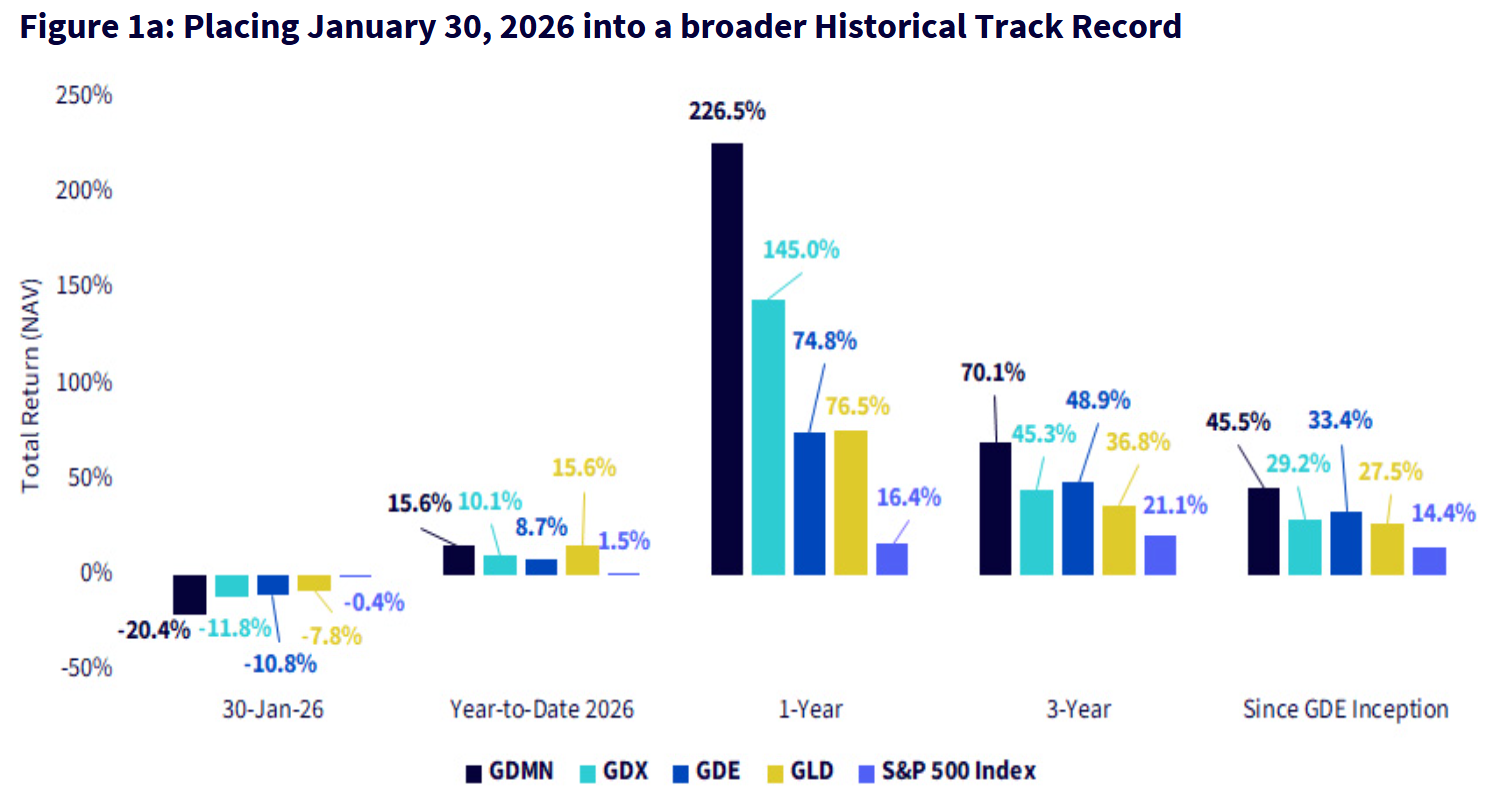
Gannatti said that based on the performance of these ETFs and the S&P 500, it’s clear that the January 30 selloff was violent, but isolated.
“A sharp single-day drawdown stands out precisely because it contrasts so starkly with gold's otherwise powerful longer-term performance,” he wrote, noting that zooming out quickly changes the story. “Year-to-date and one-year returns remain strongly positive, underscoring how much performance was concentrated before the selloff. History reframes volatility as noise. Over three years and since GDE's inception, gold equities and bullion still reflect compounding, not collapse, despite occasional sessions of extreme repricing.”
“The January 30, 2026 selloff was extraordinary in magnitude, but not extraordinary in meaning,” Gannatti concluded. “History suggests that gold's sharpest drawdowns rarely signal the end of its investment case; they tend to mark moments when markets are forced to reconcile crowded positioning, compressed time horizons, and rapidly shifting expectations. What made this episode distinctive was not simply how far prices fell, but how quickly the adjustment occurred. Moves that once unfolded over quarters were compressed into a single trading session.”
KitcoNews


