Gold Price Forecast: Gold Flashes Caution as Silver Makes History


 Several key indicators point to the possibility that gold may be nearing a significant peak:
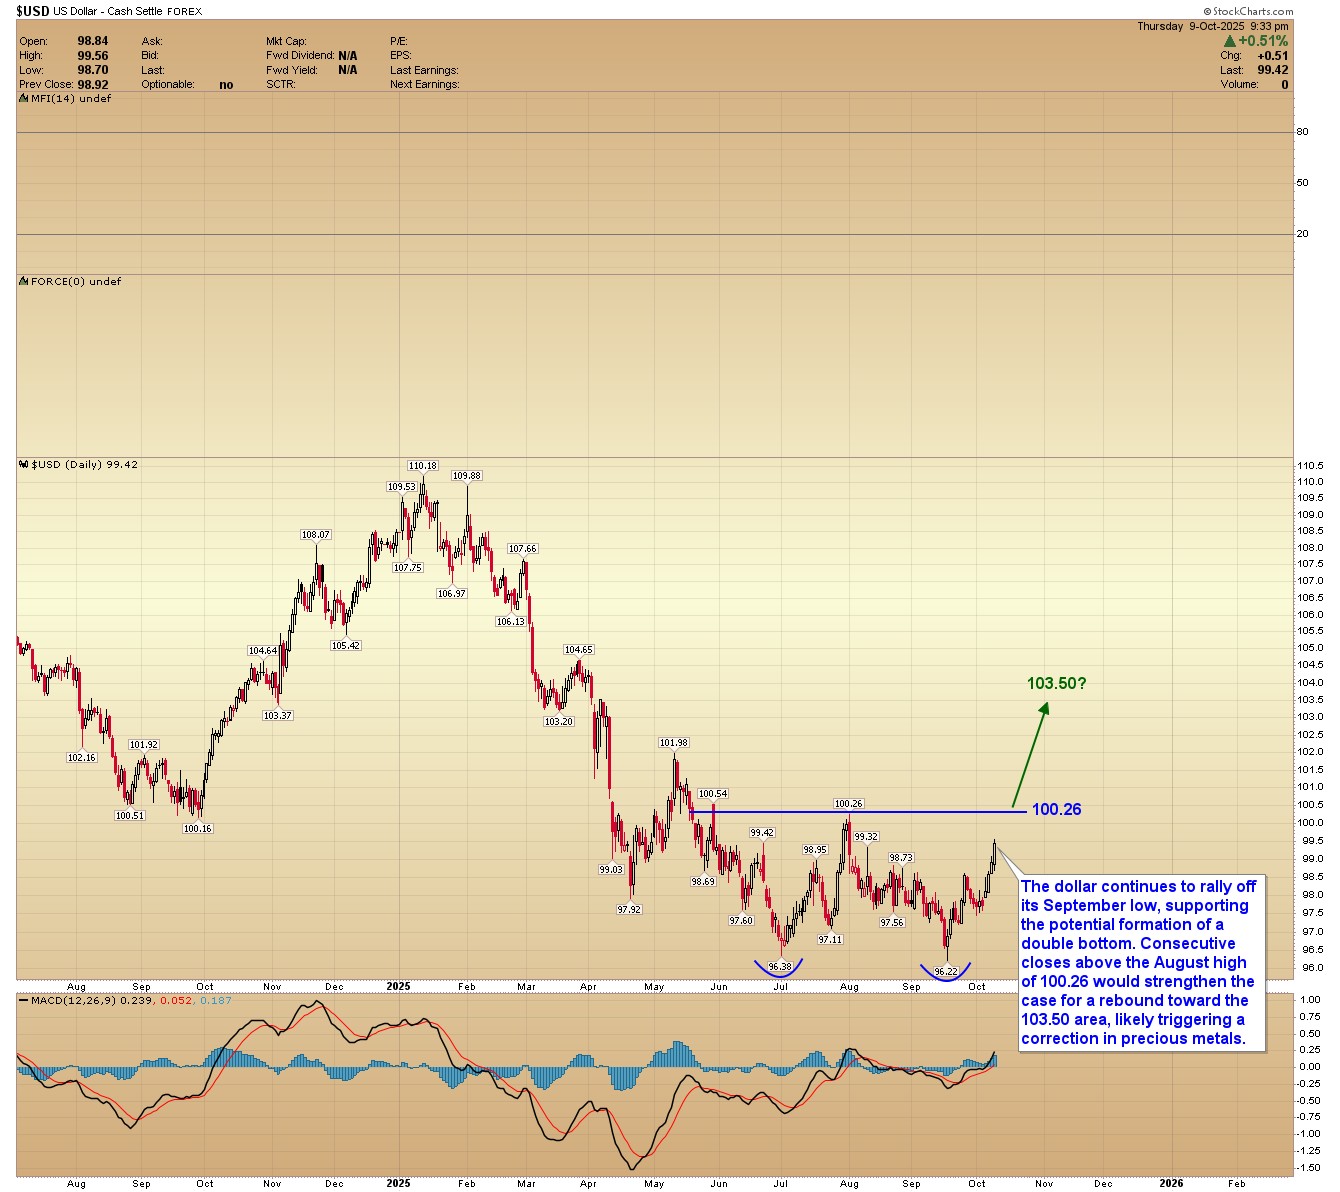
- The U.S. dollar appears to have found a bottom, which historically applies downward pressure on gold.
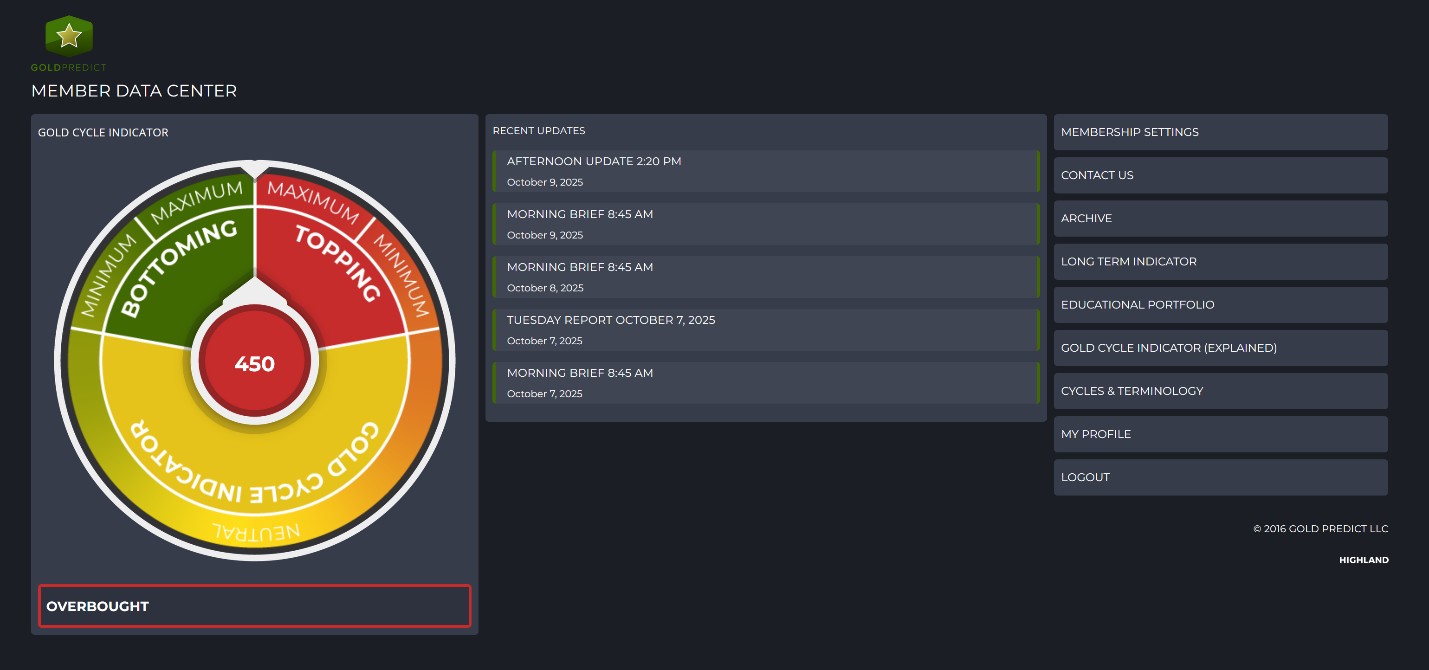
- Our Gold Cycle Indicator has reached its maximum reading of 450 — a level often associated with topping patterns.
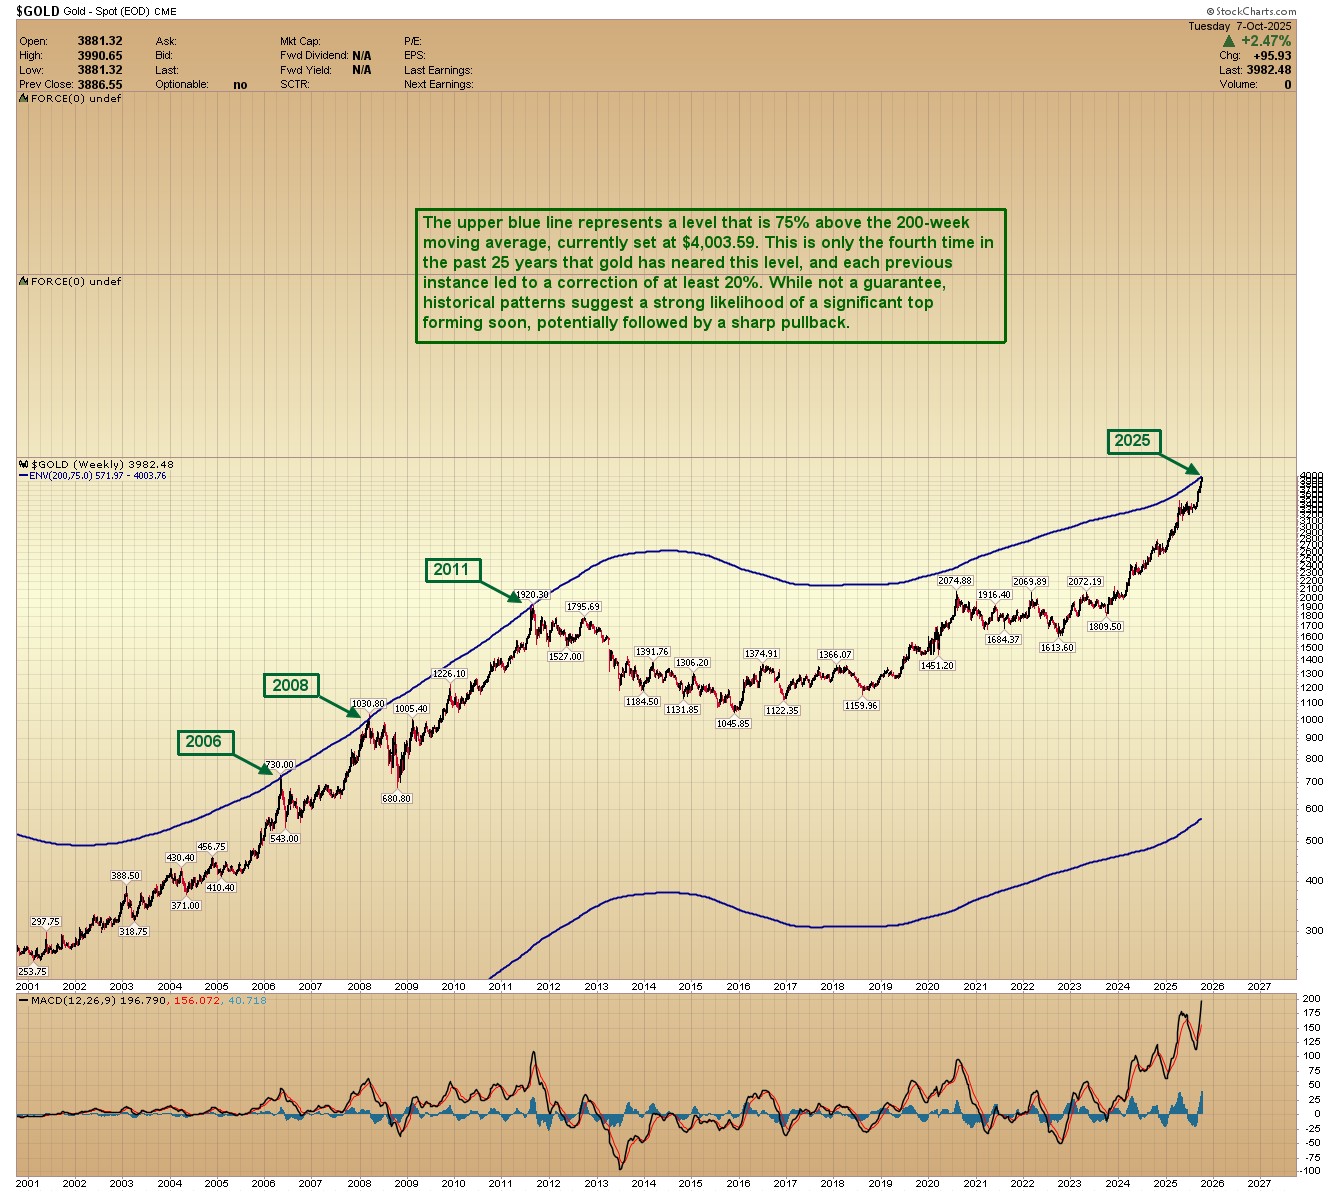
- Gold is currently trading approximately 75% above its 200-week moving average, a level that often triggers 20% corrections.
- The gold cycle has been forming significant highs roughly every 115 trading days, and prices just executed a swing high on day 117.
While a top in gold doesn’t necessarily signal immediate weakness in silver, platinum, or mining stocks, they often follow gold's lead. That said, there are periods where gold consolidates while other metals and miners continue to rally.
In short, extreme caution is warranted as gold may be setting up for a multi-month correction. However, this doesn't change our long-term bullish outlook. I remain confident that gold will reach between $8,000 and $10,000 by the end of this decade.
Silver Exceeds $50 — But Its True Target May Be Over $200
Spot silver breached $50 on Thursday, echoing the nominal highs of 1980 and 2011. However, when adjusted for inflation, silver would need to rally above $200 to match its true 1980 peak. With the growing structural supply deficit in silver, I believe not only is $200 achievable, but we could see much higher prices later this decade.
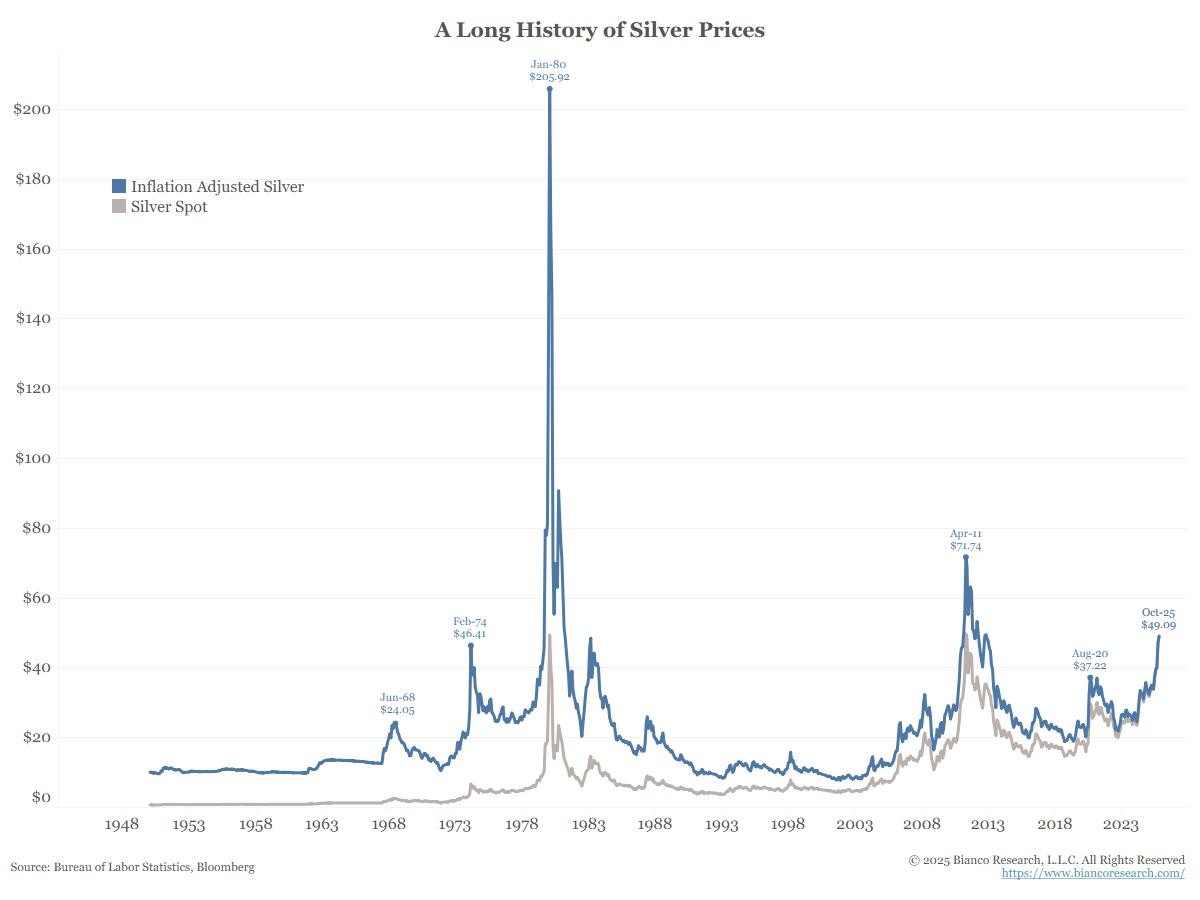
source: https://x.com/biancoresearch/status/1975943113970782366/photo/1
Our Gold Cycle Indicator remains maxed out at 450, marking its fourth consecutive day at this level, which is highly supportive of a potential top in gold.
US DOLLAR: The dollar continues to rally off its September low, supporting the potential for a double bottom. Consecutive closes above the August high of 100.26 would strengthen the case for a rebound toward the 103.50 area, likely triggering a correction in precious metals.
GOLD WEEKLY: The upper blue line represents a level that is 75% above the 200-week moving average, currently set at $4,003.59. This is only the fourth time in the past 25 years that gold has neared this level, and each previous instance led to a correction of at least 20%. While not a guarantee, historical patterns suggest a strong likelihood of a significant top forming soon, potentially followed by a sharp pullback.
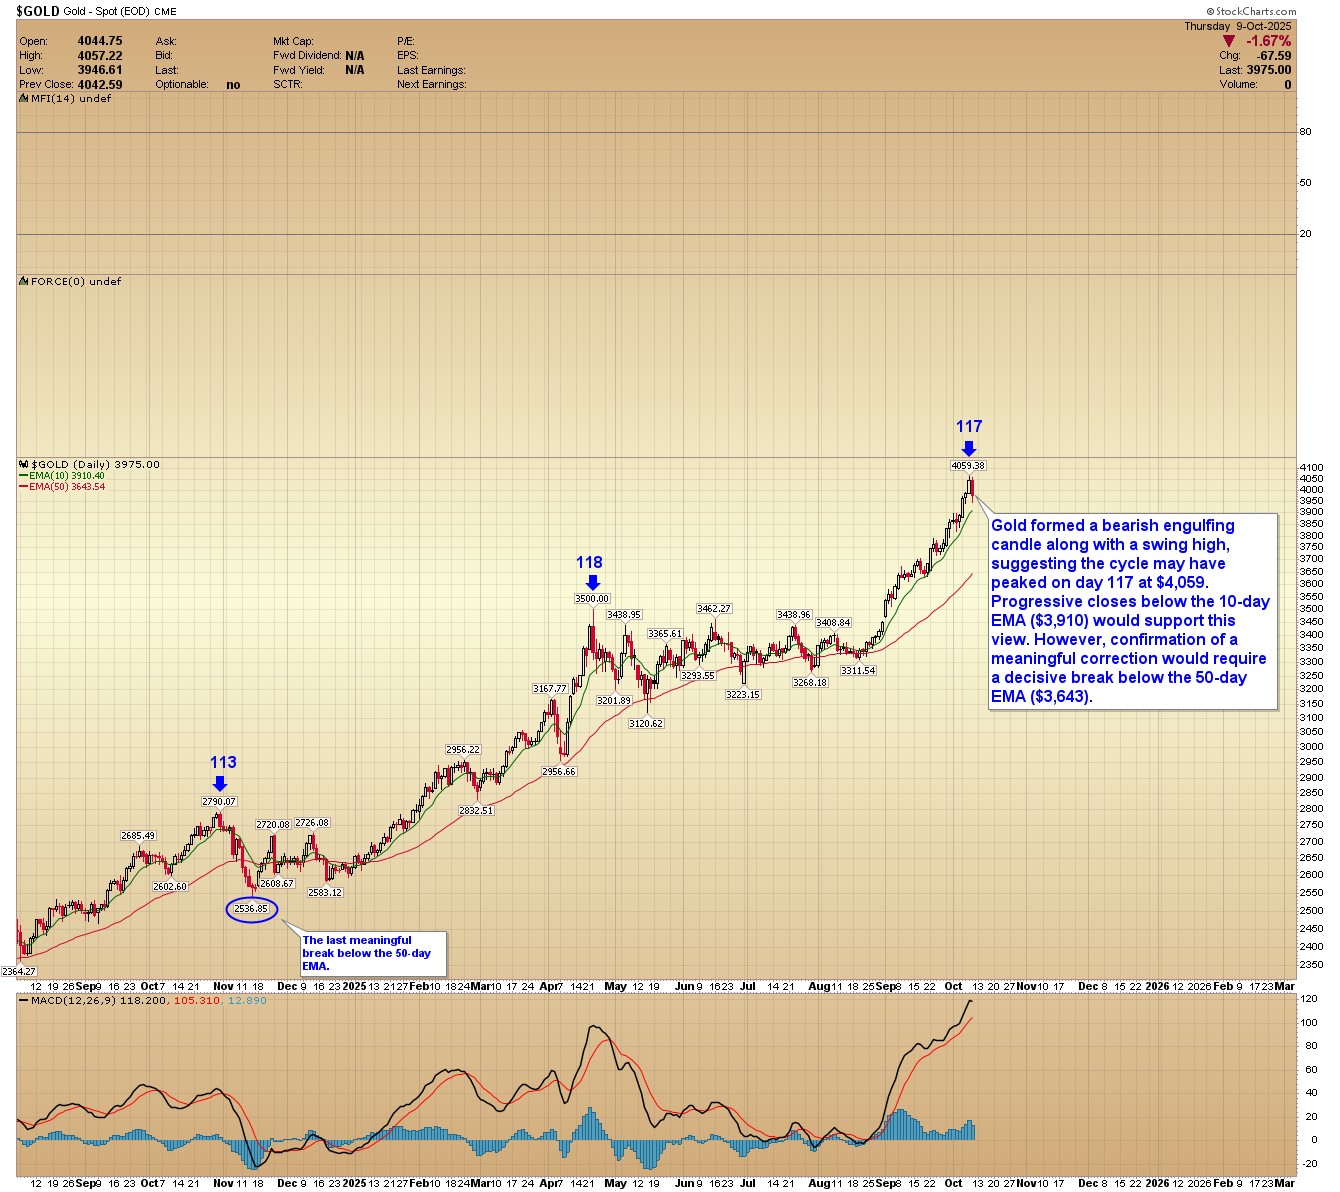
GOLD DAILY: Gold formed a bearish engulfing candle along with a swing high, suggesting the cycle may have peaked on day 117 at $4,059. Progressive closes below the 10-day EMA ($3,910) would support this view. However, confirmation of a meaningful correction would require a decisive break below the 50-day EMA ($3,643).
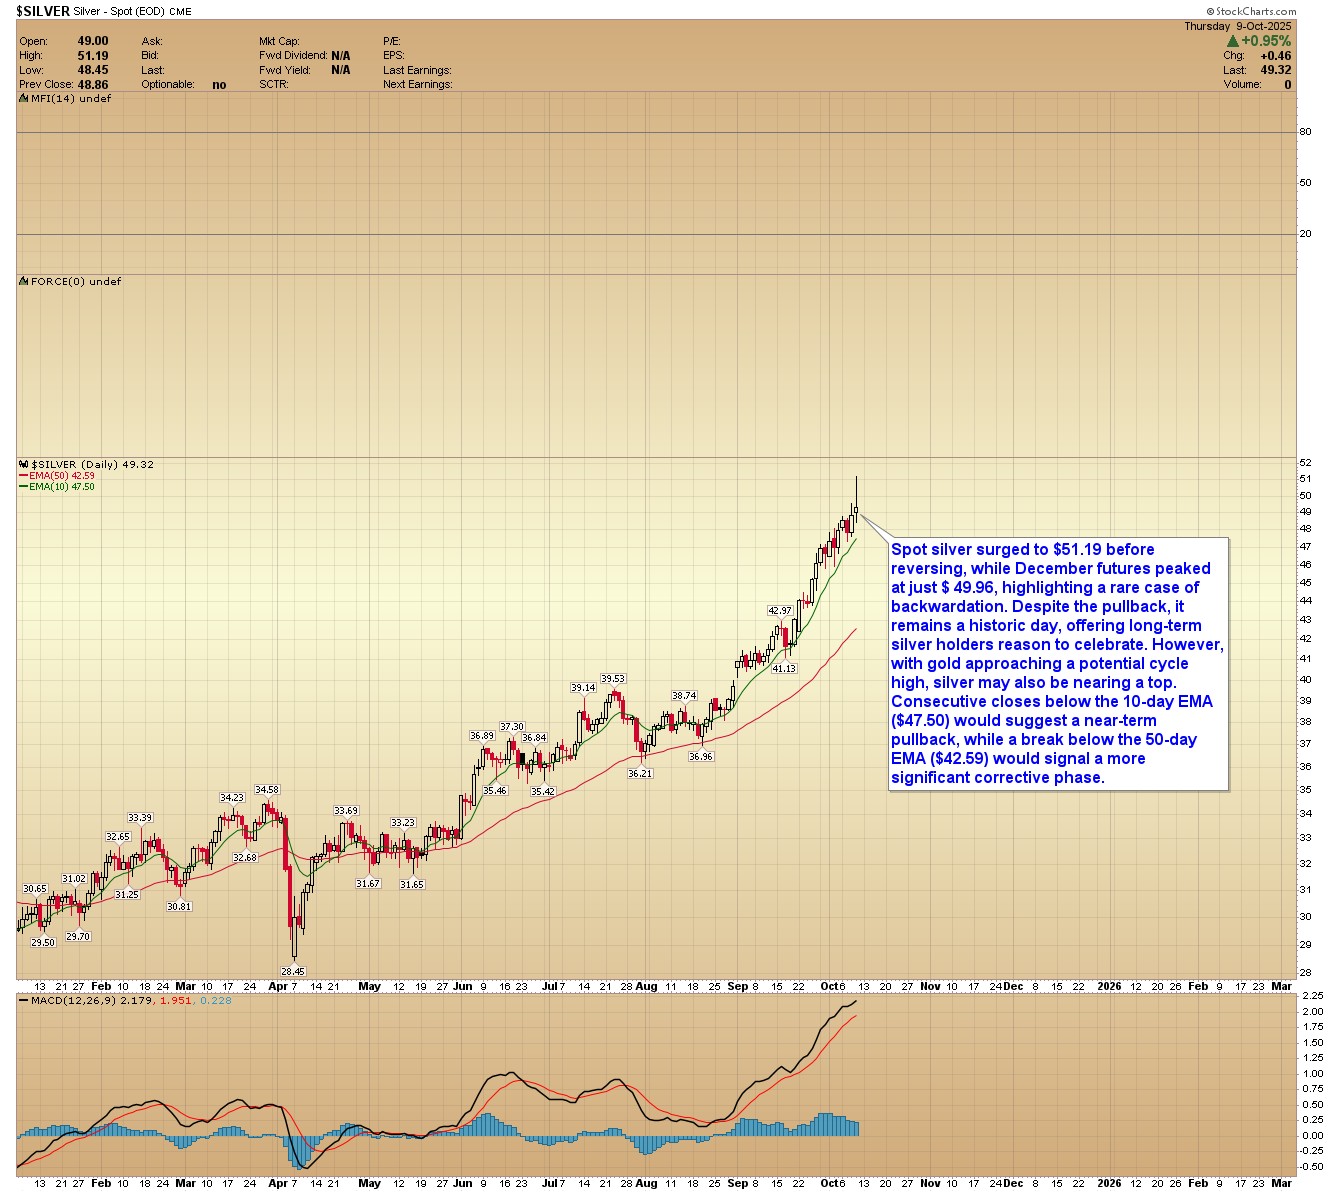
SILVER: Spot silver surged to $51.19 before reversing, while December futures peaked at just $49.96, highlighting a rare case of backwardation. Despite the pullback, it remains a historic day, offering long-term silver holders reason to celebrate. However, with gold approaching a potential cycle high, silver may also be nearing a top. Consecutive closes below the 10-day EMA ($47.50) would suggest a near-term pullback, while a break below the 50-day EMA ($42.59) would signal a more significant corrective phase.
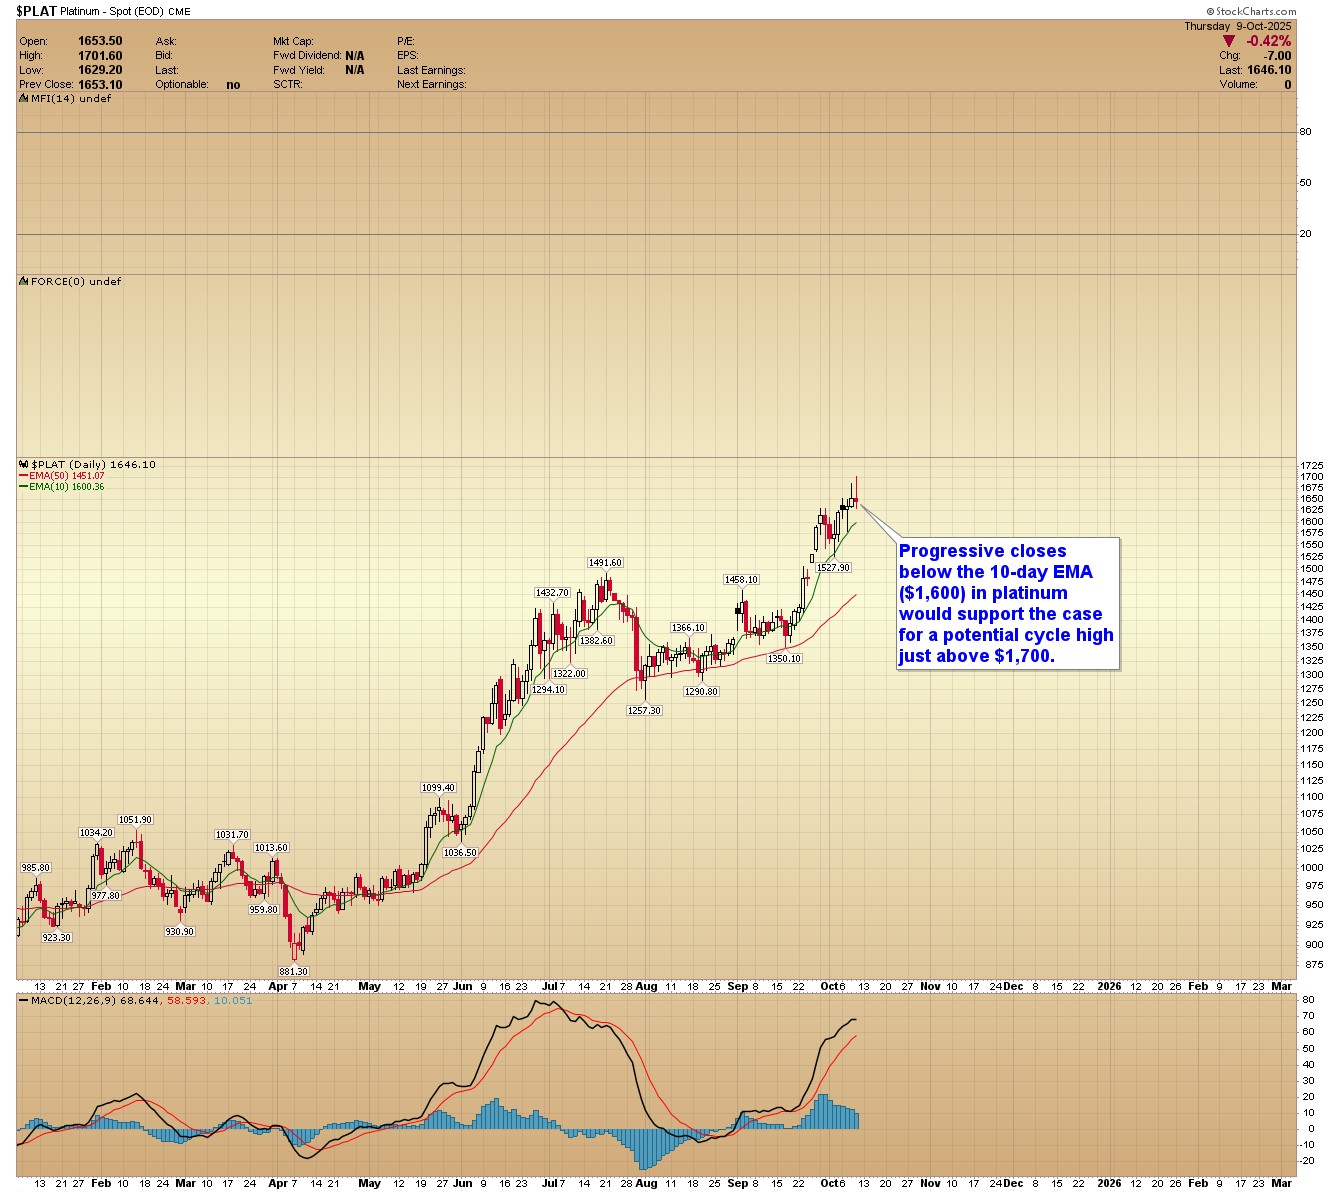
PLATINUM: Progressive closes below the 10-day EMA ($1,600) in platinum would support the case for a potential cycle high just above $1,700.
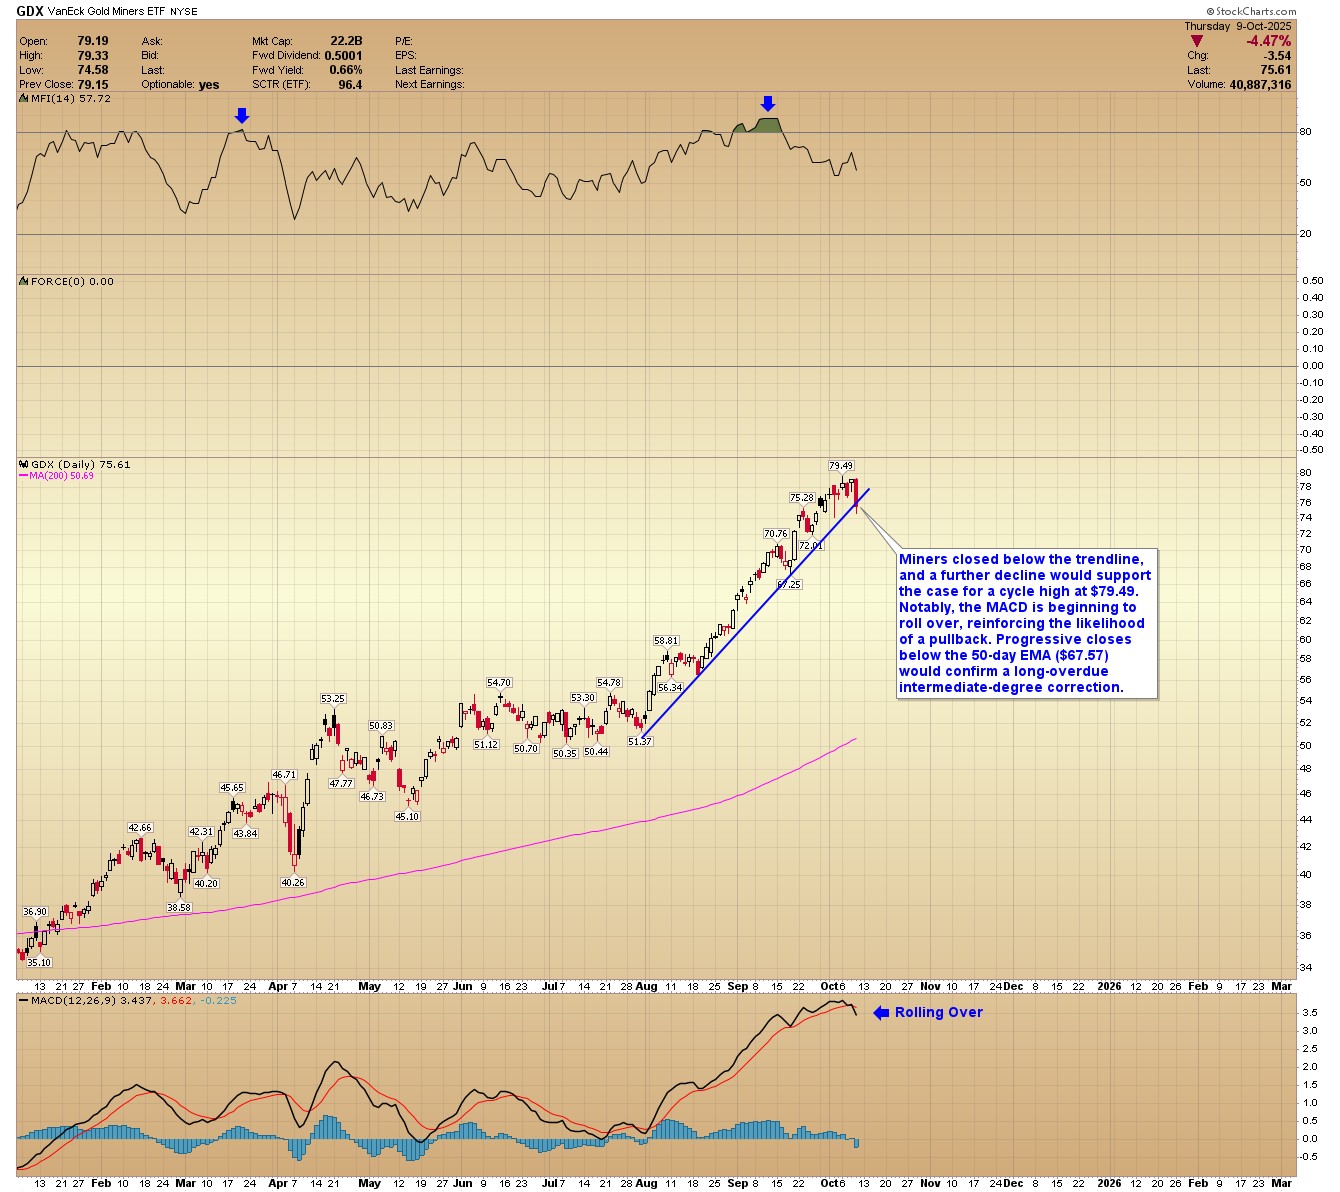
GDX: Miners closed below the trendline, and a further decline would support the case for a cycle high at $79.49. Notably, the MACD is beginning to roll over, reinforcing the likelihood of a pullback. Progressive closes below the 50-day EMA ($67.57) would confirm a long-overdue intermediate-degree correction. Note: prices soared 55% since the beginning of August.
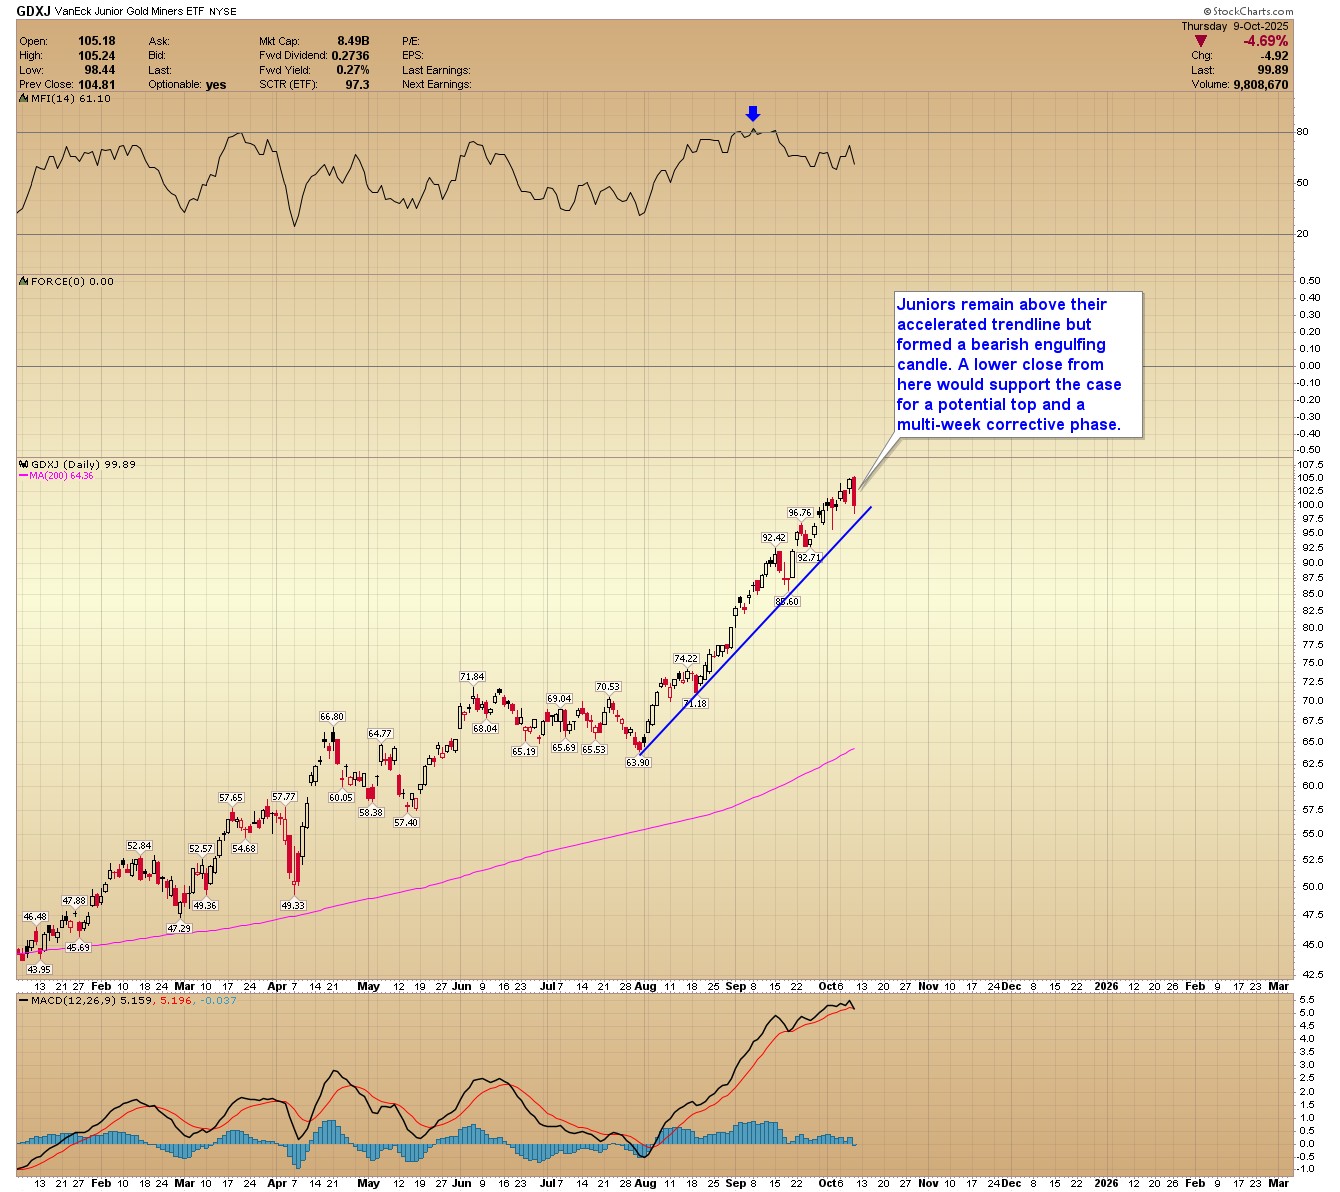
GDXJ: Juniors remain above their accelerated trendline but formed a bearish engulfing candle. A lower close from here would support the case for a potential top and a multi-week corrective phase. Note: prices soared 64% since the beginning of August.
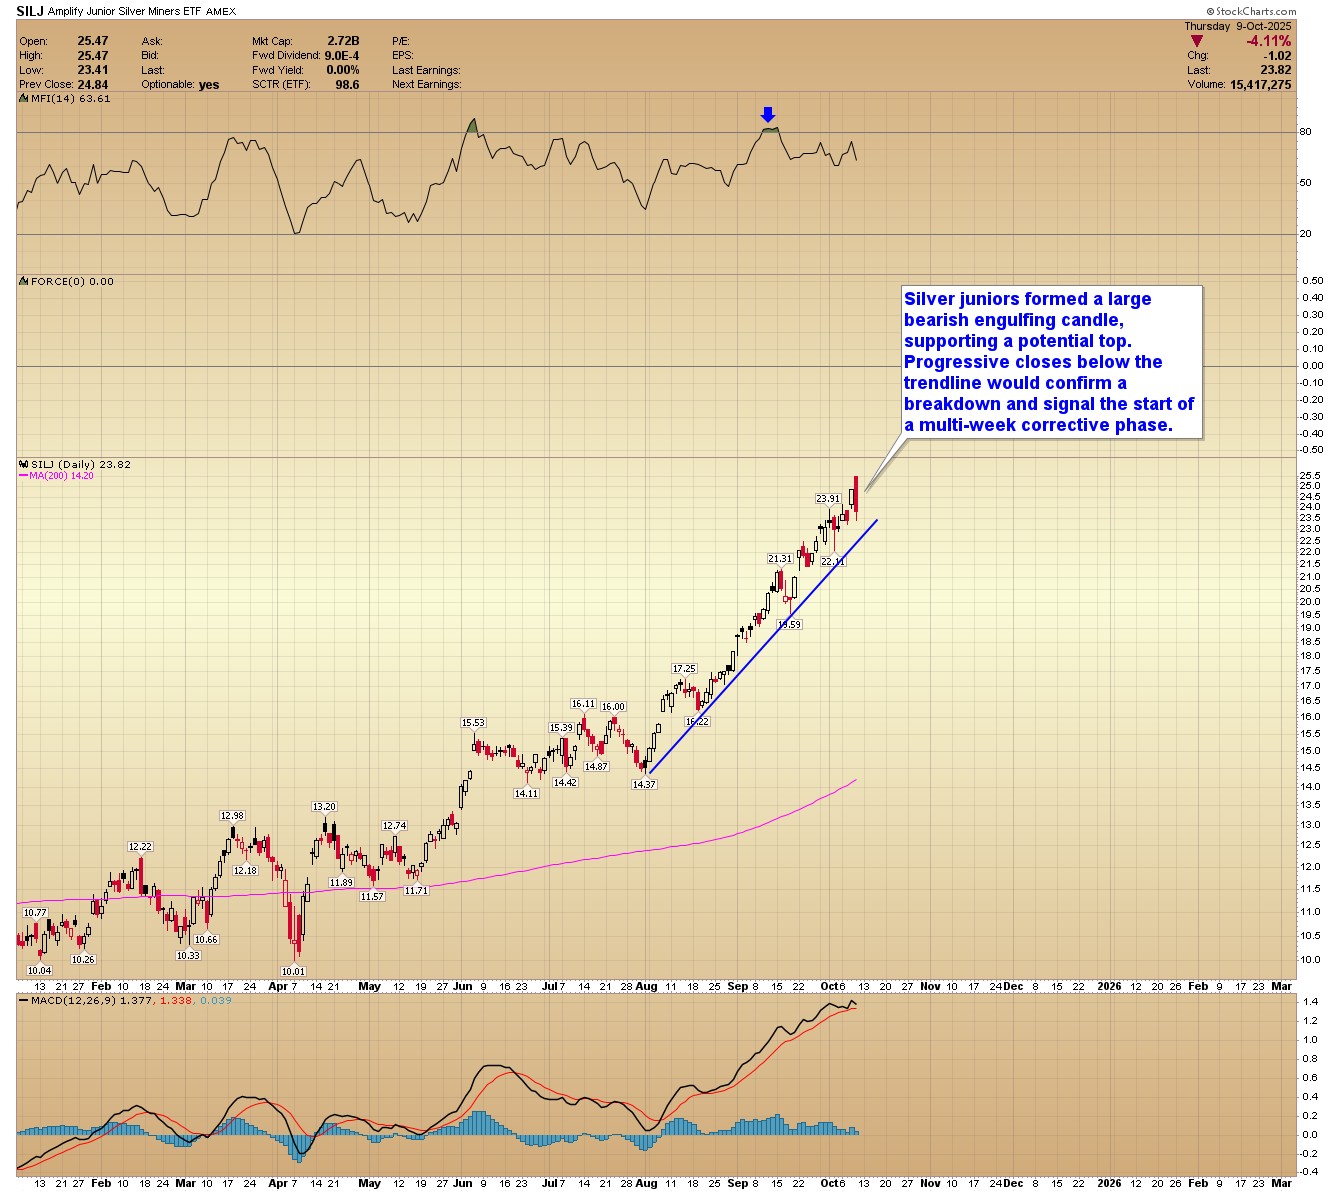
SILJ: Silver juniors formed a large bearish engulfing candle, supporting a potential top. Progressive closes below the trendline would confirm a breakdown and signal the start of a multi-week corrective phase. Note: prices soared 77% since the beginning of August.
In Closing
The price action is silver next week is crucial. If gold is indeed topping, historical patterns support the potential for a 20% pullback, which could bring prices down to the $3,200 to $3,300 range.
These are the key technical levels to watch in metals and miners over the coming weeks:
- Progressive closes below the 10-day EMA would support an interim cycle peak.
- A decisive break down below the 50-day EMA would verify a deeper multi-month correction resulting in the next buying opportunity.
We believe gold, silver, and mining stocks are entering the fourth inning of a secular bull market — one that could drive prices to extraordinary levels by the end of this decade. Silver is likely to see its most explosive gains during the final “blow-off” phase, with the potential for daily price surges of $10 or even $20.
AG Thorson is a registered CMT and an expert in technical analysis. For more price predictions and daily market commentary, consider subscribing at www.GoldPredict.com.
********


