Wall Street divided on gold’s near-term direction as Iran conflict rages, Main Street sentiment settles back down as markets await key inflation and growth metrics
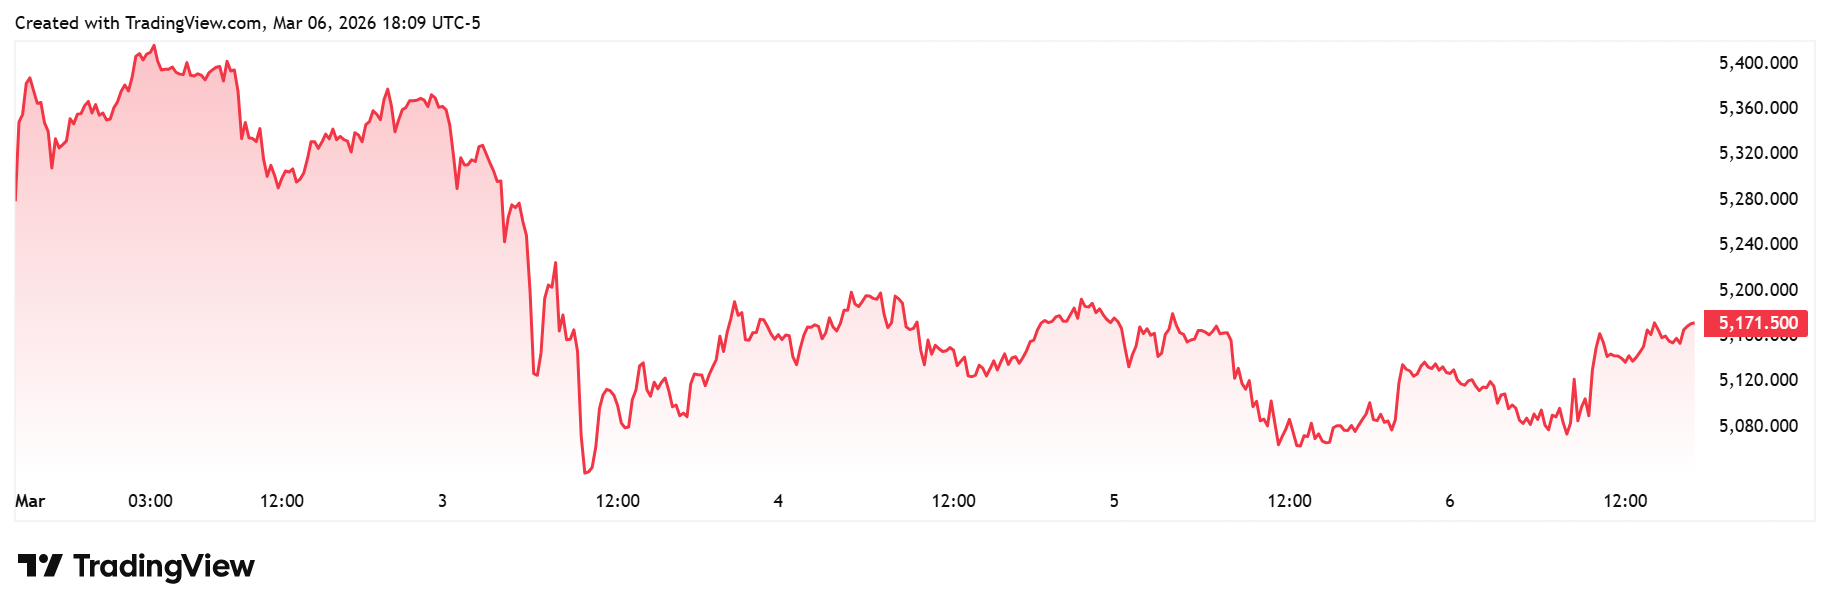
NEW YORK (March 6) Precious metals rode the roller coaster of shock and anxiety following the joint U.S.-Israeli strikes on Iran this week, with prices spiking above $5,400 per ounce early, but easing lower as the broader market mulled the potential ramifications of a new Middle East conflict.
Spot gold opened significantly higher at $5,348.15 early Sunday evening following the outbreak of hostilities the day before, and the initial momentum remained to the upside, with gold quickly rising to the weekly high near $5,420 per ounce by 3:15 a.m. Monday morning. But by the North American open, the yellow metal’s momentum was already flagging, with spot gold trading at $5,347 per ounce, and after a quick dip down to $5,290 just before noon Eastern, spot gold was back up into the high 5300s by 8:15 p.m.
However, after a second attempt to reclaim $5,400 per ounce failed at 11:15 p.m., gold took the proverbial escalator down, with the spot price declining to $5,289 at 1:00 a.m., $5,242 by 4:15 a.m., $5,126 6:15, and all the way to the weekly low below $5,040 per ounce 15 minutes after Tuesday’s North American open.
Now the precious metals market hunkered down and entered the consolidation pattern that would last the rest of the week.
After a quick bounce off the low, spot gold dipped back to $5,070 per ounce by 12:30 p.m. on Tuesday, and this level would act as support through the trading sessions that followed, with gold oscillating in a neat $100 range between $5,070 and $5,170 per ounce – apart from the occasional spike to test resistance at $5,200.
As the week dragged on, the U.S. dollar, oil, and other key markets adjusted to the daily flow of headlines out of the Middle East, but gold continued to churn sideways as metals traders were no clearer about the medium-term impacts of the new conflict on Friday morning than they were on Tuesday morning. By the time the Friday close rolled around, gold was trading right at the upper edge of its four-day consolidation pattern, finishing the week at $5,171.50 per ounce.
The latest Kitco News Weekly Gold Survey showed Wall Street undecided on gold’s near-term direction, while Main Street investors’ recent bullishness returned to the mean after gold’s weak week.
“Up,” said Rich Checkan, president and COO of Asset Strategies International. “After a good week of investors trying to discern the impact of the conflict in Iran on the gold price, I see investors easing back into the market. They will soon realize that war premiums are fleeting, short-term drivers of the gold price, but fundamentals are the long-term drivers.”
“Up,” said James Stanley, senior market strategist at Forex.com. “Sticking with the bullish bias, even though it was a rough week. The 5k support hold in spot has been clean so far and I think this could present a compelling value setup as we go into next week.”
“Up,” said Darin Newsom, senior market analyst at Barchart.com. “There will be selloffs, as seen recently, some incredibly wide-reaching, but it doesn’t change the fact the market is in a long-term uptrend. The occasional breaks are created by gold (and silver) running out of buy orders short-term, but new interest from global central banks and long-term investors is eventually uncovered. The question now is who the US president decides to bomb next. Keep in mind Canada has oil, which seems to be the catalyst for much of what we see today.”
Adrian Day, president of Adrian Day Asset Management, said markets are still digesting the implications of the Iran war, but the longer-term drivers that have propelled gold above $5,000 will soon reassert themselves.
“Geopolitical events usually have only a short-term impact, and usually in advance of the event as rumours swirl. Thus, gold rose over $500 in the week ahead of the U.S. and Israeli attack on Iran. It has given some of that back, and the next week will likely see some backing and filling as ‘sell the news’ continues. The Iran situation could deteriorate, of course, leading to another spike in gold, even as central banks have apparently (according to January numbers) eased their buying. On balance, we expect gold to be UP as the monetary factors that have driven gold for the past couple of years resume their lead.”
Colin Cieszynski, chief market strategist at SIA Wealth Management, told Kitco News that it’s not so much the gold price that’s moving these days, it’s the price of everything else.
“The underlying trend remains positive,” he said. “I can't go against it. It hasn't broken down; it's consistently getting support above $5,000. Yes, from day to day, gold gets impacted by swings in the US dollar, but the underlying trend remains intact.”
“Gold is doing exactly what it's supposed to,” Cieszynski said. “It's acting as a store of value and everything else is trading around it. Even if you look at silver, it’s way more volatile than gold. It's almost like gold's value is steady and everything else trades around it. That's what it’s doing, and that's what it does in these times.”
“That's why some days the US dollar is up, and some days it's down, but the underlying trend of the gold price is stable to positive against the US dollar, and that has not changed.”
Over the medium term, Cieszynski said the trend may be more sideways than upward. “But it's had a huge run,” he added. “A lot of this clearly was already priced into the gold price and the run up to $5,000. It may consolidate here, it may go higher; it depends what everything else does around it. But gold has been the stable core. Gold isn't seeing its value consistently eroded like the US dollar has for the last year. Gold has been the stable center of it all.”
Going forward, Cieszynski said markets are still grappling with the potential severity of the Iran conflict.
“The question is, has gold fully digested the idea that the war might go on longer than people have thought up until now?” he asked. “Maybe. It's hard to say. We don't know how long this is going to drag on for, or who might end up getting engulfed in it, or anything like that. Gold is just reflecting that. If volatility increases, then gold could go higher, and if peace breaks out, then gold could go lower, but it's really hard to say at this point, which is why it feels like it's found an equilibrium and we're waiting to get more of a sense of that.”
For next week, Cieszynski sees gold steady, with upside.
“I am neutral to positive on gold,” he said. “More positive.”
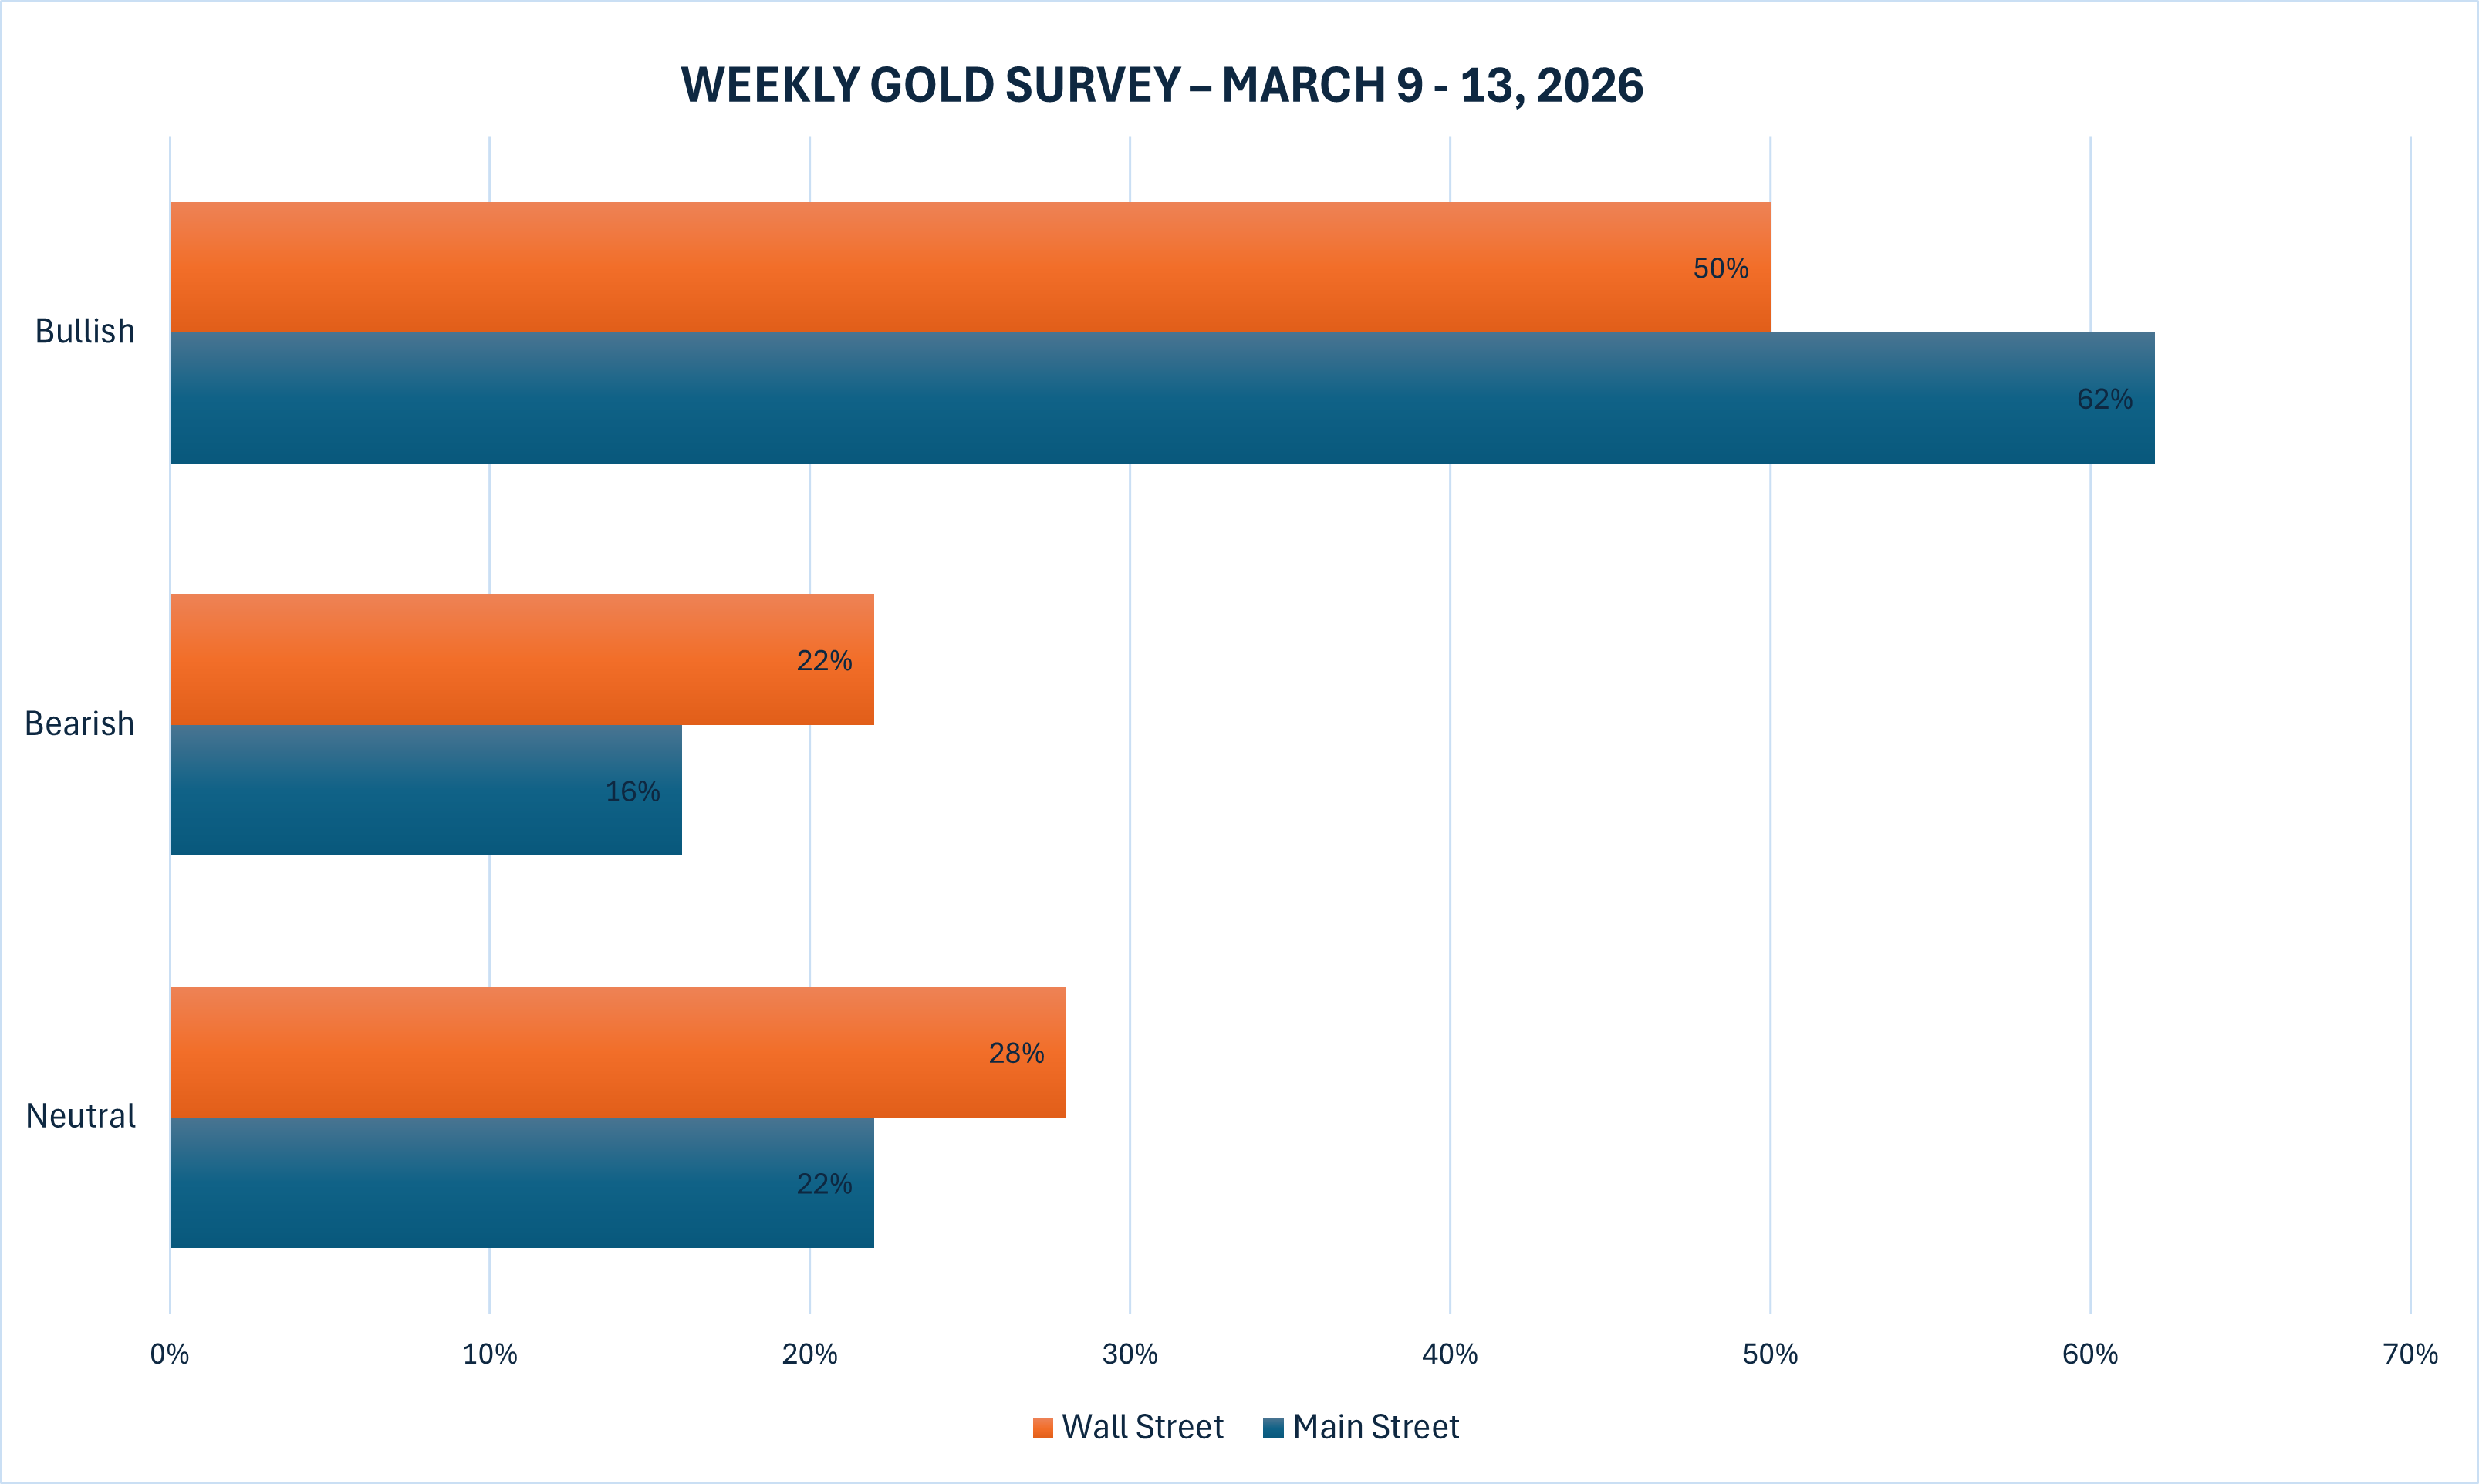
This week, 18 analysts participated in the Kitco News Gold Survey, with only half of Wall Street emerging with a bullish bias after gold’s loss of momentum. Nine experts, or 50%, expected to see gold prices move higher during the week ahead, while four others, representing 22%, predicted a price decline. The remaining five analysts, 28% of the total, saw the risks evenly balanced in the near term.
Meanwhile, 340 votes were cast in Kitco’s online poll, with Main Street investor sentiment returning to the low 60s where it had been since the early February selloff. 211 retail traders, or 62%, looked for gold prices to rise higher still next week, while another 56, or 16%, predicted the yellow metal would lose ground. The remaining 73 investors, representing 22% of the total, expected prices to continue consolidating during the week ahead.
Next week’s economic news calendar features important measures of inflation and growth, along with an in-depth look at the U.S. housing sector and the American consumer.
On Tuesday morning, markets will receive existing home sales for February, followed by the Wednesday release of the February CPI report. Then on Thursday, traders will be watching weekly jobless claims and housing starts and building permits for January.
Friday morning brings durable goods orders, Preliminary Q4 GDP, Core PCE, and JOLTS job openings, all for January, along with the University of Michigan preliminary consumer sentiment survey for March.
“The Middle East war has not been good for gold,” said Marc Chandler, managing director at Bannockburn Global Forex. “The nearly 3.7% decline in spot gold prices this week snapped a 4-week advance and is the biggest weekly loss since the week ending Jan 2. Interest rates jumped as the inflationary rise in oil prices dominated over the demand destruction of higher energy prices, and the market pushed out the next Fed and Bank of England cuts, while nearly pricing in an ECB rate hike before year end. A break of $5000 could see a push toward the $4850 area as longs are cut.”
Jesse Colombo, independent precious metals analyst and founder of the BubbleBubble Report, told Kitco News that gold is still consolidating after its big run-up from December to January.
“This bouncing around is still part of that cooling off period,” he said. “But it's benign and it's healthy, because nothing can go up in a straight line forever. And yet even within that pause, I would say it's behaved very well, because it rebounded pretty quickly from its lows in early February.”
Columbo also pointed out that gold’s price trend remains up. “If you look at the 200-day moving average for gold – and gold miners, and silver, really the entire precious metals complex – the 200-day moving average continues to slope upward, which means that the trend is up, that the bias is for continued upside. That’s the signal to buy the dips, and that pullbacks and corrections within this uptrend are most likely to be short-lived.”
“[Based on] everything I'm seeing right now, the trend is up,” he added. “It's just a pause within that uptrend.”
Columbo acknowledged that gold has been impacted by some liquidation selling as traders exit profitable positions to cover losses in other areas due to the Iran shock and the US dollar index spiking. “But I still see it as being in a solid position,” he said. “The secular bull market is definitely firmly intact.”
The recent strength of the U.S. dollar has also been somewhat overstated, he said. “The US dollar index is still in a range despite its recent appreciation,” Columbo noted. “If you look since April, it is still within that sideways consolidation between the 96 support and the 100 resistance levels, it keeps bouncing around within that. There is no trend right now for the dollar.”
“If the dollar does indeed break out above 100, I would say there's a higher likelihood of further appreciation of the dollar,” he added. “Or if it breaks below 96, I'd say we're going to see further weakness in the dollar. Right now, it's still within that trading range, so it's, there really is no trend in the dollar, believe it or not, despite what's happening in the short term.”
Columbo said that once the initial shock of the Iran strikes is digested, the technicals suggest a good chance that gold catches a bid.
“I just want to see what happens with this current consolidation, because it looks like another triangle may be forming,” he said. “Going back to late January, if you connect the recent peaks and then the recent lows, it looks like it's forming a triangle-type pattern. I want to see if that breaks to the upside.”
“If it does break to the upside, I believe that's going to point to gold hitting $6,000 fairly quickly.”
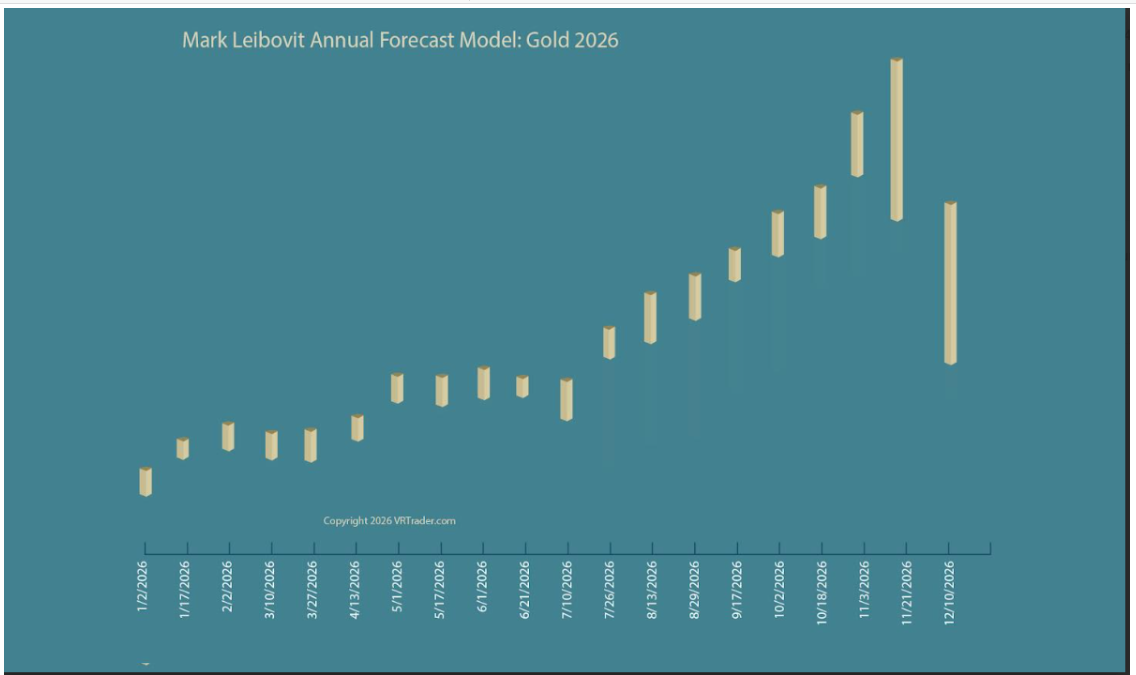
Mark Leibovit, publisher of the VR Metals/Resource Letter, shared the chart from his 2026 Annual Forecast Model for gold, which indicates a decline for the yellow metal next week.
Alex Kuptsikevich, senior market analyst at FxPro, told Kitco News that he sees gold prices falling once again next week.
“Despite rising demand for safe-haven assets, gold fell sharply this week, amid continued high supply at current prices,” he said. “Problems in the Middle East, a key centre for gold trading and refining, may have influenced this. The strengthening dollar and the decline in stock indices at the end of the week following US employment data created a natural headwind for gold. Traders are reducing margin positions and taking profits at levels that are still historically high and still have impressive returns compared to levels 12 and 24 months ago.”
“Since August last year, gold has repeatedly tested the support at its 50-day moving average,” Kuptsikevich noted. “It is currently trading near $4,900, and there is a strong likelihood that in the coming weeks, the price will not only reach this level but also make a serious attempt to continue its decline.”

Analysts at CPM Group issued a Buy recommendation on Thursday, with an Initial Target Price of $5,400 between March 6 and 13, and a Stop Loss at $4,980.
“Following the attack on Iran on Saturday, 28 February CPM reversed its 27 February expectation that gold prices might soften early this week, and renewed our projection of a spike to $5,400,” they wrote. “That price was pierced the following trading day, Monday, 2 March. Gold backed down after that initial reaction, but has traded above $5,000 over the succeeding four trading days.”
“CPM expects gold prices to remain high over the next week given the enormous range of enormous problems confronting the world.”
Michael Moor, founder of Moor Analytics, said he doesn't have a strong opinion on gold’s direction for week, but he was leaning bullish on Friday afternoon. “If we break below the formation mentioned below, we should come off,” he said.
“In a Higher time frame: I cautioned on 8/16/18 the break above $1,183.0 warned of renewed strength,” Moor said. “We have seen $4,443.1. This is ON HOLD. In a Medium time frame: The break above 31482 brought in $2,478.2 of strength. The trade above 32214 brought in $2,405.4 of strength. The trade above 32236 brought in $2,403.2 of strength. The trade above 32392 projected this up $115 (+)—we attained $2,387.6. The trade above 33411 brought in $2,285.7 of strength. The trade above 33850 brought in $2,241.8 of strength. The trade above 34186 brought in $2,208.2 of strength. The break above 35640 brought in $2,062.8 of strength. The trade above 36658 brought in $1,961.0 of strength. The trade above 37143 brought in $1,912.5 of strength. The break above 37725 brought in $1,854.3 of strength. The trade above 38828 brought in $1,744.0 of strength. These are ON HOLD.”
“On a lower timeframe basis: The break back above 45201 brought in $914.0,” he said. “The trade above 47972 brought in $639.9. The trade above 48570 projects this up 280 (+)—we attained $577.1. The trade above 49350 (-16 tics per/hour) projects this upward $100 min, $480 (+) max—we have attained $499.1. On 2/18 we left the bullish reversal warned about below—we have rallied $457.3 from the 49768 open. These are ON HOLD. The trade below 52554 (+15 tics per/hour) projects this down $220 minimum, $1,080 (+) maximum—we attained $250.4. The trade below 51740 (+10 tics per/hour) warns of decent pressure again—we have attained $115.1 so far. These are ON HOLD.”
“The break above 50751 (-36 per/hour) now warns of decent strength,” Moor added. “Decent failure below 50911 (+7 tics per/hour starting at 1:30pm EST) will project this down $95 minimum, $320 (+) maximum; but if we break below here decently and back above decently, look for decent short covering.”
And Kitco senior analyst Jim Wyckoff said safe-haven demand due to the Iran war has elevated risk aversion in the overall marketplace.
“Technically, April gold futures bulls’ next upside price objective is to produce a close above solid resistance at this week’s high of $5,434.10,” he said. “Bears' next near-term downside price objective is pushing futures prices below solid technical support at $5,000.00. First resistance is seen at $5,200.00 and then at $5,250.00. First support is seen at $5,000.00 and then at $4,900.00.”
At the time of writing, spot gold last traded at $5,171.50 per ounce for a loss of 3.67% on the week but a gain of 1.77% on the day.


