Barron's Confidence Index is Approaching Depression Conditions Levels


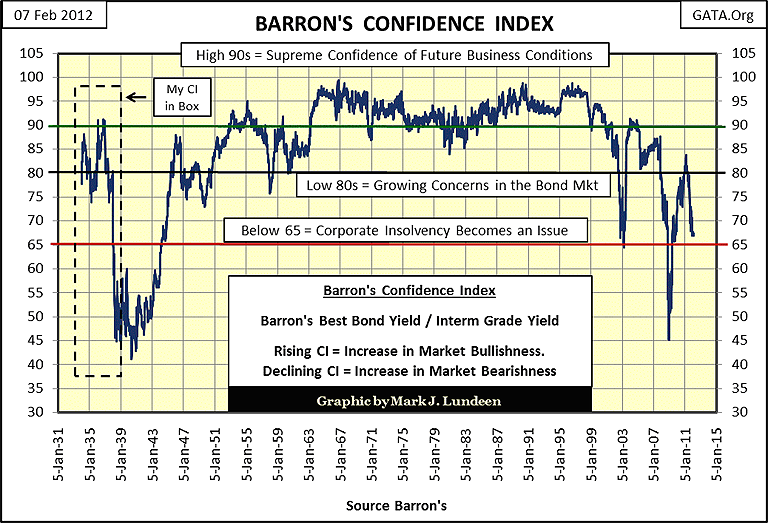
I haven't posted the Barron's Confidence Index chart for a while, so here it is. Since 1938, Barron's has computed its CI by dividing their Best-Grade Bond Yield by its Intermediate-Grade Bond Yield to derive the CI. I pushed the series back to 1934 using the yield from the now discontinued Dow Jones 40-Bond Average as a substitute for the Intermediate bond yield; both yield series were very close to each other. I derived my Best-Bond Yield by taking an average yield of ten bonds published in Barron's whose yields were close approximations to the first published value of Barron's Best Bond Yield in their 19 Dec 1938 issue. The Dow Jones 40 Bond Average yield goes back to 1926. Unfortunately, Barron's began publishing corporate bond prices and yields in their 01 Jan 1934 issue, so 1934 is as far as I could go.
The results of my improvised 1934-38 CI are impressive. From 1932-37, the markets saw an excellent recovery from their lows of 1932; so seeing my improvised CI above 80 from 1934-37 is something to be expected. Then from October 1936 to Barron's first published CI value in December 1938, the CI collapsed to 45 as the US economy, and Dow Jones entered into the second deep economic turndown of the 1930s. All-and-all, my five year extension in Barron's CI time-line is a valuable and timely addition to this venerable economic indicator.
But before I go any further with Barron's Confidence Index, I first must explain the difference between Best Grade and Intermediate Bond Yields before you can understand the importance of this data series.
Come summer, winter, spring and fall (economically speaking) there are always a few companies that prosper no matter what happens in the economy, but most don't. During the Roaring 1920s; Standard Oil of New Jersey (Exxon today) and General Motors, each appeared as prime credits in the bond market when business was booming. I don't have the needed bond data before 1934, but I expect the bond yields for these two companies would have been very similar to each other during the boom years of the 1920s. Confidence in a continuing boom of the 1920s was epidemic:
"The nation is marching along a permanently high plateau of prosperity."
- Irving Fisher, Yale University October 23, 1929
(6 days later Black Tuesday occurred)
Much like Alan Greenspan during the 1990s, Irving Fisher was the best known economist, and guru of growth in the 1920s. His economic statistical series were published in Barron's. On 23 October 1929, few doubted the validity of his above statement of perpetual prosperity, which he knew was based on credit expansion. However, in 1935 when he published his book "100% Money", he seems to have had second thoughts of the wisdom of credit expansion as a source of prosperity.
"Thus, our national circulating medium is now at the mercy of loan transactions of banks, which lend, not money, but promises to supply money they do not possess." - Irving Fisher, 100% Money
No data on the CI is available for the 1920s, but it must have been above 95, as bond purchasers of that era, like Doctor Fisher, assumed the good times would last forever. Considering the mind-set of the Roaring 1920s, risk premiums for General Motor's bonds (intermediate grade) must have compressed down to that of Standard Oil bonds (best grade) bond's levels. But the inherent risks in these bonds were very different.
Remember, mass production of automobiles didn't exist 30 years before 1920, making auto manufacturing in the 1920s' bull market a much favored high-tech growth sector that everyone had to own! Sound familiar? That the internal combustion engine was the transportation of the future was true enough, but that didn't mean that its pioneering manufacturers would be the long term beneficiaries of horseless transportation. To go from almost zero in 1900, and expand auto production exponentially in only three decades, the automobile industry assumed huge debts in the bond market to finance their growth. To service this debt, the auto industry had to sell new cars, which proved to be no problem during the Roaring 20s. However, the 1930s was no friend of high-tech growth companies with huge debts.
Unlike auto manufacturers, Standard Oil was an established giant of American business decades before Henry Ford invented the assembly line. Standard Oil was incorporated in Pennsylvania in 1868. In 1911 when it was broken up with anti-trust legislation, New York City had more horses than automobiles on its streets. The largest of the remnants of the old Standard Oil Company was Standard Oil of New Jersey (Exxon today), and its bonds were the best of the best as debt service was a negligible expense. Standard Oil's capital infrastructure (refineries, pipe-lines, etc) had been paid in full long before 1929. That, plus it funded its operations by cash flow on a product that people purchased daily in good times or bad. For most people, buying a new car in 1932 was on top of the list of things * not-to-do * during the Great Depression. But new car or old, the old Tin-Lizzy (Ford Model- T) still needed gas every few days and a regular oil change.
When the US economy fell into the Great Depression, the difference between best grade bonds (Standard Oil of New Jersey), and intermediate grade bonds (GM) became painfully evident to the holders of their bonds. Had Barron's published their CI in the early 1930s, I imagine their CI would have recorded its lows of the 20th century, as company after company fell into receivership because they couldn't service debts taken on during the boom-times of the Roaring 20s.
So what does the Barron's CI actually measure? The bond market's confidence; or fear of future economic conditions that American corporations must service their debts. Strangely, the CI's ability to anticipate future bull and bear bond markets is extremely poor. The Confidence Index * is not * a measurement of potential profit to be had by investors or money managers purchasing bonds, but the bond market's confidence that less than best grade bonds issuers can service their debts to term. In CI's chart above, I placed reference lines and text at CI levels I believe are strategic.
A CI above 90 indicates the bond market has an extreme level of optimism that debt laden corporations' can service their debts to term. In other words, business is booming, and the bond market sees no future economic difficulties. Corporations with less than stellar balance sheets (bonds found in Barron's Intermediate-Bond Yield Average) are borrowing money in the bond market at rates near best grade bonds to expand their future operations.
A CI in the 80s indicates a healthy skepticism of future economic conditions, causing risk premiums in intermediate-grade bond to expand. Every entrepreneur believes their product has infinite demand - the bond market knows better. Hopefully, this increase in project financing results in the cancelations of planned expansions of productive capacity by companies with weak balance sheets; companies that might not bear the increase burden of additional debt should the economy slow down. Here we see the bond market's negative feed-back mechanism needed to check productive expansion beyond economic demand. This vital market feed-back mechanism is currently disabled as the world's central bankers are now dictating bond yields.
A CI below 65 indicates the very real fear in the bond market of coming waves of bankruptcy and corporate-debt default that always result from significant, and prolonged economic declines.
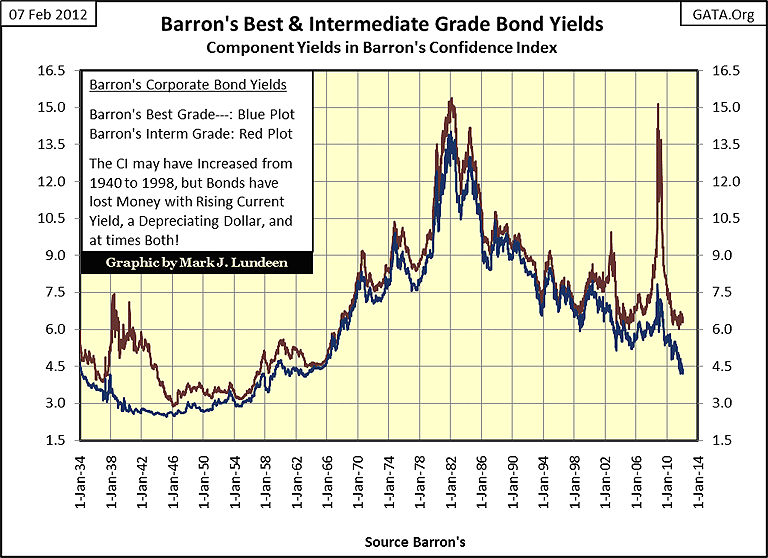
My next chart shows the Barron's yield series used in constructing the CI. The CI is computed by dividing the Blue Plot (Best Grade) by the Red Plot (Intermediate Grade) seen below. As I said before; the CI has little value for predicting bull and bear markets for bonds. The CI increased from the low 40s in 1940 to an amazing 99 in 1966, as bond yields doubled and consumer prices increased far above their pre-war levels. So, not only did bond valuations decline after WW2, but the dollars they were valued in continued to purchase less. Then from 1966 to 1981-82, consumer prices increased to double-digit rates by 1979 as all bond yields (including US Treasuries) saw double-digits current yields. One only has to look at Barron's US Treasury Bond table to see US T-Bonds issued from that era with double-digit coupons trading in the bond market today. But during the 1970s and early 1980s, investors in bonds hemorrhaged money; however the CI never fell below 80 because the bond market estimated that most bond issuers would survive the inflationary 1970s & early 80s, and pay their debts in ever cheaper dollars.
Remember, the CI does not concern itself with the profits or losses of bond holders, just the likeliness of intermediate-grade bond issuers to stay in business, and servicing their debts. This makes Barron's Confidence Index an economic, * not * a bond market indicator.
Why did bond yields explode from the late 1940s to the early 80s? For the same reasons bond yields * should * be going up now; the Federal Reserve was recklessly "injecting" too many dollars into the banking system. This inflationary fact was also true after 1981 to the present, but the inflationary flows from the Fed shifted channels in 1982; from consumer prices into financial asset valuations. Since 1920, this has happened several times.
Below we see data that has been published weekly in Barron's for many decades, with Currency in Circulation (CinC = dollars in circulation) going up in good times and bad. The world loved Greenspan as his inflation (green plot) flowed into the Dow Jones (red plot) and high-tech stocks. But the world will come to hate Bernanke, as his inflation will ultimately flow into consumer prices (blue plot), as asset prices eventually deflate.
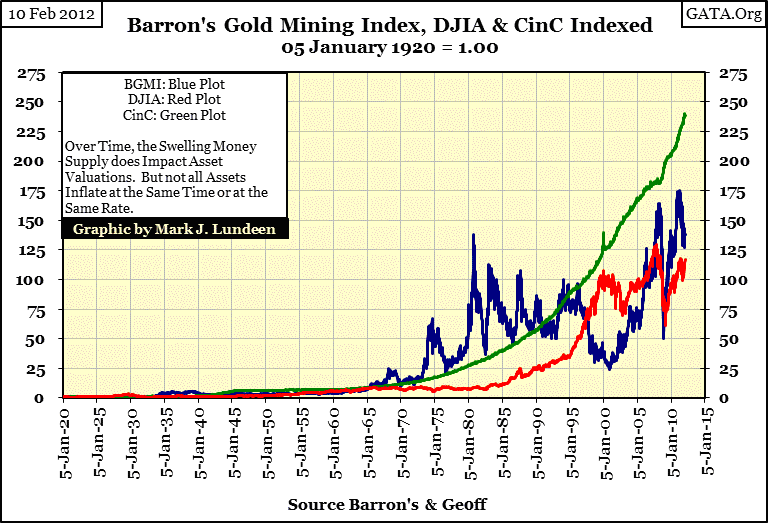
Price inflation of financial assets destroys the value of historical price data. Previous to August 1971, when the US defaulted on the Bretton Woods' $35 to an ounce gold peg, little can be made of the data above. But making the prices of the Dow Jones and Barron's Gold Mining Index (BGMI) ratios to the always increasing CinC, we see the flow of inflation shifting into the BGMI (a proxy of consumer prices), and the Dow Jones (a proxy of financial assets) several times since 1920.
You will never see the chart below on CNBC or Bloomberg TV, but the only 20th century Dow Jones bull market that exceeded the rate of inflation from the Federal Reserve occurred during the 1920s. This is a disquieting fact to most people who have invested in the stock market for decades for the purpose of funding their retirements. But to most people, if they are honest, they are now less well off than they were a decade ago because of what the Federal Reserve does in the economy - inflate the money supply to maximize profits for the banking system. Where do you think all that money used to finance mortgages, and second mortgages a few years back came from? The Fed and its banking system!
You should also note that the BGMI is typically countercyclical to the Dow Jones, as gold and gold miners naturally prosper during times of increasing consumer prices. If the past is prologue, gold, silver and their miners have one heck of a bull market ahead of them.
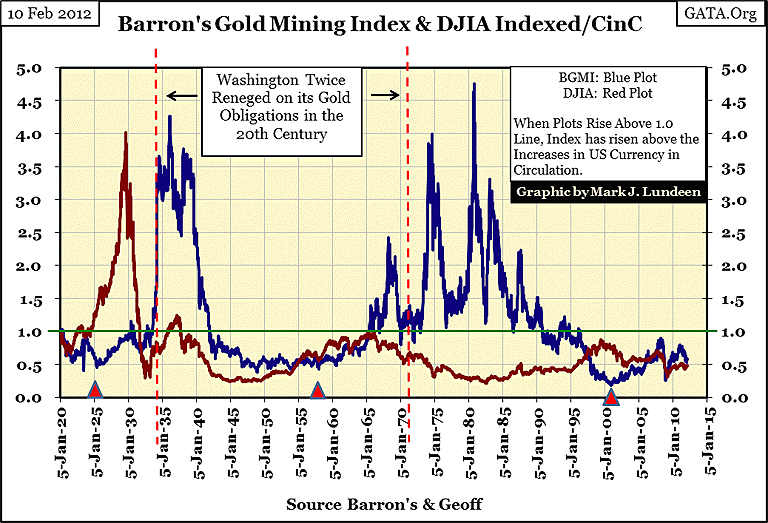
After the top in the Greenspan High-Tech market (January 2000), I suspect that if the "policy makers" had allowed the market to follow their natural course, as their Federal Reserve continued its recklessly expansion of the money supply, bond yields today would all be double digit. My reasoning for this is that from 1971 to 2001, the trend in the price of gold was a leading indicator of US Treasury long bond yields.
I placed red-dashed lines in the chart below at key trend changes in the price of gold. The relationship between trend changes of the late 70s to the late 80s between gold and T-Bond yields are not instantaneous, or proportional, but are there. After October 1987, to 2001, both gold and Treasury yields trended down together.
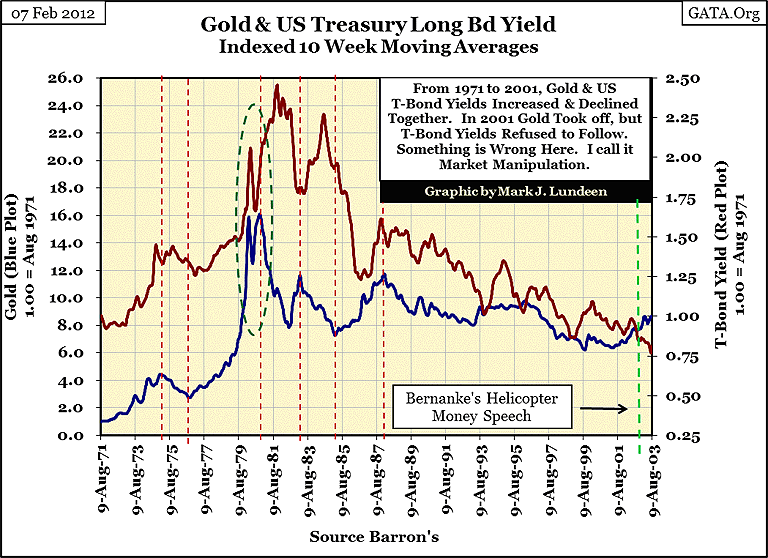
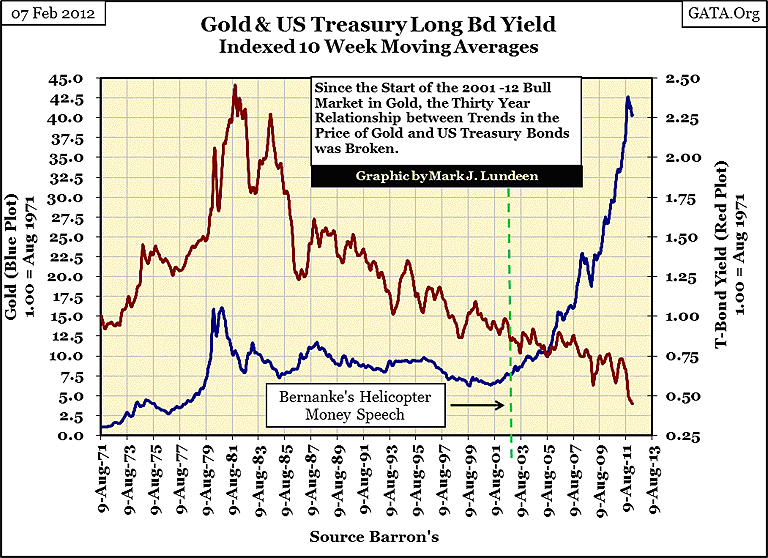
But this thirty year relationship didn't survive long after Doctor Bernanke's Helicopter Money speech, as we see in the chart below. The actual title of the Doctor's speech was: "Deflation: Making Sure 'It' Doesn't Happen Here" was delivered a month after the 2000-02 high-tech bear market bottom. The context is clear; Doctor Bernanke promised to use the one tool the Fed has, the power of its monetary-printing press to prevent the valuations of financial assets like stocks, US T-bonds and mortgages from "deflating" should he be selected as the successor to Doctor Greenspan as Chairman of the Federal Reserve. He did succeed Greenspan, and he kept his promise to Wall Street, who loves the guy for all he does for them.
"If we learned anything from 2008, it's that liquidity is the key variable. Liquidity flowing into the system cures a world of ills."
- Mitchell Stapley, the chief fixed-income officer at Fifth Third Asset Management. 07 Feb 2012
Well, if money managers applaud Doctor Bernanke's anti-deflation "policy" of inundating the financial markets with "liquidity", the rising price of gold is flashing an unambiguous warning of financial disaster to come.
We are currently seeing the largest bubble in the history of mankind, a bubble in the world's massive bond markets. I'm not the only guy concerned of central bank machinations in the global fixed income markets.
I'm not smart enough to time the market; and those who try calling market turns find it's a bad habit that's easy to break. But take a moment and revisit my chart of Barron's CI, and compare that to the charts above plotting gold and T-bond yields. To my eyes, something significant changed in the wake of the Greenspan High-Tech market bubble top of January 2000. The CI now has that 1930s' look to it, and the spread between the price of gold and US T-bond yields in the chart above has only widened in the past eleven years, as America's central planners continue their quest to slay their dragon-of-deflation with massive "injections" of "liquidity". Something big, bad, and really ugly is lying in wait somewhere ahead of us; yep - Mr Bear and his financial market clean-up crew.
We all like a pat on the back for a job well done. So I think we all owe something to Barron's statics department, without whose dedication in recording dry statistics from one decades to the next; boring old-fashion market statistics that since 1980 have been mostly ignored by the public as well as Barron's columnist and editors. I dare say that I'm the only person on the planet Earth who currently studies Barron's CI, Barron's 50 Stock Average, and other Barron's proprietary data series that span many, many decades.
My concern is that Barron's is largely ignorant of the treasure trove of economic and market data they've published over the decades; and what you don't use - you lose. So if you find my work analyzing Barron's historical data useful in understanding market and economic trends, use the link below to show a little appreciation for the continued publication of their CI & EP, and the importance of Barron's statistics in general.
We don't want Barron's to lay off their statistics guys to cut costs if things get really tough - do we? No we don't! So take a moment and say thank you for a job well done.
Mark J. Lundeen
11 February 2012


