The Bear Indicator Never Lies
 share
share
 share
share
 share
share
 share
share
 share
share
In the September 10 column entitled, “The bear makes a welcome return”, we discussed the return of the infamous bear image on the front cover of several news magazines and newspapers. The most conspicuous example of the bear could be seen on the front cover of Businessweek magazine, shown below.

From a contrarian’s perspective, this was a most welcome return for it strongly suggested that the bottom would soon be in for the stock market after the August decline. As I observed, “From a contrarian standpoint it doesn’t get any more emphatic than this.” Since then the major indices have rallied off their lows with some even making token new highs (e.g. the NASDAQ 100). I’ve never heard of a manifestation of the bear cover indicator failing to mark a decisive market bottom, and this time proved no exception.
Now that the Dow Industrials and the S&P 500 index have rallied back to the February-July resistance zones, should we expect a resumption of the selling pressure that plagued the market this summer? Or should we rather expect a period of consolidation (i.e. backing and filling) and eventually a breakout to new highs? As always, the answer to that question will be answered by the market itself but the current weight of evidence does provide us a meaningful clue as to the most likely outcome.
Before we look at the evidence, it’s worth making an observation about the previous sell-off. What happened to the stock market over the three days between August 20-24 qualified as a classic selling panic, as opposed to a fundamentally-driven crash or credit episode. This distinction is important, for if true it will make the difference between entering a bear market in 2016 and continuing with the bull market that began over six years ago.
A market panic is catalyzed by an adverse and extreme reaction to a news event. In the August sell-off it was the currency devaluation in China that panicked investors into selling. One thing that history consistently has shown is that true selling panics are usually retraced in short order once the fear subsides, i.e. usually within a couple of months. The less time it takes for the major indices to recover their losses, the less likely the selling was fundamentally driven. Hence, a true selling panic isn’t typically the precursor of an imminent bear market.
It’s also worth noting that the market’s present internal condition is virtually in complete contrast to what it was earlier this summer heading into the August panic. Prior to the summer swoon, the market’s extremely weak breadth could be seen on a daily basis for weeks on end. From June onward the number of NYSE stocks making new 52-week lows each day was extremely elevated and showed that the market wasn’t internally healthy. Moreover, this showed up in the NYSE internal momentum indicators (which are based on the new 52-week highs and lows). Most of those indicators were in decline as I mentioned earlier this summer.
Since the August bottom, the situation has reversed. The number of new 52-week lows has been drying up since September and have numbered less than 40 for most days since Oct. 5. The NYSE internal momentum indicators are now mostly in a rising pattern as opposed to the declining pattern before the August crash. Below is a chart showing the six major component of the Hi-Lo Momentum (HILMO) index. Only the longer-term component (orange line) is still in decline; the others are either rising or bottoming, in the case of the dominant interim indicator (blue line at bottom).
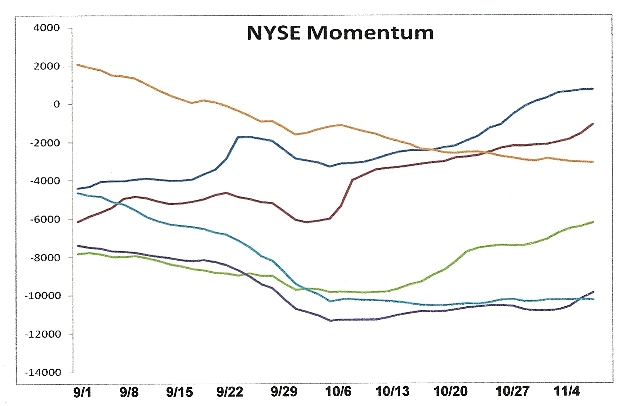
These indicators are very important because they show the stock market’s near-term path of least resistance. There is at least one fly still in the ointment, namely the longer-term internal momentum indicator which is still declining, as already mentioned. But all the other indicators – short-term and intermediate-term – are rising. This implies that the bulls currently have the advantage and that the heavy internal selling pressure which characterized the stock market this spring and summer is not an issue right now. This doesn’t preclude another (potentially sharp) pullback between now and year’s end, but the market’s main uptrend should remain intact.
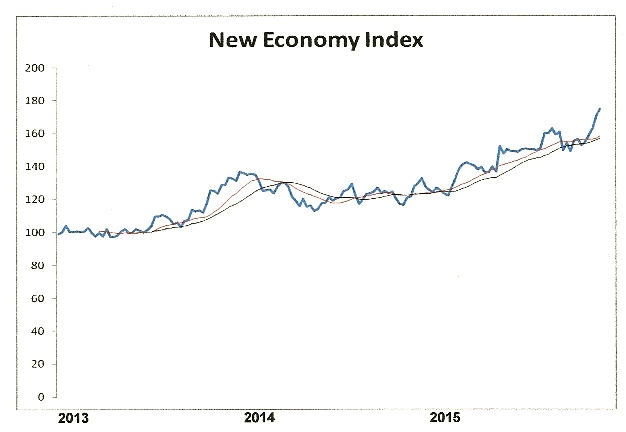
Also worth mentioning is that the New Economy Index (NEI), our in-house measure of how strong or weak U.S. retail spending is, hit a new all-time high last Friday, Oct. 30. Although business owners remain worried over growth prospects, mainly because of overseas woes, consumers don’t seem the least bit concerned. They just keep spending as the NEI chart suggests (below). What’s more, we’re about to enter the critical holiday season when retail sales typically hit their highest levels.
After a major decline in the stock market it always pays to monitor the sectors and industry groups for signs of relative strength. When, for example, the Dow Jones Industrial Average makes a series of lower lows during the final stage of a decline and certain individual stocks make higher lows, that’s a tip-off that informed buying is likely taking place. When the market turns up again and these individual stocks continue leading the market, that confirms it. At the bottom of the August panic, the industry groups which showed the greatest resilience to the decline were water, defense, and broadline retail stocks along with toy companies.
Among Dow Jones industries currently showing exceptional relative strength are: Broadline Retailers (DJUSRB), Business Training and Employment (DJUSBE), Consumer Finance (DJUSSF), Defense (DJUSDN), Leisure Goods (DJUSLE), Restaurants and Bars (DJUSRU), Software (DJUSSW), Toys (DJUSTY), and Water (DJUSWU). This group of industry leaders is very much in keeping with the bullish consumer spending patterns we’ve seen reflected in the New Economy Index lately.
There are, however, some industries that are conspicuous laggards which are close to their yearly lows. If these industry groups don’t improve soon it could pose a problem at some point in 2016. Not surprisingly, most of them are commodity and industry related and were heavily impacted by this year’s global economic slowdown. They aren’t likely to a pose a problem for the balance of 2015, however, especially if they remain within their 2-month holding patterns. They include: Aluminum (DJUSAL), Coal (DJUSCL), Healthcare Providers (DJUSHP), Mortgage Finance (DJUSMF), Pipelines (DJUSPL), Steel (DJUSST), Railroads (DJUSRR), and Recreational Products (DJUSRP).
If commodities can establish a bottom in the next couple of months, particularly crude oil, then the global economic woes of 2015 are far less likely to be of concern to the U.S. in 2016. Moreover, if the stimulus measures of the ECB and China continue the global economic slide will likely be halted next year.
********
Mastering Moving Averages
The moving average is one of the most versatile of all trading tools and should be a part of every investor’s arsenal. Far more than a simple trend line, it’s also a dynamic momentum indicator as well as a means of identifying support and resistance across variable time frames. It can also be used in place of an overbought/oversold oscillator when used in relationship to the price of the stock or ETF you’re trading in.
In my latest book, Mastering Moving Averages, I remove the mystique behind stock and ETF trading and reveal a simple and reliable system that allows retail traders to profit from both up and down moves in the market. The trading techniques discussed in the book have been carefully calibrated to match today’s fast-moving and sometimes volatile market envipolment. If you’re interested in moving average trading techniques, you’ll want to read this book.
Order today and receive an autographed copy along with a copy of the book, The Best Strategies for Momentum Traders. Your order also includes a FREE 1-month trial subscription to the Momentum Strategies Report newsletter:
share
share
share
share
share


