Bonds Bull or Bear?


Introduction
The feds have made it very clear that rates are going higher. No kidding. They have been going up, and will be going up more. And normally, this would be very bearish for bond holders. But we are not living in a normal time. Short rates no doubt have been sky rocketing, but long rates are actually down, thus resulting in a fairly flat yield curve. For average investors, they have been scared out of the bonds on fear of rising interest rates, and that is totally unjustified and unnecessary. Before I show you why you should buy bonds, let's take a look at both long and short rates.
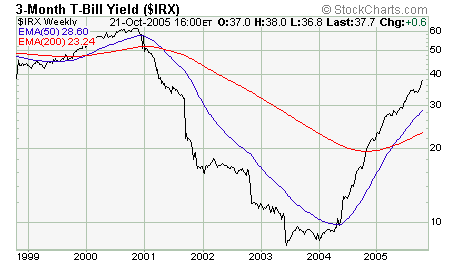
Short term rates - sure, no doubt about it. Short rates plummeted from 2001, as the Feds was fighting off a series of events beginning with the tech bubble burst, then 9/11 and the after math. When the markets began to recover in 2003, the Feds decided to ease off, and then began to tighten in 2004, and despite eleven consecutive rate hikes of quarter point each, we are still no where near the level when the easing began in 2001. As we can see clearly from the chart above, short term rate is in a bull market and the trend is up.
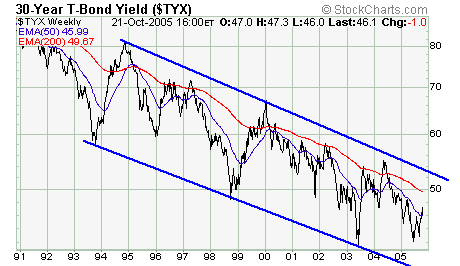
Long bond yield - surprise! All that fear of rising rates has done nothing to change the major trend of the long term rates; in fact, the 30 year bond yield has been declining since 2004, opposite to what short term rates were doing at the same time. Although we are seeing a bounce off the low in June this year, long term rates will remain low until this twenty five year cycle has reversed, and we'll know that when this multi year down channel is broken, and a new up cycle will begin. Therefore, bonds remain attractive and we should be looking for buy signals to add to bond holdings or an entry point for new money.
October 24, 2005
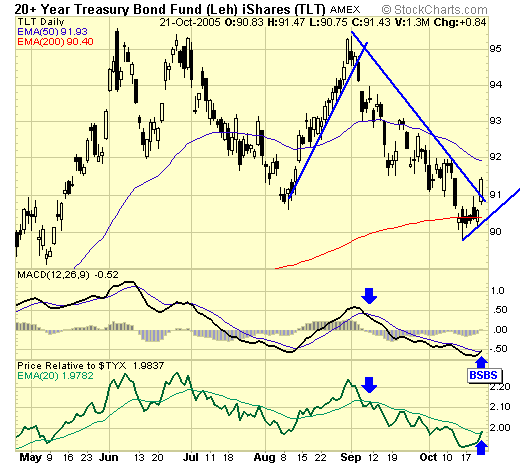
TLT - and such an opportunity has come. We have a buy signal as of 10/21 on TLT, which is an ETF for the Treasury bond. The chart shows clearly the top in June, confirming the bottom of the $TYX from previous chart. The sideways correction since the June top has brought prices down to the 200ema support, which according to our trading model, is a buy signal when resistance is broken at this level. Buying at current price with a stop below the 200ema support is risking about 1%, with upside potential of a new high; the risk/reward in this trade is very favorable.
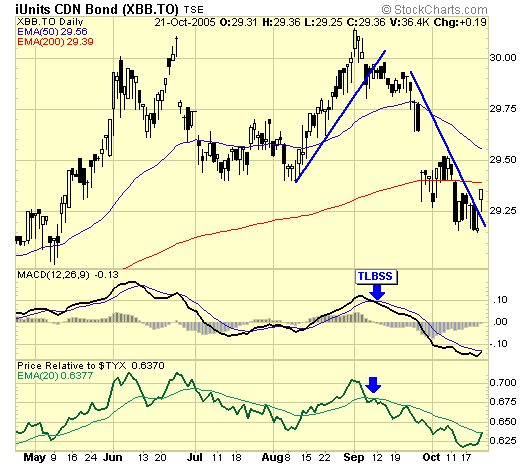
XBB.TO - the Canadian version of the TLT has similar favorable set up, buying at current price with stop at $29.10 is risking 1%, with upside potential of a new high. The XBB does not have a buy signal yet, but that should happen in a day or two as long as price remains above current low of $29.15.
Summary
Unlike the sectors I cover, the bonds are not fast moving vehicles, but since all three sectors are on a down cycle, this is not a bad place to park your cash. And quite often, a rally in the bond market is a precursor to a substantial decline in the equity markets. After all, smart money is always looking for safety and favorable returns.
Jack Chan at www.traderscorporation.com
23 October 2005

Jack Chan is the editor of Simply Profits, established in 2006. Chan bought his first mining stock, Hoko Exploration, in 1979, and has been active in the markets for the past 37 years. Technical analysis has helped him filter out the noise and focus on the when, and leave the why to the fundamental analysts. His proprietary trading models have enabled him to identify the NASDAQ top in 2000, the new gold bull market in 2001, the stock market top in 2007, and the US dollar bottom in 2011.


