Broad US Market Update As The Inauguration Of Trump Approaches


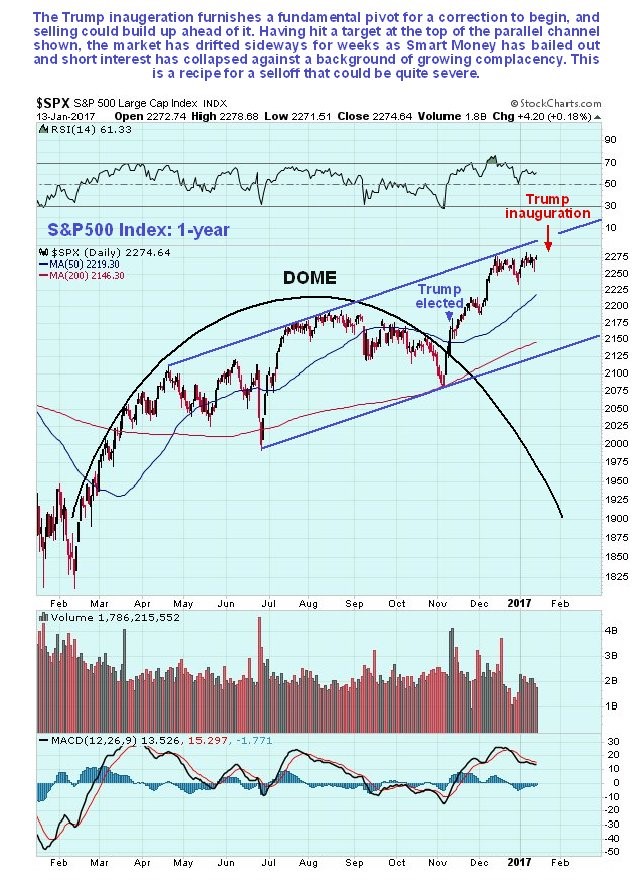
The election of Donald Trump sparked a rally in the broad stock market which has continued up to the present, and according to the laws of reverse (inverse) logic that rule the markets, his inauguration as President is likely to trigger a swoon, and as we will shortly see, there are other compelling technical reasons for the market to drop back soon, and it is worth noting that selling might start kicking in before the inauguration.
On the 1-year chart for the S&P500 index we can see that the breakout from the fine Dome pattern that developed during most of last year was caused by the election of Trump, and therefore, since the ensuing rally looks like the product of inflated and possibly unrealistic hopes regarding what Trump will go on to achieve, there is plenty of scope for disappointment, which psychologically is probably going to set in anyway once hopes of him becoming President become reality. Since many regard him as crass and a buffoon, which reputation he has done little to diminish in recent days, you may wonder why he was granted the nomination for leader of the Republican Party before the election, and Bernie Sanders was “sold down the river”. The reason appears to be that the Establishment wanted their stooge Hillary elected, and they calculated that if they presented an alternative who was so outlandish and “beyond the pale” as to be unelectable, Hillary would win, but unfortunately for them their little plan backfired, in large part because Trump’s unguarded remarks and statements were a breath of fresh air after years of politicians not saying what they were thinking and trying to be politically correct all the time. Returning to the chart we see that the S&P500 kept on rising until it reached resistance at the top of the parallel channel shown that dates back to last Spring, after which it has run off sideways in a narrow range, with downside risk growing.
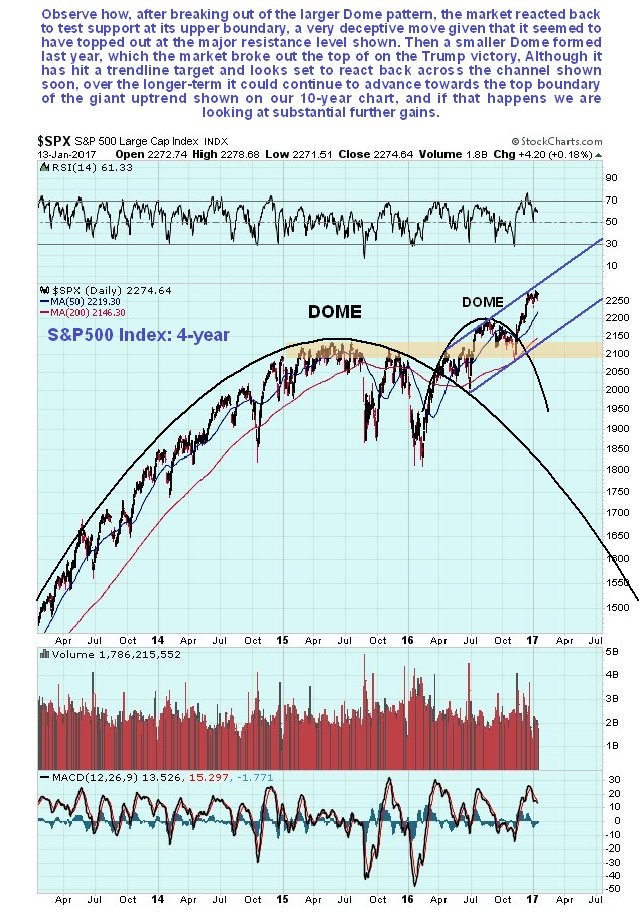
The 4-year chart provides broader perspective. On this chart we can see that we are a long way from being in a bear market, since the market has recently made new highs, moving averages are in bullish alignment and there is no overhanging supply. Last year’s Dome pattern followed a much larger one, so that they look like 2 Russian dolls. The market would have to break down from the parallel channel shown before we can even start to think about the possibly of a bear market setting in.
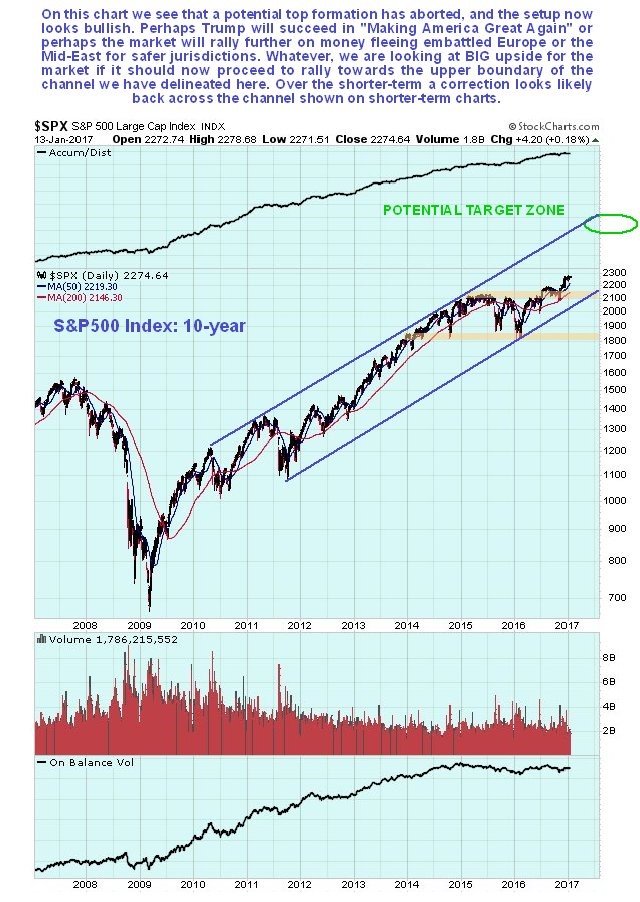
The long-term 10-year chart actually looks bullish, as the market has advanced to clear new highs, following the abort of a large potential top area, and appears to be in position to advance towards the upper boundary of the giant parallel channel shown, which would result in big gains from its current level, even though other factors are pointing to a drop over the short to medium-term. A breakdown from this large channel would be a serious negative development, so we should on the lookout for this.
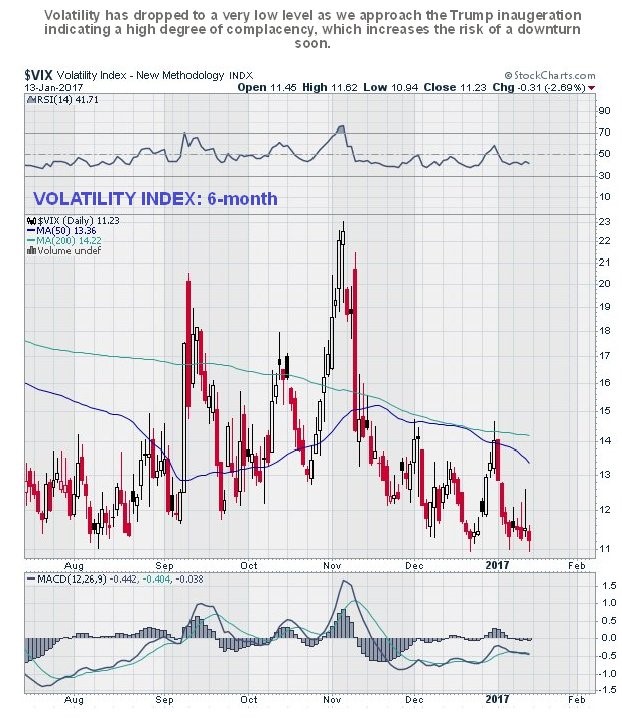
Various indicators are pointing to a market swoon over the short to medium-term, with the Trump inauguration being the obvious catalyst, and it could start ahead of the inauguration. We will now look at them.
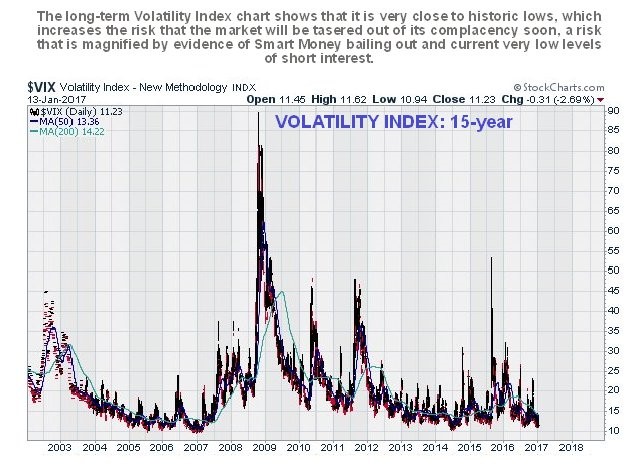
First is the Volatility Index or VIX, which is at a very low level, near to the levels seen in 2007 before the bear market started, meaning that market participants are feeling very laid back and complacent – virtually no-one expects the market to drop back much, which makes it that much more likely that it will.
You can see how low VIX is historically on its 15-year chart…
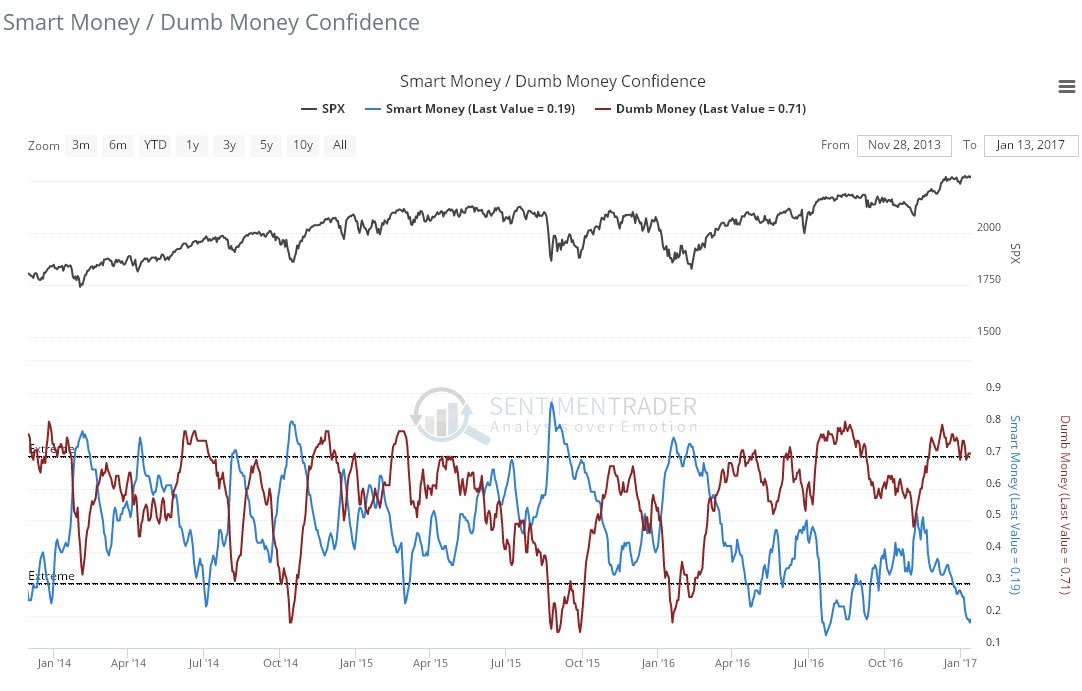
Next the Smart / Dumb confidence index on which we see that Smart Money has made its way to the exits in recent weeks. This normally happens as a market continues higher, but on this occasion it has happened as the market has moved sideways over the past month, which is rather unusual but certainly not positive. While it is hard to use this indicator in isolation for timing purposes, taken together with the other factors we are reviewing here, the case for a reversal soon looks quite solid.
Click on chart to popup a larger, clearer version.
Chart courtesy of sentimentrader.com
Finally we see that short interest has plunged in the recent past, a sign that bears are “throwing in the towel”. This is bearish because a shrunken short interest means that there is little short-covering fuel to power a rally.
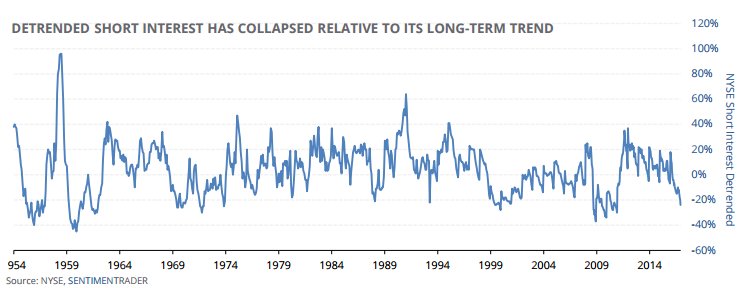
Chart courtesy of sentimentrader.com
So, as we approach the inauguration of Trump, let’s sum up the important factors we have observed here that point to a significant market drop soon. They are: the market arriving at a trendline target early in December and then running off sideways in a narrow range, the VIX at a very low level showing extreme complacency, Smart Money confidence sinking to a very low level – they have booked a lot of profits over the past month or so, and finally short interest shrinking to a very low level, showing that they have at last been beaten into submission, which usually happens at the worst possible time (for them).
We will review a selection of bear ETFs this coming week.

Clive P. Maund’s interest in markets started when, as an aimless youth searching for direction in his mid-20’s, he inherited some money. Unfortunately it was not enough to live a utopian lifestyle as a playboy or retire very young. Therefore on the advice of his brother, he bought a load of British Petroleum stock, which promptly went up 20% in the space of a few weeks. Clive sold them at the top…which really fired his imagination. The prospect of being able to buy securities and sell them later at a higher price, and make money for doing little or no work was most attractive – and so the quest began, especially as he had been further stoked up by watching from the sidelines with a mixture of fascination and envy as fortunes were made in the roaring gold and silver bull market of the late 70’s.
Clive furthered his education in Technical Analysis or charting by ordering various good books from the US and by applying what he learned at work on an everyday basis. He also obtained the UK Society of Technical Analysts’ Diploma.
The years following 2005 saw the boom phase of the Gold and Silver bull market, until they peaked in late 2011. While there is ongoing debate about whether that was the final high, it is not believed to be because of the continuing global debasement of fiat currency. The bear market since 2011 is viewed as being very similar to the 2-year reaction in the mid-70’s, which was preceded by a powerful advance and was followed by a gigantic parabolic price ramp. Moreover, Precious Metals should come back into their own when the various asset bubbles elsewhere burst, which looks set to happen anytime soon.
Visit Clive at his website: CliveMaund.com
More from Gold-Eagle


