China Crackup…The Final Trap Looms


 What was predicted for China has started to happen with the dramatic failure of its parabolic uptrend just over a week ago leading to a plunge. The update China Crash was posted when all indicators were at “nosebleed” levels late in April, right after which the third steepest fan-line shown on our 1-year chart for the Shanghai Composite Index below was breached. Somewhat amazingly, that overbought peak late in April was not the final top – it rose even higher into early-mid June, but after that, just over a week ago, it finally broke below the parabola and started to cave in.
While low grade Chinese speculators who are leveraged to the hilt and up to their eyeballs in margin debt may have been unnerved by what has just transpired and are probably starting to break out in a sweat, it is considered unlikely that they appreciate the full gravity of the situation – many of them think that this is just a correction, albeit a larger fiercer one. So they are likely to buy this dip, some of them appreciative of the opportunity to get more stock at better prices. They have no idea what is really going on, but we do.
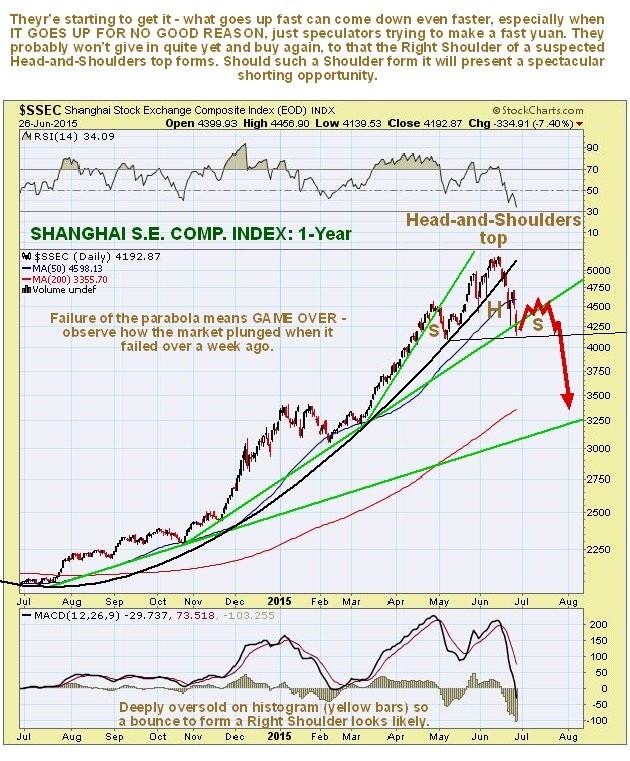
Here is what is going on – the market has just dropped back from the peak of the Head of a Head-and-Shoulders top shown on our chart and if this interpretation is correct it should now rally from the vicinity of the low of the Left Shoulder trough of the pattern that occurred early in May, where there is support. The expected Right Shoulder, projected to form as shown on the chart in red, will be the final trap. Once it descends from the peak of the expected Right Shoulder, after a little hesitation at support at the “neckline” of the pattern, where we might see a minor bounce, it should breach this support and then crash – not drop – crash – because the low grade highly leveraged speculators who currently populate this market will be forced to flee in panic.
Recent action is shown in more detail on the 6-month chart below with expected pattern development shown in red…
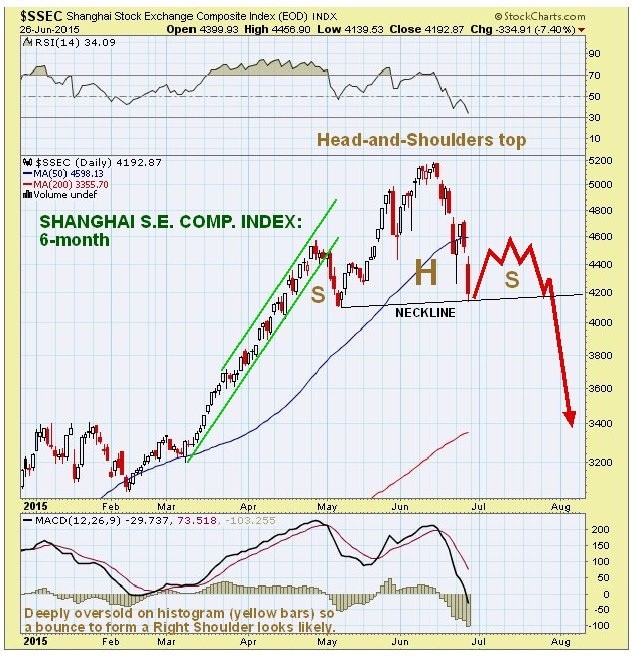
Action in the Chinese action has some implications for other Western markets, since a crash in the Chinese market is likely to have a knock-on effect on bloated markets elsewhere. If the Head-and-Shoulders top in the Chinese market completes in a symmetrical manner, then we have about 3 weeks until neckline failure and a crash, and, perhaps, 3 weeks to prepare for Western markets to follow suit.
********
Courtesy of http://www.clivemaund.com/

Clive P. Maund’s interest in markets started when, as an aimless youth searching for direction in his mid-20’s, he inherited some money. Unfortunately it was not enough to live a utopian lifestyle as a playboy or retire very young. Therefore on the advice of his brother, he bought a load of British Petroleum stock, which promptly went up 20% in the space of a few weeks. Clive sold them at the top…which really fired his imagination. The prospect of being able to buy securities and sell them later at a higher price, and make money for doing little or no work was most attractive – and so the quest began, especially as he had been further stoked up by watching from the sidelines with a mixture of fascination and envy as fortunes were made in the roaring gold and silver bull market of the late 70’s.
Clive furthered his education in Technical Analysis or charting by ordering various good books from the US and by applying what he learned at work on an everyday basis. He also obtained the UK Society of Technical Analysts’ Diploma.
The years following 2005 saw the boom phase of the Gold and Silver bull market, until they peaked in late 2011. While there is ongoing debate about whether that was the final high, it is not believed to be because of the continuing global debasement of fiat currency. The bear market since 2011 is viewed as being very similar to the 2-year reaction in the mid-70’s, which was preceded by a powerful advance and was followed by a gigantic parabolic price ramp. Moreover, Precious Metals should come back into their own when the various asset bubbles elsewhere burst, which looks set to happen anytime soon.
Visit Clive at his website: CliveMaund.com


