Chinese Gold Market: Still In The Driving Seat


With the first half of 2018 now behind us, it’s an opportune time to look at what's been happening in the Chinese Gold Market. As a reminder, China is the largest gold producer in the world, the largest gold importer in the world, and China’s Shanghai Gold Exchange is the largest physical gold exchange in the world.
For various reasons such as cross-border trade rules, VAT rules and deep liquidity, nearly all physical gold supply in China passes through the Shanghai Gold Exchange (SGE) vaulting network. These flows include imported gold, domestically mined gold, and recycled gold. Therefore, nearly all Chinese gold demand has to be met by physical gold withdrawals from the SGE, and SGE gold withdrawals are a suitable proxy for Chinese wholesale gold demand. Therefore, at a high level:
Physical Gold Supply to the SGE = SGE Withdrawals = Chinese Wholesale Gold Demand
Gold supply includes gold imports, mine supply, gold scrap / recycling and disinvestment. Disinvestment on the SGE is the reverse process of investment. Investment is when any institutional entity or individual purchases gold directly on the SGE. Disinvestment involves selling gold bullion which then goes to a refinery and re-enters the SGE vaulting network.
Wholesale gold demand includes consumer demand and institutional demand (direct gold purchases at the SGE). For a fuller explanation of this gold supply – demand equation as it applies to the Chinese gold market, see ‘Mechanics of the Chinese Domestic Gold Market’ on the BullionStar website.

Chinese Gold Market: Still Buoyant
SGE Gold Withdrawals in 2018
For the 6 months to the end of June 2018, physical gold withdrawals from the Shanghai Gold Exchange totalled 1038.4 tonnes. These flows represent gold which has actually been physically withdrawn from the network of SGE vaults across China. The monthly SGE gold withdrawal figures from January to June 2018 are as follows:
January 223.6 tonnes
February 118.4 tonnes
March 192.6 tonnes
April 212.6 tonnes
May 150.6 tonnes
June 140.6 tonnes
This withdrawal total, 1038 tonnes, is the third highest SGE withdrawal total on record for the first six months of any year of the SGE’s existence, only lower than the 1098 tonnes and 1178 tonnes recorded at the end of June 2013 and June 2015, respectively. The following chart highlights the cumulative Month 6 gold withdrawals from the SGE vaults, comparing all years from 2008 to 2018.
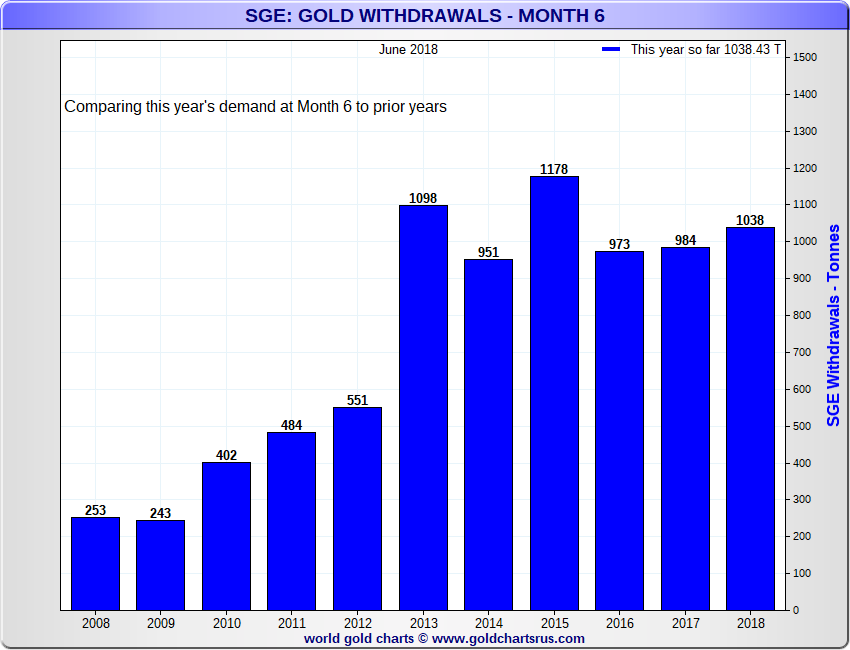
SGE Gold Withdrawals at Month 6 (YTD 2018 June): 2008 – 2018. Source: www.GoldChartsRUs.com
This year’s gold withdrawals to end of June, if annualised, would be 2076 tonnes, which would represent the fourth highest SGE gold withdrawals year on record after 2015, 2013 and 2014, in that order. All in all, SGE gold withdrawal figures year-to-date point to a very buoyant and healthy gold market in China and very strong wholesale gold demand, with volumes in line with the last 5 years.
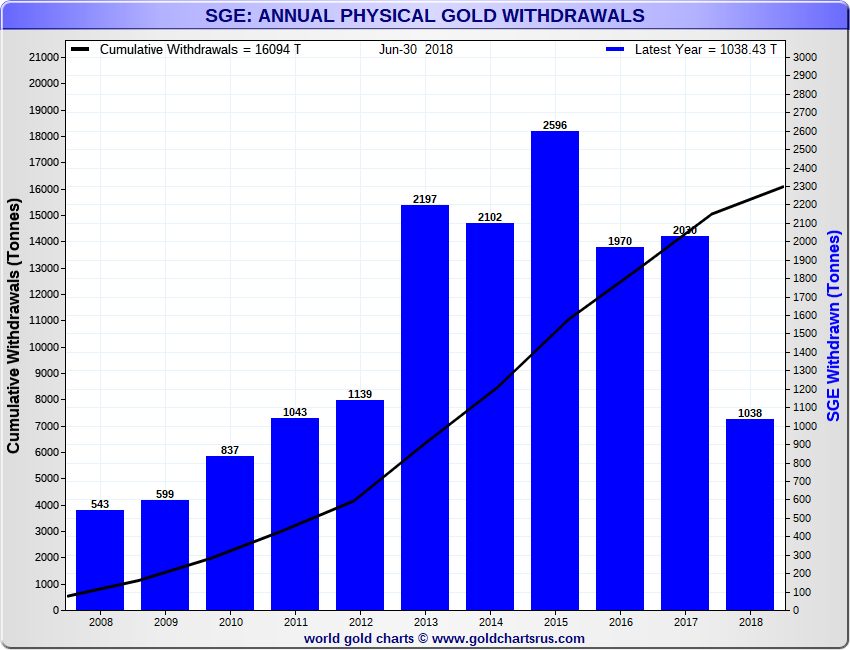
SGE Annual Physical Gold Withdrawals, 2008 – 2017, including YTD 2018. Source: www.GoldChartsRUs.com
Imports of Gold into China
Around the world, monetary gold (i.e. central bank gold) is exempt from customs and trade reporting when it moves across borders. Given this exemption, it is difficult to really know how much gold central banks (including the Chinese central bank, the PBoC) actually have at any given time.
Non-monetary gold is any gold that is not classified as monetary gold. Normally, non-monetary gold flows are estimable since there is no general exemption from customs and trade reporting. However, China is the exception, as it does not publish its gold import or export statistics. Therefore cross-border non-monetary gold trade flows involving China are more difficult to gauge than most. But it is still possible to gauge gold imports into China by looking at other countries’ gold exports to China.
During the year to date, Hong Kong and Switzerland, as expected, remained the two primary suppliers of non-monetary gold to China. Smaller direct suppliers of gold to China include the UK, Australia and the US. While Hong Kong remains the largest supplier of gold into China, China has been for a few years now, sourcing more gold directly from other countries and less gold via Hong Kong,
Looking first at Switzerland, for the first five months of 2018 from January to May, the Swiss supplied 212.6 tonnes of non-monetary gold into China. Specifically, 41.2 tonnes in January, a very large 67.2 tonnes in February, 39.6 tonnes in March, 26.6 tonnes in April and 38 tonnes in May. In fact, China topped the table as the largest single destination for Swiss non-monetary gold imports in every month from January to June 2018, ahead of India and Hong Kong.
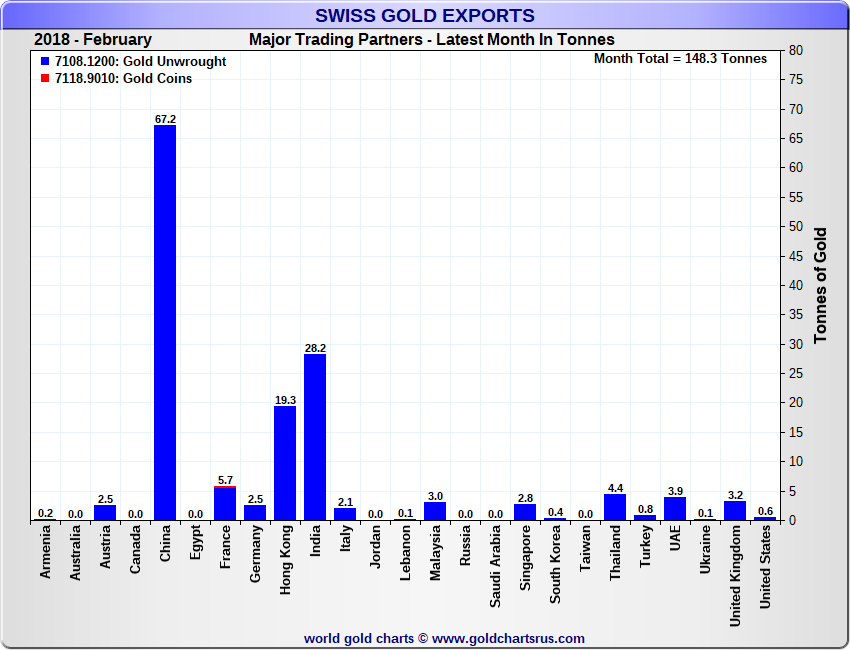
China imported a very large 67.2 tonnes of gold from Switzerland during February 2018. Source: www.GoldChartsRUs.com
At the time of writing the Swiss gold trade statistics for June 2018 have not yet been released. However, if extrapolated on a six month basis, the 5 month flows would suggest Swiss gold exports to China of 255 tonnes from January to June, and 510 tonnes for the full year. This however seems a very high figure since for the full year 2017, China imported 299.8 tonnes of non-monetary gold directly from Switzerland. But there is a growing trend of China importing more gold directly from some countries and less from the interpot of Hong Kong, so an increase in Swiss gold exports directly to China is to be expected. How big that increase will be for the full year of 2018 will only become apparent as more monthly updates become available from Swiss Customs.
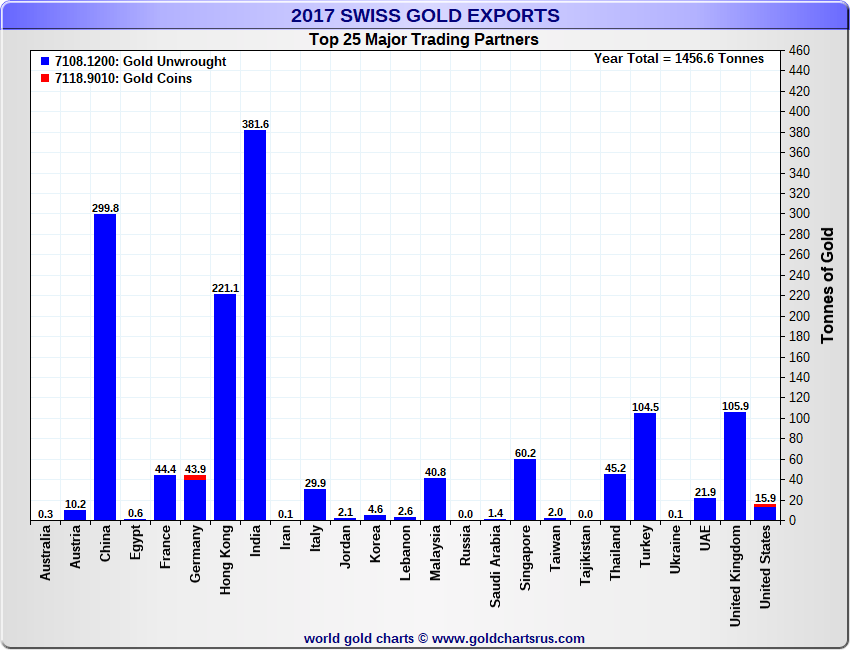
Swiss Gold Exports by Country Destination, 2017, Source: www.GoldChartsRUs.com
According to Hong Kong’s Census and Statistics Department (HKCSD), Hong Kong net-exported 144.2 tonnes of gold to mainland China during the first 3 months of 2018. Extrapolating this on a 6 months basis would be about 290 tonnes, and 580 tonnes on an annualised basis. This would be a 7.5% drop compared to 2017 full year net gold exports from Hong Kong to China, but such a drop is to be expected as there is a trend of China is now engaged in more direct gold imports from destinations other than Hong Kong.
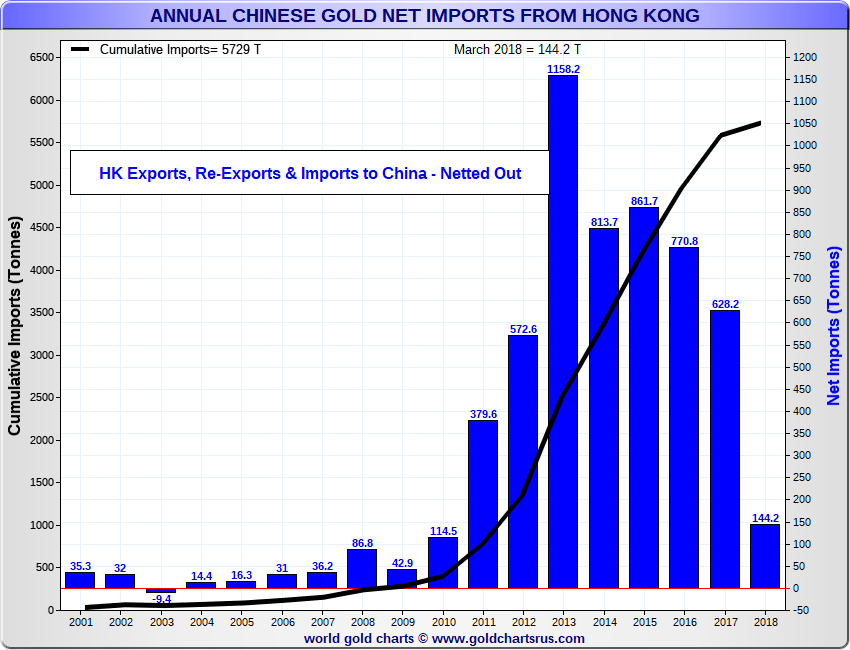
Chinese Gold Imports from Hong Kong, Source: www.GoldChartsRUs.com
China sources gold directly from a number of other countries such as the UK, Australia, US and Canada. Together these other sources are still relatively insignificant as gold exporters to China compared to Hong Kong and Switzerland, but based on 2017 figures, together they may have sent about 30-40 tonnes of gold to mainland China during H1 2018.
Gold Production in China: 2018
Beyond gold imports, gold sourced from mining remains a critically important source of gold supply in China. According to the China Gold Association (CGA), China produced 98.22 tonnes of gold from mining in the first quarter of 2018, which was down 3 tonnes on Q1 2017. This comprised 80.8 tonnes from direct gold mining and 17.4 tonnes from extracting gold as a byproduct of other mining.
While the CGA has not yet published a gold mining output total for the second quarter of 2018 and its website has not yet been updated with such a news release, extrapolating the first quarter figure would suggest a Chinese domestic mining output figure of just less than 200 tonnes of gold for the first half of 2018 and about 400 tonnes for the full year.
Given that China produced 426.14 tonnes of gold during 2017, and the 2017 gold output total of 426.14 tonnes was itself 27.3 tonnes, or 6%, less than in 2016, it looks like 2018 will see another year of reduced gold production from the world’s number one gold producer. With continued buoyant demand from the Chinese gold market, these relative production shortfalls will have to be made up by larger gold imports or increased volumes of gold recycling.
SGE Premiums
Premiums of the Shanghai gold price to the international gold price have remained positive and steady throughout 2018, and generally low, except for a short period at the end of March. In price terms, SGE premiums during the year-to-date period have been recorded at between 1-2 Yuan per gram , or in percentage terms between 0.3% and 0.8%.
The positive premiums point to the attraction of sending gold from West to East, while the generally sedate levels of these premiums during 2018 indicate that there are currently no major supply constraints, such as tighter gold import rules, that could send the premiums higher into positive territory. Contrast this to late 2016, when the SGE gold price traded 2-3% higher than the international gold price, on the back of rumoured PBoC restrictions on gold import quotas and consignments that were said to be an attempt to control capital outflows.
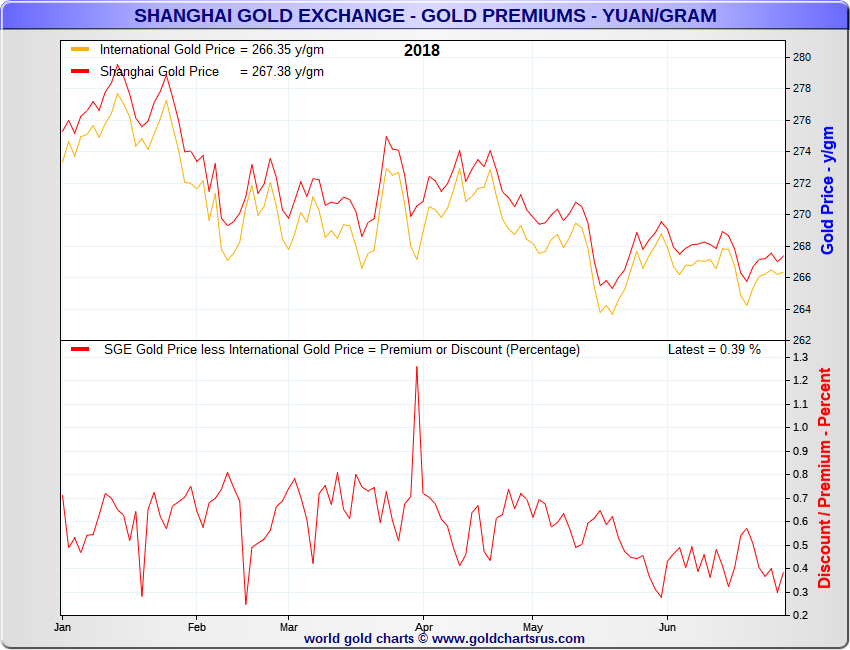
SGE Premiums on Gold 2018. Source: www.GoldChartsRUs.com
With Chinese wholesale gold demand running at over 1000 tonnes for the first six months of 2018 as indicated by SGE gold withdrawals, China’s gold market has to principally meet this gold demand from the key supply sources of domestic mine production, gold imports and gold recycling and disinvestment.
For the year to date to end of June, we can assume that Chinese gold mining contributed about 200 tonnes to Chinese gold supply. Non-monetary gold imports, principally from Switzerland and Hong Kong, contributed another 560-580 tonnes.This would leave about 300 tonnes to be sourced from gold recycling and scrap through the SGE system and from disinvestment.
Ronan Manly
E-mail Ronan Manly on: [email protected]


