Continued Weakness in Stocks and Bonds


The current downtrend in the Dow Jones began on August 7th, and for the past two, almost three months it’s been all downhill. Not an avalanche, but so far, a relentless deflation in valuation that has now taken the Dow Jones below its BEV -11% line at the close of this week.
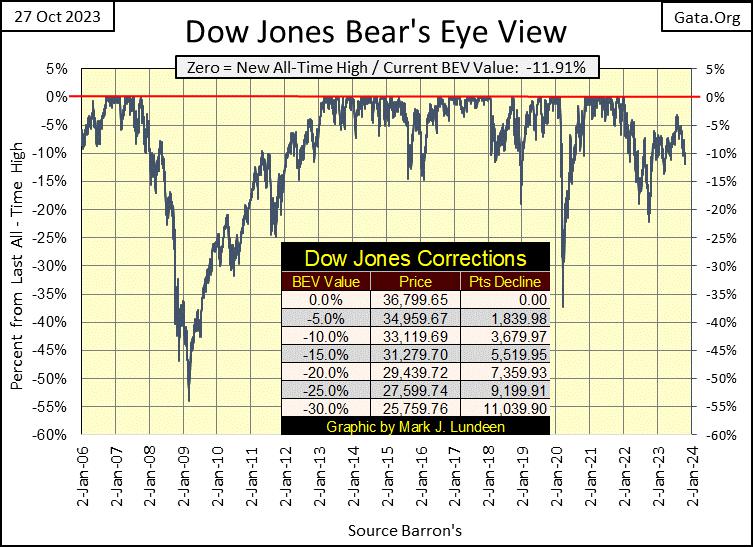
One of two things are likely from here. We could see a nice rebound from these levels. I doubt the Dow Jones would rebound to a new all-time high, but a rebound back up to its BEV -5% line is possible. What is also possible would be a sharp breakdown to much lower levels.
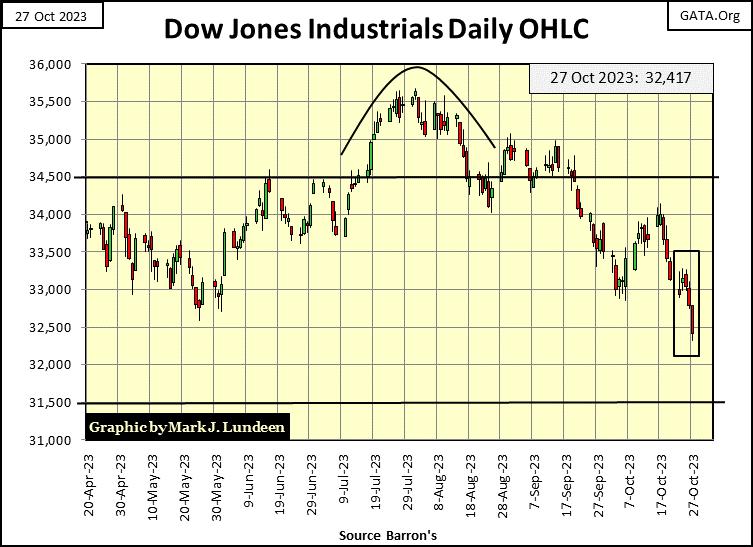
Looking at the Dow Jones in daily bars below, I see a clear pattern of selling into market strength, beginning in early August. Since the highs of summer’s, an advance in the market has only invited selling, something known as Selling into Market Strength. Such selling is not a bullish chart pattern, more a pattern of the rats abandoning a sinking ship before the captain and crew are forced to.

The rats in this case are professional money managers, who sense the market is overvalued. They want to lower their market risks, by locking in some profits by selling at the top. Being responsible, meaning not desiring to trigger a major decline in the market, these market pros limit their selling to those times when buying is coming into the market, so as not to re-enforce selling pressure during a market decline. This prudent behavior is something we’d expect market pros to do.
That is how professional money managers behave at market tops. Retail investors act differently; they like buying at market tops, and it’s their buying at this market top that the pros are most likely selling into. But like other things in the market, I’m thinking about rising bond yields, that there are threshold levels that once crossed, results in rational people becoming irrational.
The last two weeks have been tough on the stock market. However, to those looking for bargains in the market, the market is now inviting their attention, so I’m expecting some buying coming into the market next week. What happens after that is key. Do the pros once again sell into to this anticipated strength? If so, we may see a breakdown in the market to much lower levels should retail investors finally join in the selling.
No guarantees with this. As a market enthusiast, I’m just considering the possibilities the market has coming to it in the short-term. But supporting my pending market breakdown thesis is the action at the NYSE, with its 52Wk High – Lows Net in the table below.
This is a weak market. Since September 15th the NYSE has seen only one day where 52Wk Highs have outnumbered 52Wk Lows; October 10th. The number of days with three-digit negative nets have also been plentiful since September 15th, some with greater than -400 H-L nets.
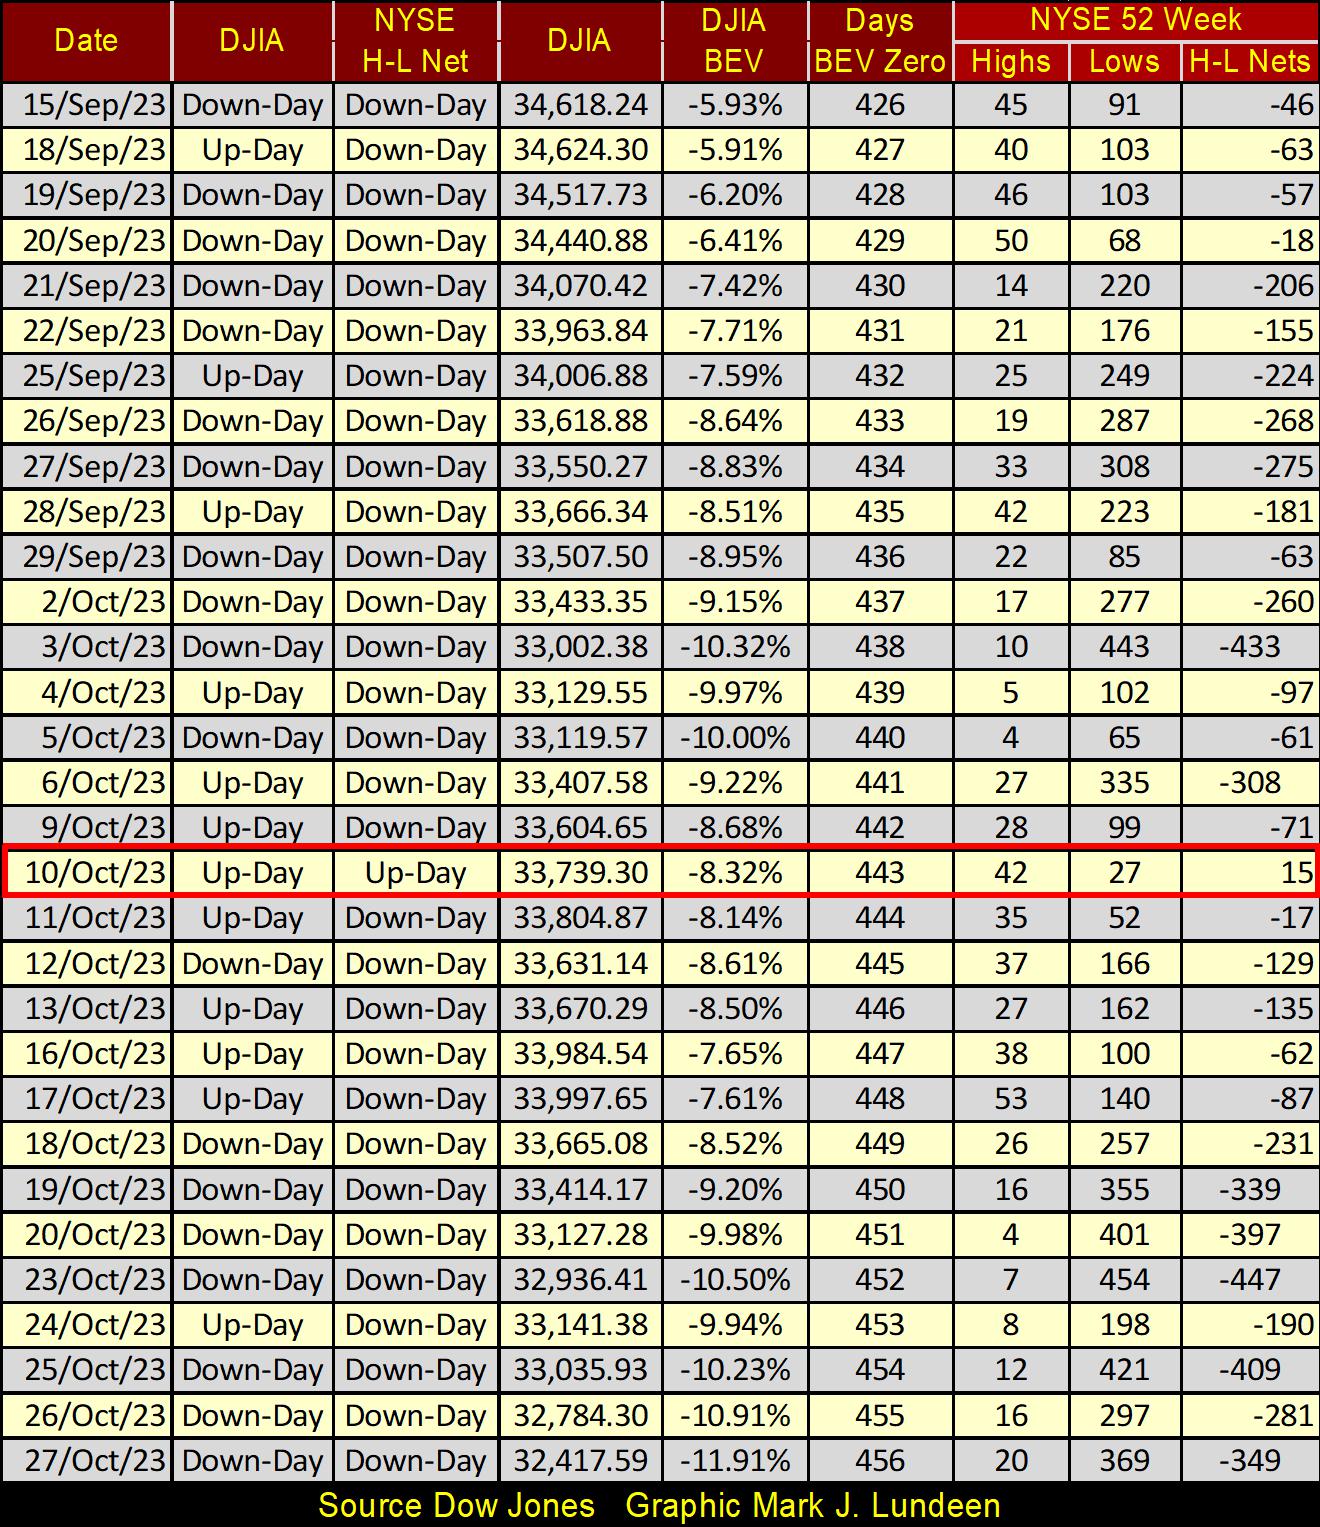
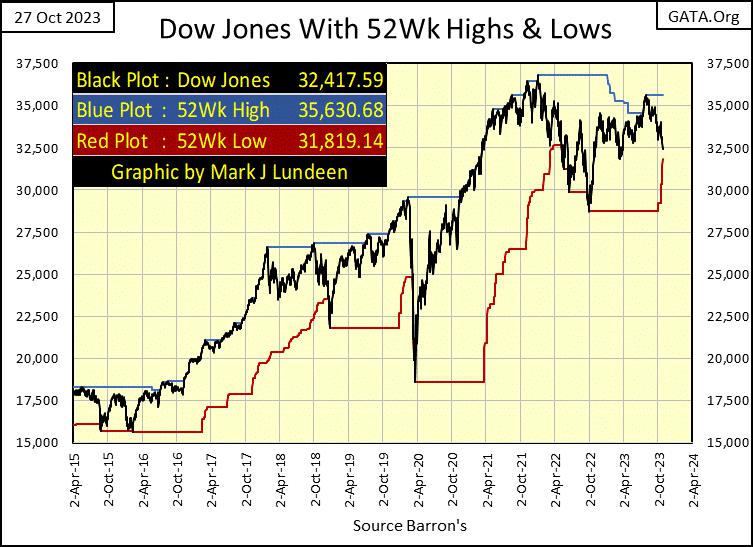
The vast majority of issues trading at the NYSE (NASDAQ too) must be trending down towards their lows of the past 52Wks, as is the Dow Jones in the chart below. It has been years since we’ve last seen a prolonged period where NYSE 52Wk Lows dominate the market. If after almost three years, the Dow Jones can’t make the effort to make a new all-time high, we should seriously take the possibility that NYSE 52Wk Lows will increase dramatically in the weeks, months, and maybe years to come.
In the short term, Four-digit negative, greater than -1000, 52Wk H-L Nets are a possibility, and they would make for a very bad day in the market.
Looking at the major market indexes’ BEV values below, leads me to believe most people are in denial. I don’t spend much time looking at financial media. When I do take a peek at how things are going on there, the message I get from the media is one of bargains to be had, so now is a time to buy. Of course, the financial media also provides some time for a bear or two, as they should.
These BEV values below are Mr Bear’s negative percentage claw-backs from these indexes last all-time highs. If we were in a bull market, seeing these indexes correct 10% to 30% from their last all-time highs would make for compelling buys in the market.
But I’m a bear. So, my thinking goes something like this; if these indexes’ BEV values are down this much during a time when investor sentiment in the main remain bullish, how far do they go down when investors finally figure out their remaining money in the market is exposed to an ongoing big-bear market?
I think they go down a lot more. Looking at these indexes Average (#14), it closed the week with a BEV of -21.65%. How much further must it go down before retail investors understand the stock market has becomes a very hostile place for their invested funds?
Speaking of Mr Bear clawing back market valuation, what did the NASDAQ Banking index (#20) close the week at? A claw-back of -46.77%, and that is not good! Should bond yields continue climbing as they have all year, we can count on these banks’ BEV values breaking far below -50%, and seeing the idiots at the FOMC intervening to “stabilize the market” once again.
Whether the financial system, and US dollar survives these idiots’ “stabilizing” the banking system one more time is another question.
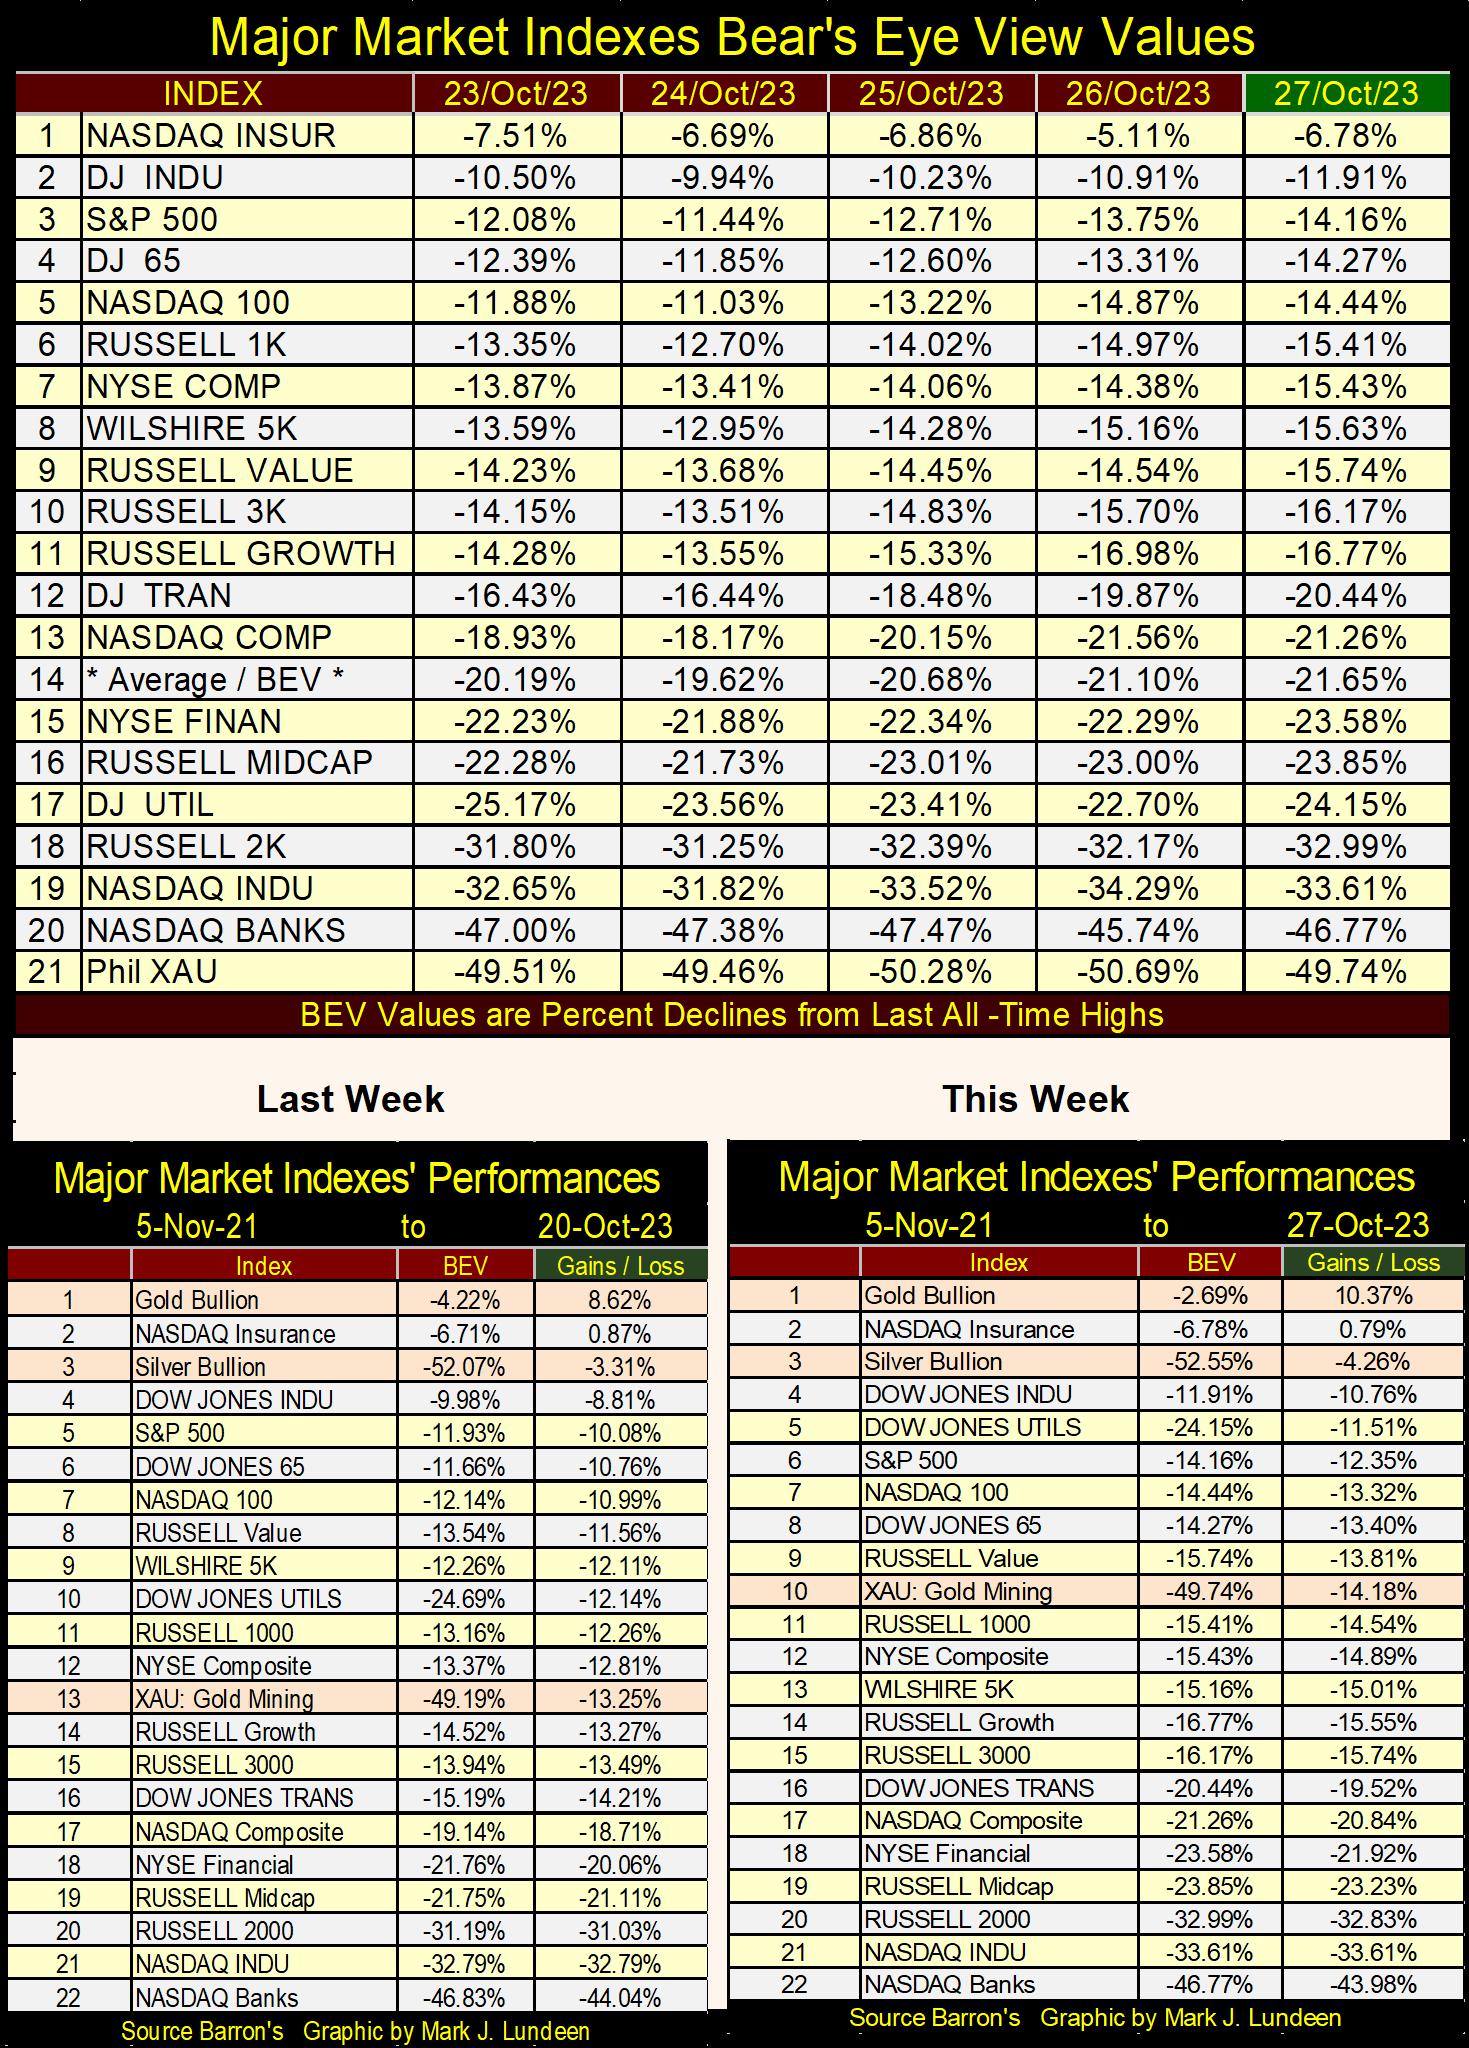
In this week’s performance tables above, gold (#1) was the only item that saw actual gains for the week. Silver was down, but kept its #3 position in the table. The XAU advanced from #13 last week, to #10 at this week’s close, not by going up, but by going down. The XAU’s secret to its success was to have some of the indexes above it last week, go down even more than it did this week.
Comparing this week’s performance table to last weeks, tells the story of continuing market weakness. What is next? A nice market rebound from these depressed levels, or continuing deflation in market values? We’ll know more next week.
It’s been months since I’ve published the following table in the BEV values for the commodities I follow, so maybe this is a good week to do so once again. Note the data is weekly, not daily like the BEV values for the major market indexes above. That is something important to note, as the percentage change from one week to the next seen below, can be much larger than the percentage change from one day to the next seen in the table above.
For instance; cocoa (#2), which since early October has moved up by over 10%, just short of a new all-time high by only 1.12%. Orange juice (#1) is a hot market, closing in four of October’s five weeks at new all-time highs. Gold at #3 is also doing good! Where is silver? Way down there at #15. Give silver some time, and it too will make its owners proud of owning it.
The remarkable thing about the BEV values for the commodities below, is in our time of high inflation, how far they are from making new all-time highs. This strikes me as quite odd. Crude oil closed the week 42.80% from its last all-time high. Natural gas closed the week 77.29% below its last all-time high.
Okay, I know I’m spending a lot more this year than last, to pay for everything from groceries to insurance. But just looking at the BEV values posted below, I don’t understand why that would be.
With our commodity markets being “regulated,” is it possible someone is squeezing some juice out of us at the cash register? I’m not talking about my grocery store, or the farmers, or even the evil energy producers, but some entity, or entities that gives generously to the political parties in Washington DC?
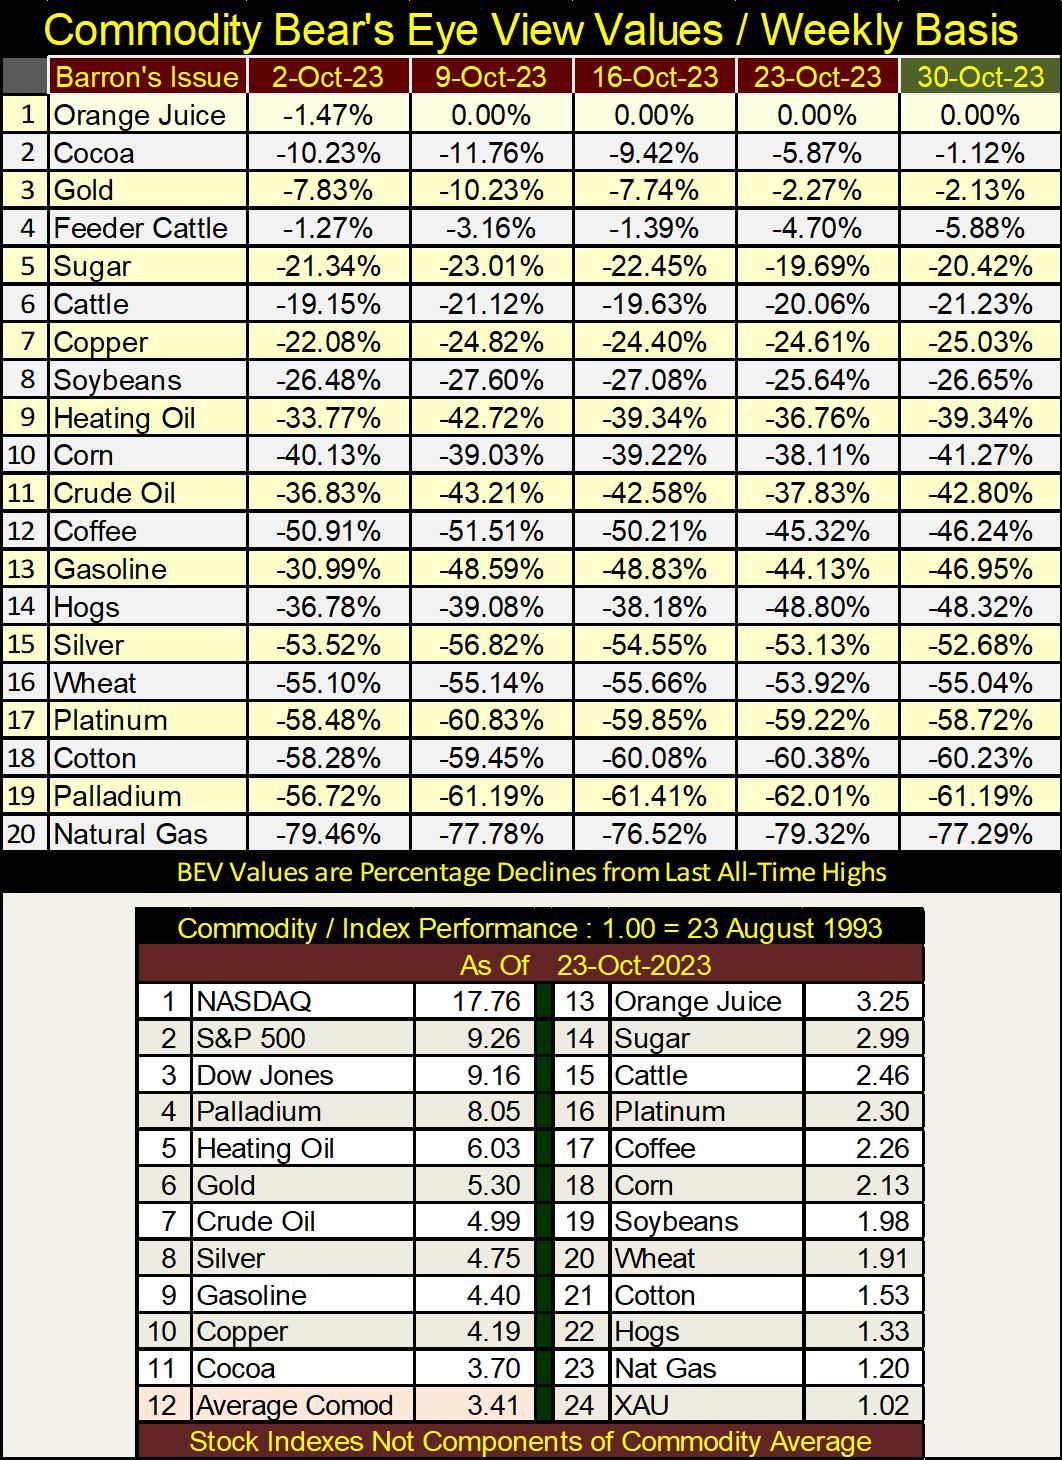
In the performance table above, it’s interesting noting how the stock market indexes (except for the XAU) have outperformed these commodities by a large margin. Or so it is in October 2023. Things may be different come October 2024.
JP Morgan’s Jamie Diamon is “ripping” central banking for their sub-par economic forecasts.
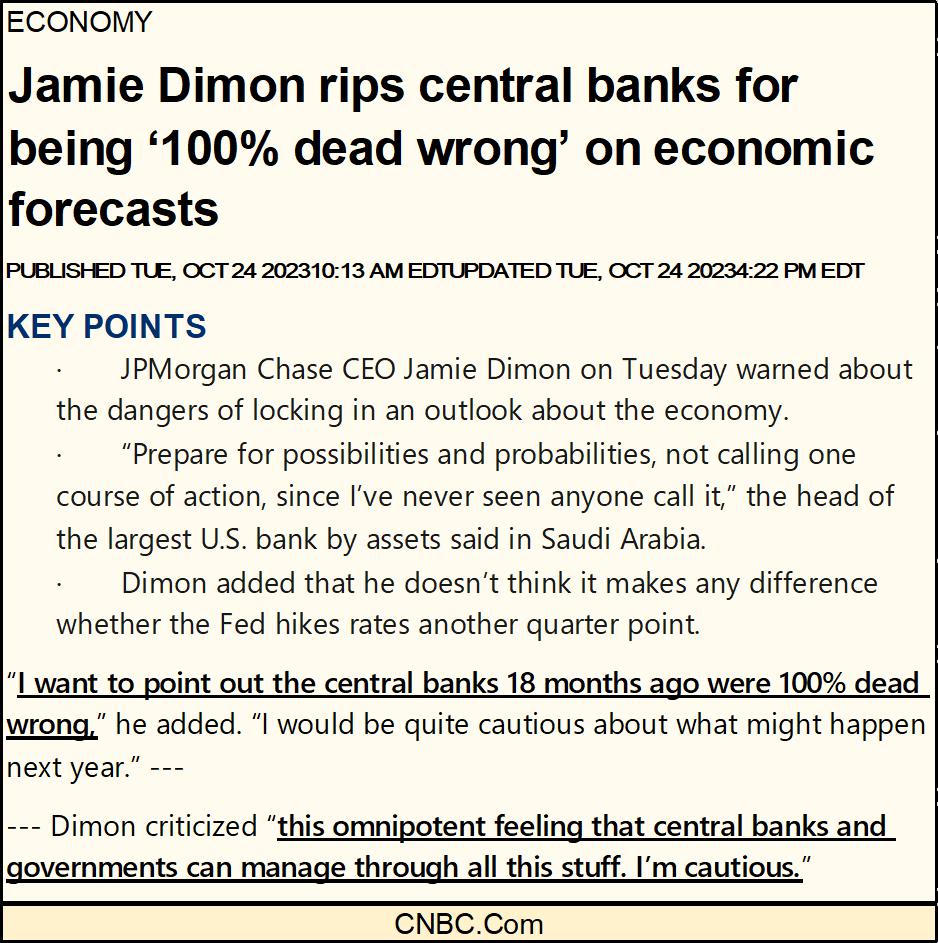
Nothing new about that; that being the idiots from the FOMC getting something wrong. If Dimon really wanted to be the bearer of truth to the masses, he would have pointed out not just the shortcomings of the idiots at the FOMC, but included just about every “expert” the main-stream media gives airtime to in their “news programing.” “Experts” spanning the spectrum from foreign and domestic policy to medical advice. These days, listening to the “experts” can get you killed.
I should give the disclaimer that on the topic of main-stream media, I’m a bit of an “expert,” as they just aren’t a major focus point in my life anymore. I stopped using them years ago as my primary source of information about the world I live in.
The “personalities” in front of the camera all look and sound the same from channel to channel, from the east coast to the Pacific, on to Hawaii, and in the deep snow and cold of Alaska. But the real problem I have with the main-stream media concerns the topics they decide worthy, or unworthy of being covered.
Whether it’s the newspaper, radio or TV, it’s all the same; both the topics and the angle they take on these topics are monolithically identical from one source to another, and all too often pro-big government, anti 1st and 2nd amendment.
As a small government sort of guy, who agrees with Thomas Jefferson that the government that governs least, governs best, I’m fed up with the main-steam media. It’s only canned nonsense, marketed for public consumption, to keep all of us in line.
I do look at them now and then to see what their latest narrative is, like their current more war for peace narrative. It’s only a matter of time before they resume their narrative of Israel being a bully.
But sticking to things financial, it’s fair saying that in the public’s mind, “experts” are always right until they become obviously wrong. Everyone, including the “experts” eventually becomes aware when a bull market is in progress. However, to the degree that anyone is an actual market expert, depends upon not only WHEN someone recognizes it’s time to buy, but more importantly when it’s time to sell. The time get out, and stay out of the market.
That has always been the chief problem with “financial experts;” they are salesmen whose talent is getting the public to buy. Their shortfall is they come late to the party, long after the bull market began, and rarely tell the public when it’s time to take profits, and exit a bull market.
Really sharp people catch the bull market near the bottom of the old bear market, exactly when valuations are real bargains. Of course, most investors near the bottom of the old bear market are suffering from Battered-Bull Syndrome.
It’s just a fact that most people who risk their money in the market, buy near the top. Being risk adverse, they see years of steady gains as reassuring, that somehow this bull market, having gone on for many years has become a fixed, and never changing feature in the market place. That isn’t true, so unfortunately, most people also then sell at the bottom.
So, am I a “market expert?” God save me from such a fate. But I do have an insight of what market is at a top, needing to be exited from, and which market is at a bottom, thus deserving the attention of forward-thinking investors.
Some good news, and some bad news needs to be noted here; first the bad news. I don’t have anything new here, it’s the same story I’ve been writing about for a long time; the broad stock market is at a historic top, and people need to take their profits and exit Wall Street, and not come back until;
Dow Jones’ dividend is yielding something greater than 6%,
The daily volatility spike produced during the coming bear market begins to come down.
The good news is I have a new, and useful graphic to illustrate these points, a stacked chart comparing the Dow Jones with the Barron’s Gold Mining Index, below.
The top chart for the Dow Jones is self-explanatory, since August 1982 (Red Star) the Dow Jones has increased by a factor of 47.37, taking the venerable Dow Jones from under 800, to over 36,000 in forty years. If someone can take a moment to study this chart, and not see the danger of a massive implosion in market valuations in the stock market pending, there isn’t much for me to say to them.
What are the bulls expecting from the Dow Jones to do from here? Dow Jones 50K? That would be an advance of over 50%. But looking at this chart, seeing a decline of over 50% seems more likely.
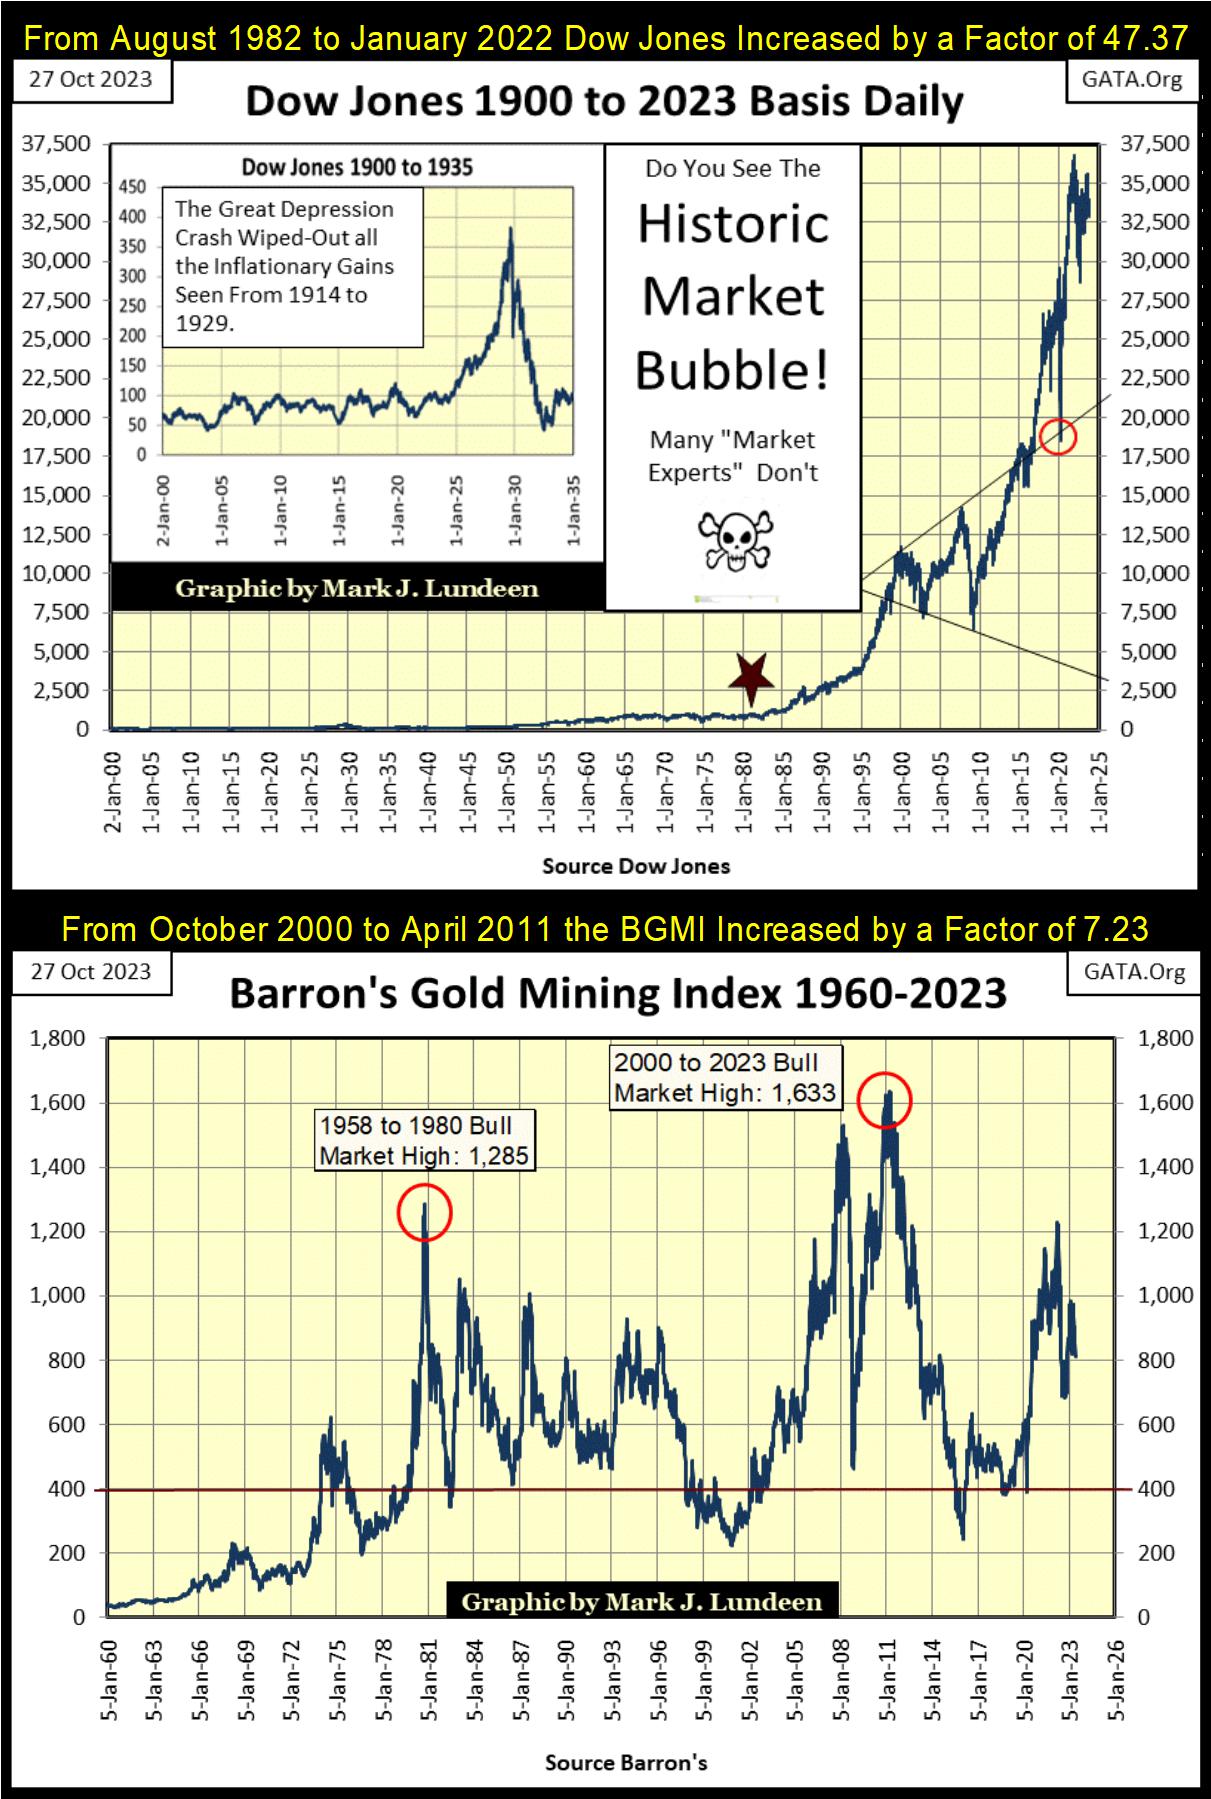
Compare the Dow Jones to the Barron’s Gold Mining Index (BGMI). In the past forty years where the Dow Jones has increased by a factor of 47.37, currently the BGMI is below its 1958 to 1980 bull market all-time high of 1,285. For its bull market that began in 2000, so far, the BGMI peaked in April 2011, increasing by a puny factor of only 7.23. That was twelve years ago, and people are sick of wasting their time and money on the gold miners.
In October 2023, what is attractive about the gold miners?
For someone who likes to buy something cheap, quite a bit. But to make my case, I’ll use a King World News interview with Michael Oliver, someone I consider a real expert in gold, silver and their miners. This KWN interview is about twenty-two minutes long, and worth your time to listen to, maybe even for a second time.
https://kingworldnews.com/michael-oliver-broadcast-interview-available-now-10-21-2023/
In support of Mr. Oliver’s, and Eric King’s opinion on how cheap the gold miners are, and how over valued other market assets are, here is a table listing the market caps for the big-five, trillion-dollar market cap companies that currently are market favorites, with the market caps for the five largest gold and silver miners.
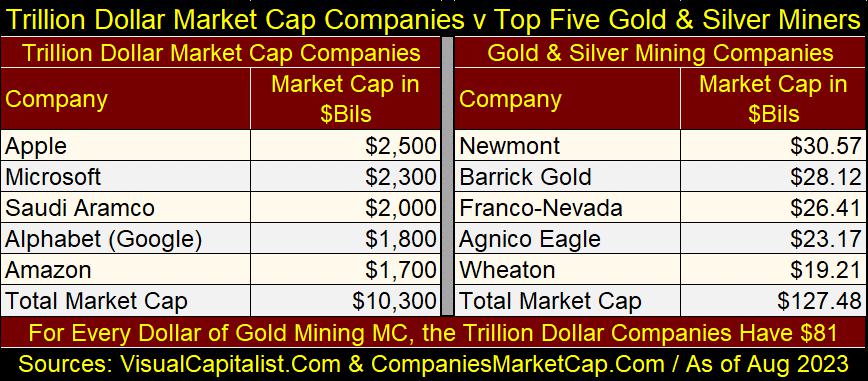
The gold mining sector is tiny, like a barnacle on the side of a whale, with the whale being the stock market. Then there are the debt markets, corporate and government, which are larger markets than the stock market is.
The point Mr. Oliver is making is; there is coming a point where all the capital now circulating in the stock and debt markets will come under deflationary pressure. Money managers and wealthy individuals will desperately be seeking inflation somewhere in the financial markets, or they will suffer the consequences of holding assets in a massive deflationary bear market. That source of valuation inflation will most likely be precious metal assets, like gold and silver miners.
Given the huge chasm in market caps between the financial markets and the gold miners, rational people would agree that it’s not possible for all the trillions of dollars now circulating in the financial market, to enter into the tiny gold and silver mining sector. So, the prospects of seeing valuations in the BGMI or XAU explode upwards is very unlikely should a bear market in financial assets begin.
That sounds very reasonable. BUT I wish to note that in big bear markets, when Mr Bear is clawing back market valuation down to levels not thought possible at the top of the former bull market, rational people become no more common than are capital gains.
I too doubt all the money now circulating in the financial markets will be able to enter the gold and silver mining sector in a market panic. Though in a market panic, desperate people may do their best to get all the money they still have into gold and silver mining. The result of this would be a bull market in precious-metal mining that will be historic.
Here is a pretty chart you may want to hang on your wall; gold’s BEV chart. Gold’s last BEV Zero was in August 2020. Since then, it has made two failed attempts to break above its highs of three years ago.
The first was in March 2022, from which it corrected back below its BEV -20% line. Its next attempt for a new all-time high was last May, failing to do so six months ago, gold corrected, but only to just below its BEV -10% line on October 2nd, just weeks ago.
Since its lows of October, gold has been charging upward, closing the week only 2.69% from its last all-time highs of three years ago.
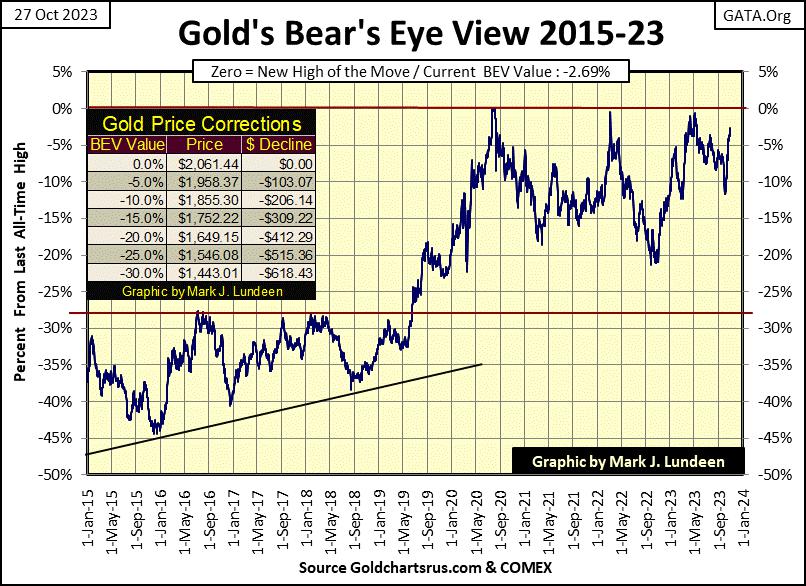
What’s to come from here? I hope gold in the next two weeks finally makes a new all-time high, and then keeps on going, taking silver and the XAU up with it.
Something similar was seen when gold was struggling with its BEV -27.5% line (Red Line) in the chart above. For years gold struggled with breaking above this critical level, failing to do so several times, it always fell back. But then in the summer of 2019, all that changed, as gold finally cleared this level of resistance at its BEV -27.5% line, until a year later when it finally hit a BEV Zero, a new all-time high in August 2020.
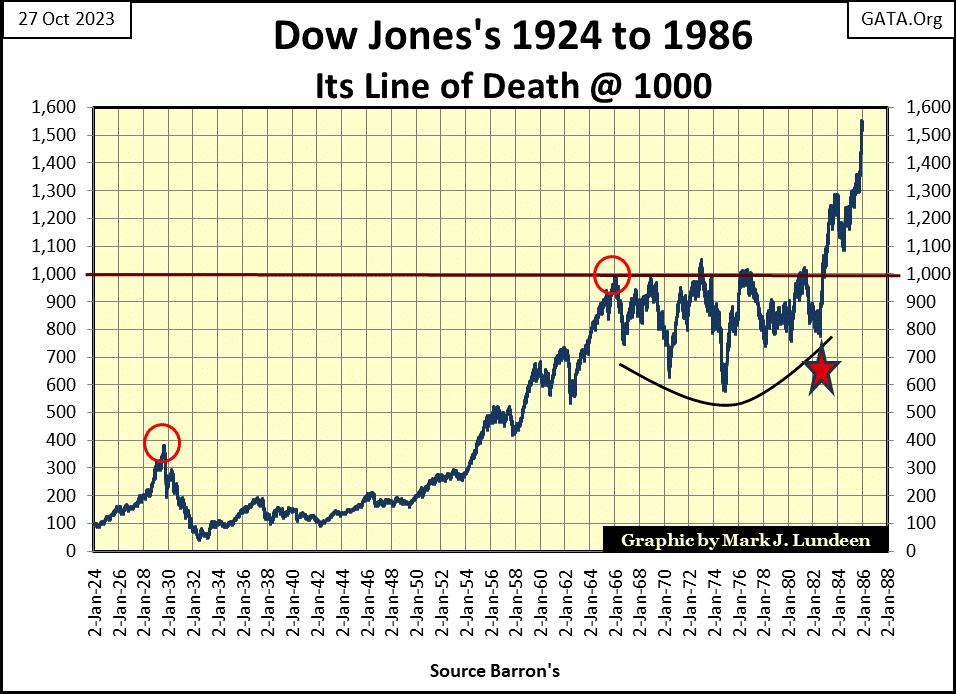
Something very similar happened to the Dow Jones from 1966 to 1982, where five times the Dow Jones attempted to break above, and then stay above 1000, but failed to do so in the chart below. Then in August 1982, the Dow Jones made a bottom (Red Star), and began advancing. In October 1982 it made a new all-time high, and kept on going up until January 2022 when it finally topped out at 36,799.
That’s another problem this bull market in the Dow Jones has; after forty years of constantly running uphill, its bulls are just old and tired.
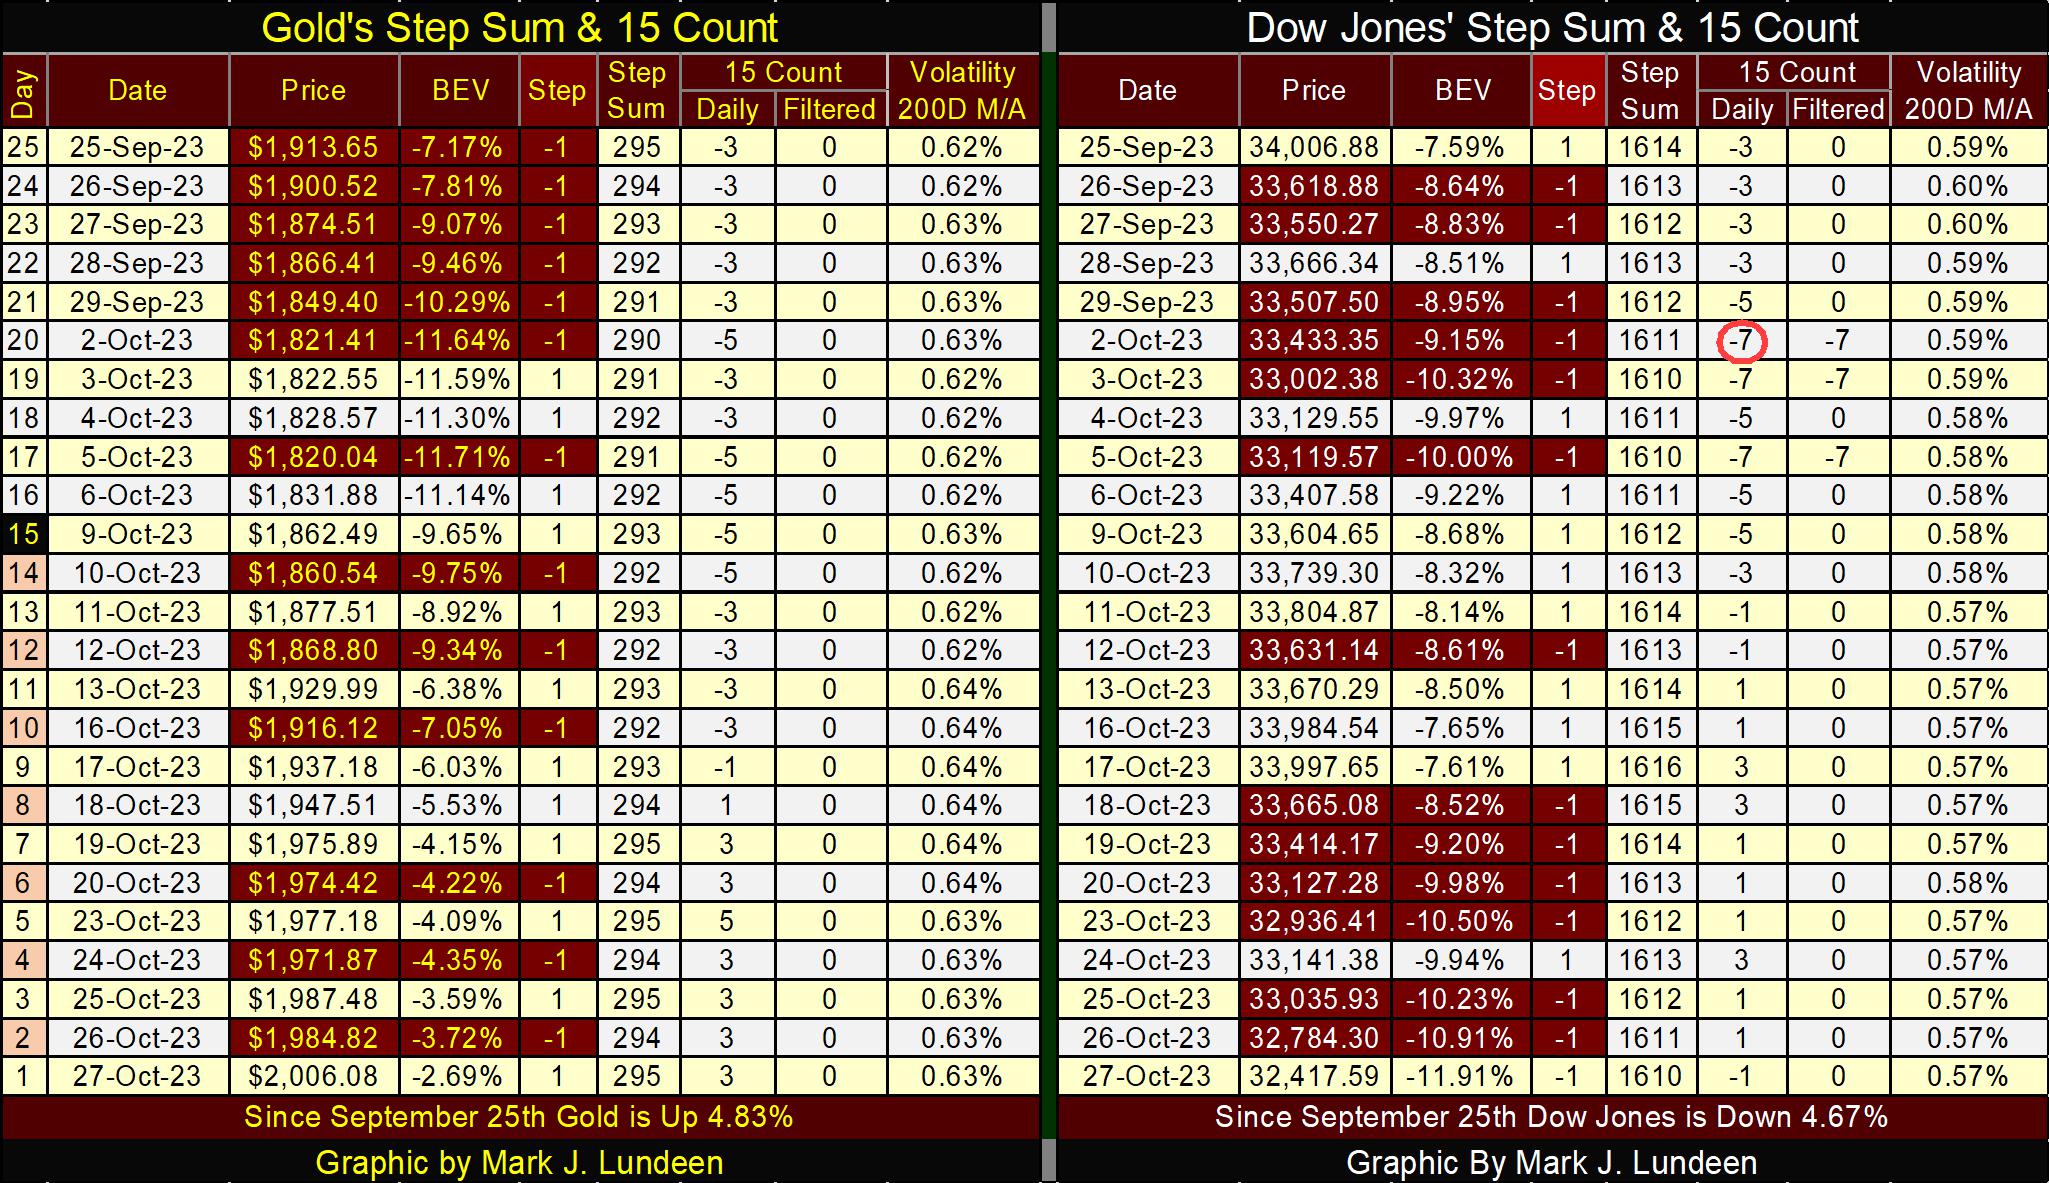
In gold’s step sum table below, we see the selling pressure it saw in September stopped in early October. Though gold has seen plenty of down days since October began, the bears haven’t gotten much from their down days, while the bulls have had great success in moving gold upward on their advancing days. This is very constructive market action, and I like it.
The next thing I’d like to see in the gold’s table below, would be for its daily volatility 200D M/A to begin trending upwards to 1.00%, and then higher. Gold bull markets are volatile, with lots of big daily moves, days of extreme market volatility, which for gold are +/-3% days.
This week, gold’s volatility closed at 0.63%. Hopefully gold in the weeks to come will continue rising, well above its last all-time highs of August 2020, as its daily volatility begins trending up to 1.00%.
Of course, for gold to advance from here, it requires money from somewhere else to begin flowing into the gold market. Historically, that flow of funds that drives bull markets in gold, comes from deflating valuations in the financial market.
I suspect a major difficulty for the COMEX goons’ effort to keep the price of gold down, is from the bond market, which has been in a massive bear market for years. This bear market in bonds is sending flight capital into gold and silver, feeding the current bull market in gold. In BEV terms, how much further must the Dow Jones deflate before the investing public becomes aware of the bull market in gold? A BEV of below -15%, maybe -20%?
I’m keeping my eyes on daily volatility for the Dow Jones. Should the Dow Jones once again begin seeing days of extreme market volatility, days the Dow Jones closes +/-2% or more from its previous day’s closing price, that will be a signal the Dow Jones should soon be testing its lows of October 2022 (BEV -20.64%).
If in the next few months, or maybe even weeks the Dow Jones see a BEV value below its lows of last October, it won’t be good for stocks and bonds, but should be very positive for gold, silver, and hopefully the gold mining companies.
A brief comment on Eskay Mining. Everyone is waiting for the assays to come into the company, they are not in yet. But even if the assays are all anyone could desire, with this market for the gold miners, it may not do much for Eskay Mining’s share price.
This is what a very-hard bottom looks, and feels like; despair and hopelessness all around.
To cheer my readers up, here is another King World News interview, Eric Kings latest with Alasdair Macleod. There are big things lurking out in the darkness, bad things that are off most people’s radar, that are covered in the interview below.
https://kingworldnews.com/alasdair-macleod-available-now-10-28-2023/
Mark J. Lundeen
*********
More from Gold-Eagle


