Could Stagflation Save Gold In 2023?


The supply-side enthusiasts expect a renaissance in 2023. Are they right or wrong?
While the Big Tech bloodbath continued on Jan. 3 and the USD Index soared, gold, silver and mining stocks continued their ascents. Moreover, despite a hawkish Fed, higher real yields and weakness gripping other risk assets, the PMs have outperformed in recent weeks.
As a result, with the permabulls salivating over the short-term price action, even CNBC has boarded the hype train.
Please see below:
Source: CNBC
Although, while the gold bugs attempt to wish the fundamentals into existence, the realities on the ground are much different.
For example, the new narrative proclaims that instead of a recession, stagflation could grip the U.S. economy, sparking a renaissance for hard assets and despair for everything else. Therefore, a repeat of the 1970s is on the horizon.
Yet, while we were extremely bullish on inflation in 2021 and noted the similarities to the imbalances created during the 1970s, there are also material differences between the two periods. Consequently, the years-long malaise of high inflation, high unemployment, and weak growth (bullish for gold) is unlikely to materialize this time around.
For one, the crowd assumed that “transitory” inflation was a function of supply-side constraints. But we warned about the pitfalls of that thesis on Mar. 31. We wrote:
There is a misnomer in the financial markets that inflation is a supply-side phenomenon. In a nutshell: COVID-19 restrictions, labor shortages, and manufacturing disruptions are the reasons for inflation’s reign. As such, when these issues are no longer present, inflation will normalize, and the U.S. economy will enjoy a “soft landing.”
However, investors’ faith in the narrative will likely lead to plenty of pain over the medium term. For example, we’ve noted for some time that the U.S. economy remains in a healthy position. And with U.S. consumers flush with cash and a red-hot labor market helping to bloat their wallets, their propensity to spend keeps economic data elevated.
Likewise, while most investors assumed that consumer spending and inflation would fall off a cliff when enhanced unemployment benefits ended in September, the reality is that neither will die easy.
To that point, while the crowd scratched their heads for months wondering why inflation wouldn’t abate, they finally saw the light in December. We wrote on Dec. 1:
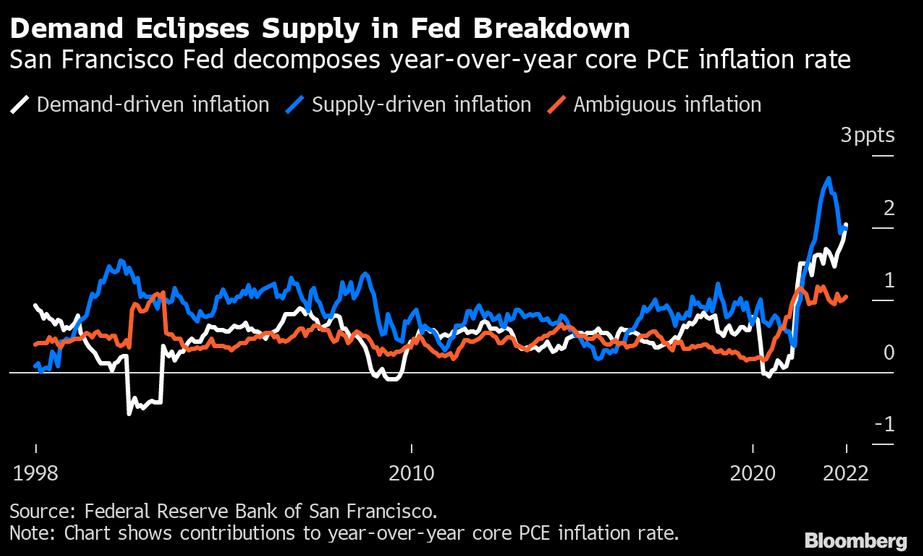
The San Francisco Fed attempted to decompose the drivers of the core Personal Consumption Expenditures (PCE) Index’s year-over-year (YoY) increase. The blue, white, and orange lines above represent supply, demand, and ambiguous inflation.
If you analyze the right side of the chart, you can see that the white line (demand) has now surpassed the blue line (supply) as the primary driver of inflation. Thus, while supply chains have normalized and shipping rates have declined by upwards of ~80% YoY, output inflation has barely budged. As such, resilient demand has been the culprit, and the crowd doesn’t grasp how difficult this will make the Fed’s job in 2023.
Demand Side Inflation vs Supply Side Inflation
Please remember that supply-side inflation is associated with currency crises. When a country's currency collapses, the FX-adjusted cost of imports soars, which causes the price of everyday essentials to rise, and forces consumers to foot the bill regardless of their budgets.
Conversely, when a currency is stable, FX-adjusted import costs follow suit, and consumers can't be forced to pay higher prices for most goods, leaving supply and demand to determine the equilibrium.
Think about it: discretionary companies like Ralph Lauren, Chipotle Mexican Grill and Marriott International increased their prices substantially in 2021. But, if Americans were unwilling to pay, their inventories would build, and they would lower their prices to match the demand outlook.
Consequently, this cycle's data screamed demand-side inflation, not supply-side. Furthermore, with the USD Index rising sharply from mid-2021, it was another indicator that supply-side issues were not the problem. As a result, that's why we were bullish on U.S. economic growth and the U.S. federal funds rate (FFR) throughout 2021 and 2022.
So, while the storytellers proclaim that 1970s-style stagflation is around the corner, the current, and likely, performance of the USD Index contrasts that narrative.
Please see below:
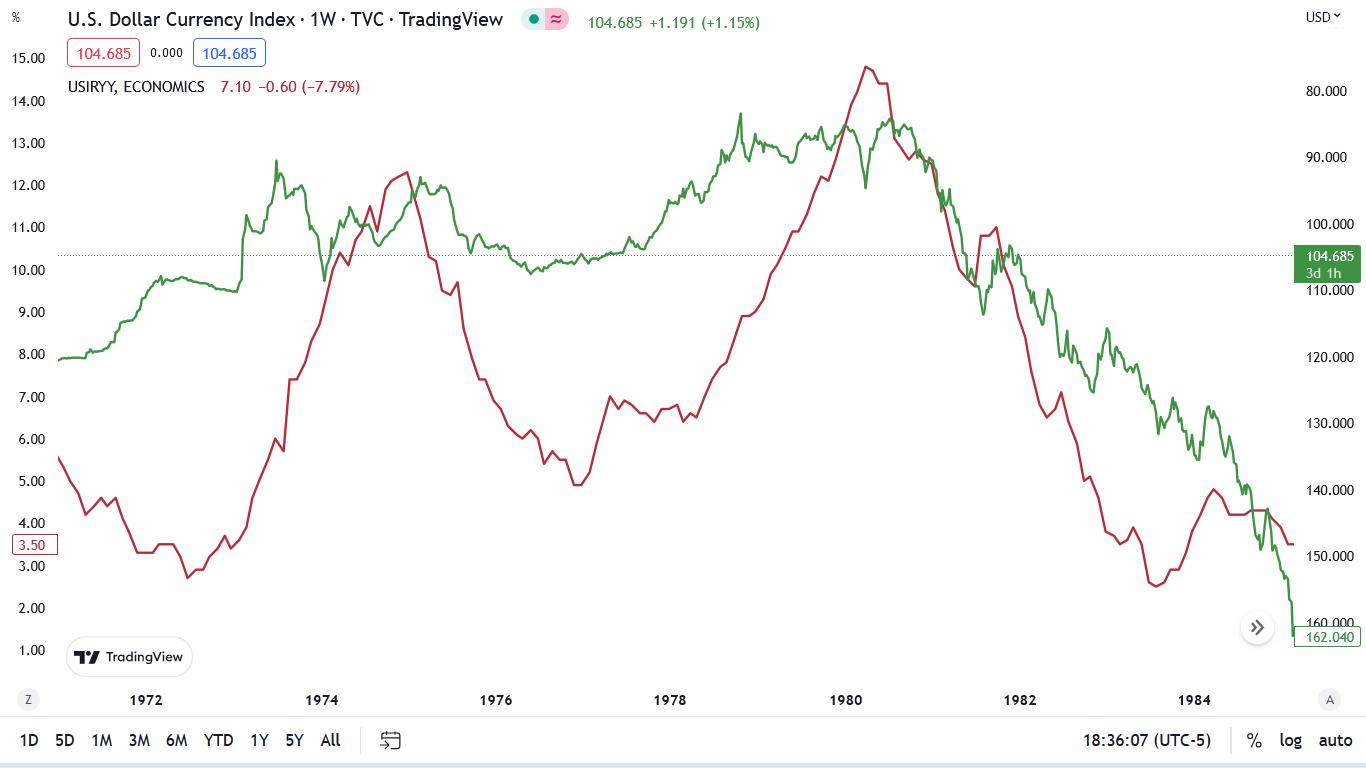
To explain, the red line above tracks the YoY percentage change in the headline CPI during the 1970s/early 1980s, while the green line above tracks the inverted (down means up) USD Index.
If you analyze the relationship, you can see that when inflation soared in the early 1970s, it culminated with the USD index falling from ~120 to ~90. Likewise, the second inflation surge in the late 1970s culminated with the USD Index falling from ~108 to ~83.
Yet, the right side of the chart shows that when the USD Index soared from mid-1980 on (green line falling), the YoY CPI collapsed and returned toward the Fed’s 2% target.
The moral of the story is that the inflationary malaise of the 1970s occurred alongside substantial declines in the USD Index, which intensified supply-side inflation and helped create the stagflationary backdrop.
However, that’s not the case today. The USD Index ended the Jan. 3 session north of 104, and we don’t see it falling to ~90 or ~83 in 2023. In contrast, we expect new highs to materialize, and the notion of stagflation is rooted in an uninformed analysis of the historical record.
What’s Uplifting the Price of Gold?
Now, if stagflation is an unlikely event, then what’s uplifting the gold price? Well, it’s all about rotations. With a resilient economic climate not providing the catalysts for liquidations, a ‘Lehman moment’ is unlikely in the near term.
Therefore, with investors avoiding tech like the plague, they’re hiding out in ‘old economy’ sectors.
Please see below:
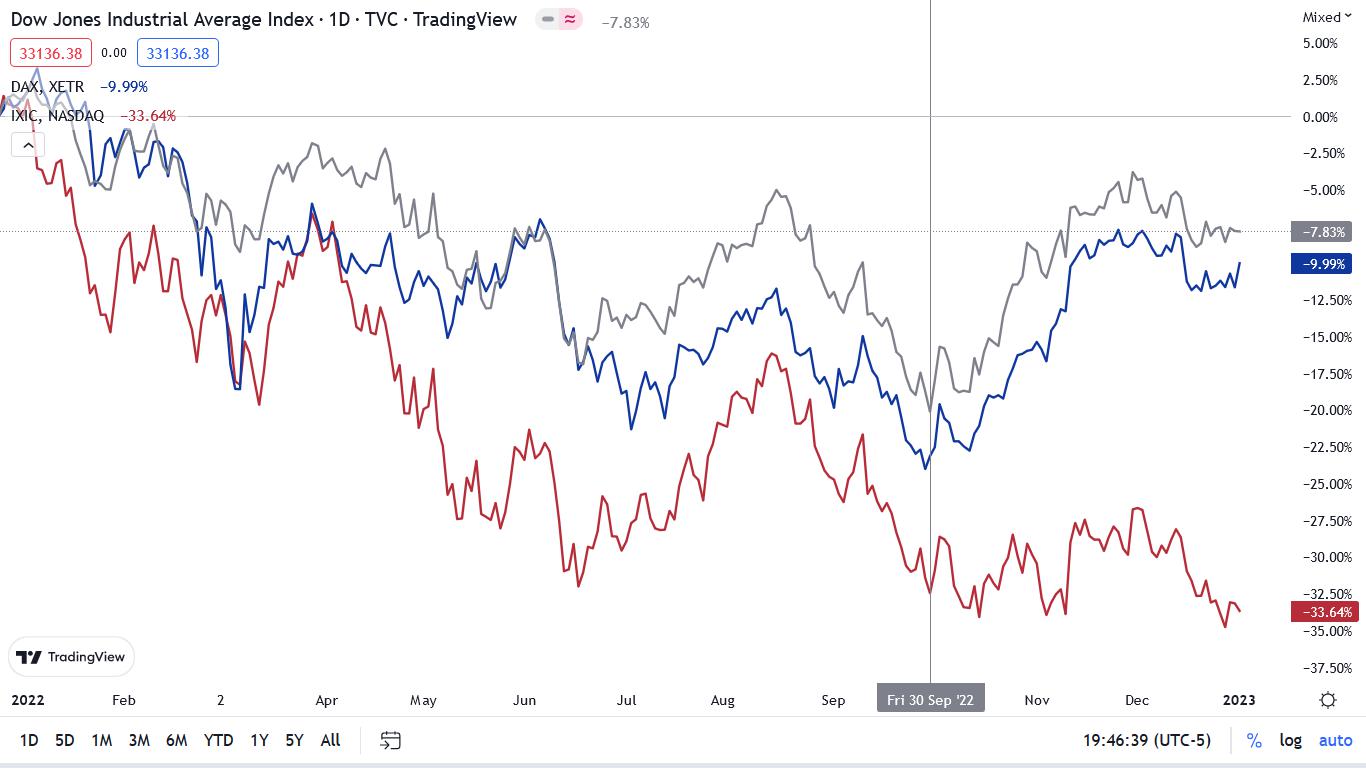
To explain, the gray, blue and red lines above track the one-year performances of the Dow Jones Industrial Average (DJIA), the DAX Index (German benchmark) and the NASDAQ Composite. As you can see, the NASDAQ Composite has substantially underperformed its ‘old economy’ counterparts.
In addition, if you analyze the vertical gray line near the right side of the chart, you can see that the DJIA and the DAX Index have risen sharply off their recent lows, even as the NASDAQ Composite hit new lows. Thus, while the QE kings have been slaughtered, money has simply moved into other areas of the market.
But, while the NASDAQ Composite was the first to bounce off the March 2020 lows and is now the first to fall, the ‘old economy’ sectors should suffer a similar plight in the months ahead. It’s simply a matter of time before the demand destruction that crippled Big Tech comes for financials, industrials, materials, and energy.
Overall, rotations and false narratives have uplifted the gold price; and while the metals seem invincible right now, there was a time when Apple and Tesla were considered untouchable, and look at them now. So, while we remain bullish on the PMs’ long-term prospects, a final sell-off should occur before the next bull market begins.
Alex Demolitor
Precious Metals Strategist
*********
 Alex Demolitor hails from Canada, and is a cross-asset strategist who has extensive macroeconomic experience. He has completed the Chartered Financial Analyst (CFA) program and specializes in predicting the fundamental events that will impact assets in the stock, commodity, bond, and FX markets. His analyses are published at GoldPriceForecast.com.


