CRASH Of 2016…Is It Here Yet?


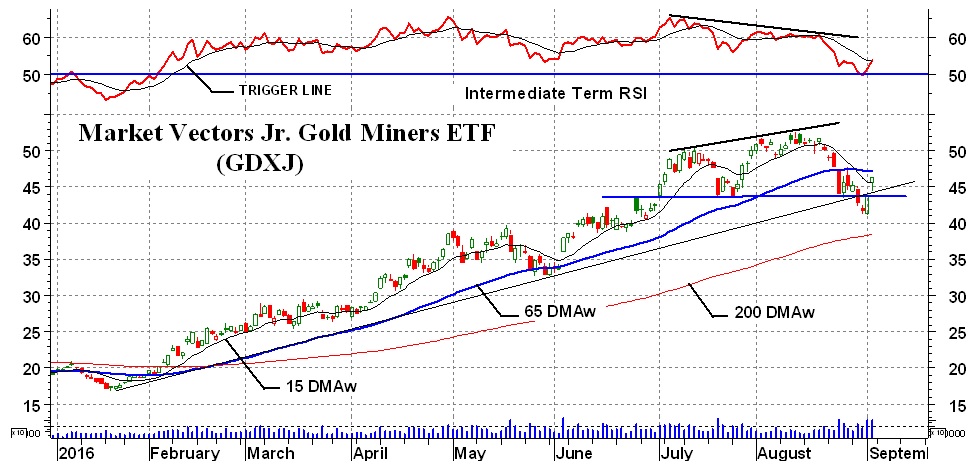
I couldn’t think of a catchy title, so I thought I’d just throw that one out. There are some who think that a gold crash is just down the road. The chart of the Market Vectors Jr. Gold Miners ETF (see below) seems to be pointing in that direction. It is in its very early stage…so anything can still happen. But let’s not worry about what’s down the road, let’s concentrate on where we are and what direction we are heading right now.
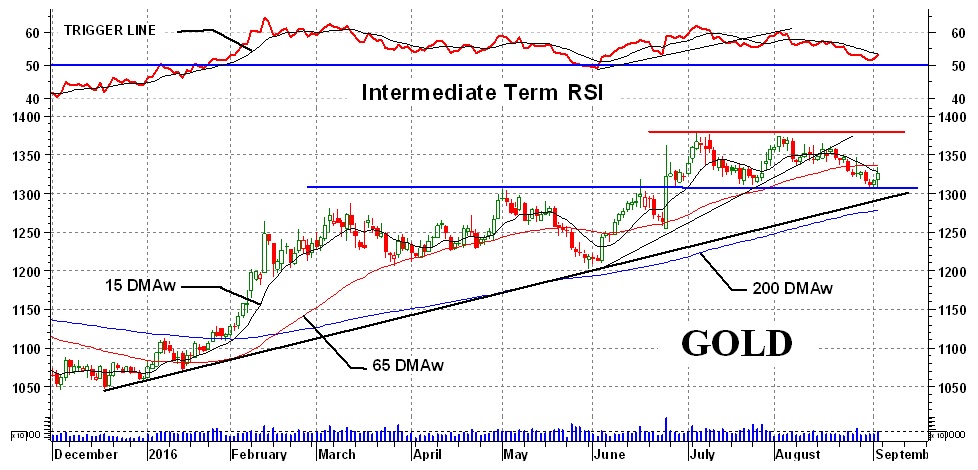
Gold finished last week almost where it left off the previous week. It was up but only by $0.80 or less than 1/10 of 1 %. Thursday and Friday looked like the start of a new rally, but it is too early to definitely state so. We’re still in that “box” pattern although very close to a bearish break. The Thursday/Friday bounce had been off the “box” support level. However, it’s off its long-term up trend line and moving averages (well, not quite off these but close). One might be looking at a short-term rally but the momentum indicators are still suggesting weak market action.
Long-Term
Gold is continuing to trend weaker and weaker from the long term perspective, but still not yet into the bearish camp. The price of gold continues to track above its positive sloping long-term moving average line. The long-term momentum indicator is still in its positive zone but moving downward and is below its negative sloping trigger line. With only this one negative in the basic indicators it is not yet time to downgrade the long-term rating, which remains BULLISH.
As mentioned earlier, we are still above a long-term uptrend line (my third FAN Principle trend line from earlier discussions). There is some evidence to suggest that when the indicators are positive (bullish) for one time period, the next LOWER time period, although it may be going in the opposite direction, will be pulled back into the direction of the higher time period. To put this another way, should the long-term rating remain bullish then any reversal of the intermediate term rating to the bearish side should prove short lived. This is true throughout a major long-term bull market but unfortunately the long term bull could end and that would not come until the intermediate-term has already moved lower some distance. Any speculator not acting on the intermediate-term bear because of the thought that the long-term bull will cause a reversal back to an intermediate term bull would be sadly surprised.
Intermediate-Term
We are getting a mixed message as far as the intermediate-term is concerned. The gold price sits just below its intermediate-term moving average line and the line slope has just turned oh so minimally downward. The momentum indicator is still in its positive zone and trying to rally but is still just below its negatively sloping trigger line. Although these indicators are so very close to reversal positions, at the close on Friday their combined positions gave us a BEARISH rating. The indicators, at this point, are so close to their reversal positions that one positive day in gold could totally reverse this rating so take it with caution, at this time.
The gold price remains in that “box” pattern and from that we might consider the trend as a lateral trend until the box is broken. We can also pick double tops and double bottoms in the price action but these are what define the “box” pattern so it’s no use going into them. We’ll have to wait for a break above the tops or below the bottoms to see which direction the trend is going but we already are doing that with the “box” definition.
Short-Term
The short-term looks like it just might be improving. Although the price is just below its negatively sloping moving average line the short term action seems to be towards the up side. The momentum indicator is still in its negative zone but improving and has moved above a now positive trigger line. Although things can change very quickly, at the Friday close I can only rate the short-term as BEARISH but improving.
There are a few more features in the chart but as with last week, I’ll leave some for your imagination.
Gold And Silver Stocks
The gold and silver stocks closed mostly higher on the week but still generally on the bearish side, except for the long term.
The Merv’s Gold & Silver 100 Index closed the week on the up side by 1.7%. There were 69 stocks advancing and 29 declining with 2 unchanged. The week ended with overall BULL/BEAR ratings at 18% positive and 70% negative on the shorter term, 27% positive and 62% negative on the intermediate-term and 65% positive and 14% negative on the long-term.
The Merv’s Penny Arcade 50 Index closed higher by 1.4%. There were 23 advancing stocks and 18 declining stocks with 9 unchanged. That was not a good showing when compared to the numbers in the 100 Index. As for the overall BULL/BEAR ratings, the shorter-term showed 34% positive and 58% negative. The intermediate-term showed 43% positive and 47% negative while the long-term stood at 73% positive and 22% negative.
The Merv’s Silver 30 Index had an advance of 1.5% on the week. There were 23 advancers, 6 decliners and 1 unchanged. The overall BULL/BEAR rating stood at 15% positive and 73% negative on the shorter term, 30% positive and 60% negative on the intermediate-term and 80% positive and 15% negative on the long-term.
Market Vectors Jr. Gold Miners ETF
The major North American Gold Indices moved by only a fraction of a percentage this past week. The PHLX Gold/Silver Sector Index (XAU) closed higher by 0.9%, the NYSE Arca Gold BUGS Index (HUI) closed higher by 0.7% and the NYSE Arca Gold Miners Index (GDM) closed lower by 0.1%.
The Market Vectors Jr. Gold Miners ETF (GDXJ) was one of the better performers during the past week (and overall since the start of the year) with an advance of 2.5%. Although the action on Thursday and Friday looked like the start of a possible rally there are three significant negatives to overcome. First, there was that serious negative divergence in the price action versus the momentum in July and August. This was followed by a breaking of its intermediate term support at the 40 level which was quickly followed by the short term moving average line dropping below the intermediate term line. By this time the price had already dropped below its intermediate term moving average line and the line itself has turned downward. The Friday close was just above the line but nothing else has changed yet.
It remains to be seen if the potential rally which started on Thursday will have any longevity.
As a representative of the secondary gold and silver stocks, this ETF is saying to be very cautious and maybe hold off jumping in until better confirmation of trend.
********
Readers are invited to view my Facebook page at https://facebook.com/merv.burak where I will be slowly posting commentaries explaining in more detail my various indicators and techniques. I also present from time to time some individual stocks that look as if they may be good speculations. However, nothing I post is meant to be a recommendation to buy or sell. One should check with their broker or investment advisor before acting.
 Merv is a retired Aerospace Engineering consultant. He is also a retired market technician with over 40 years of market experience and research. Merv received his certification as a Chartered Market Technician (CMT) in 1992. Developer of many technical techniques and programs which he has been using in his previous Technically Speaking with Wil-Arm and Technically Precious with Merv commentaries posted throughout the globe. Developer of several gold and silver Indices, Merv continues to update his Merv’s Gold & Silver 100 Index and Merv’s Penny Arcade 50 Index and reviews them during his periodic on-going Technically Precious commentaries.
More from Gold-Eagle


