Crude: Chop, Chop, Chop


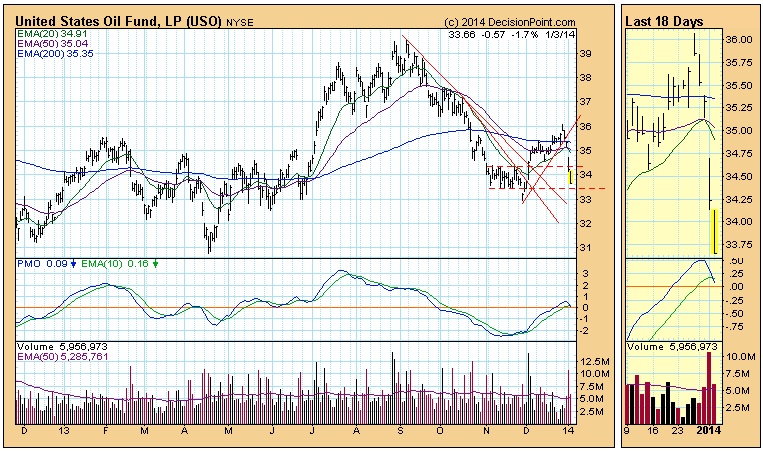
The chart for USO (U.S. Oil Fund) has been confusing for some time.
Most recently USO rallied sharply from its November low, only to drop sharply from its December high, taking back nearly all of the gains. Typical action over the last year is that sharp price changes in one direction are followed by sharp reversals. Moving average analysis shows the 20-EMA below the 50-EMA (nominally intermediate-term bearish), and the 50-EMA is below the 200-EMA (nominally long-term bearish). Bearish EMA relationships aside, we can see that the last year has produced many EMA crossovers and reversals, so, while we consider the trend to be down in all time frames, the trend in a broader context is indecisive.
By zooming back to a seven-year weekly chart we get a much clearer understanding of what is probably driving current prices. This is one of the best examples of a parabolic rise and collapse that we are likely to find. First there is the frenzied buying, driving prices up in a nearly vertical path. Then upward momentum ceases abruptly and prices collapse, sometimes at an even steeper angle than they advanced. The final phase is when prices enter a basing pattern, which is a trading range wherein all the craziness that preceded it is digested in preparation for the next advance. This can take years and years.
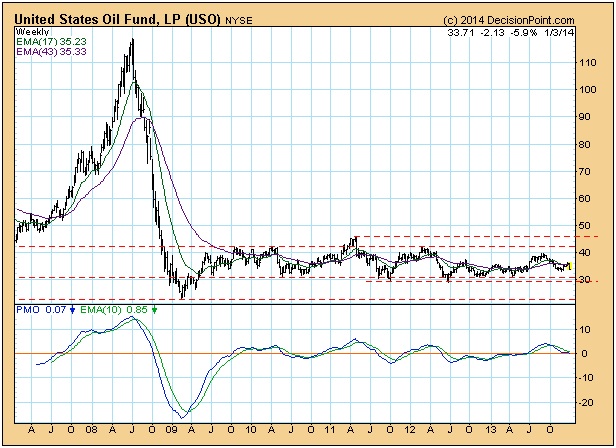
Conclusion: Our nominal EMA analysis says that USO is in a down trend, but looking at actual price movement over a long period, we can see that USO has been in a basing pattern since 2009. This sideways movement can subject some timing models to unprofitable whipsaw, and the best approach would be to try to "work the range" -- sell at the top of the range and buy at the bottom -- rather than try to anticipate the eventual breakout from the trading range and the next large advance.
* * * * * * * * * * * * * * * * * * * * *
Technical analysis is a windsock, not a crystal ball.


