Daily Volatility In Gold, Silver And The Dow Jones Index


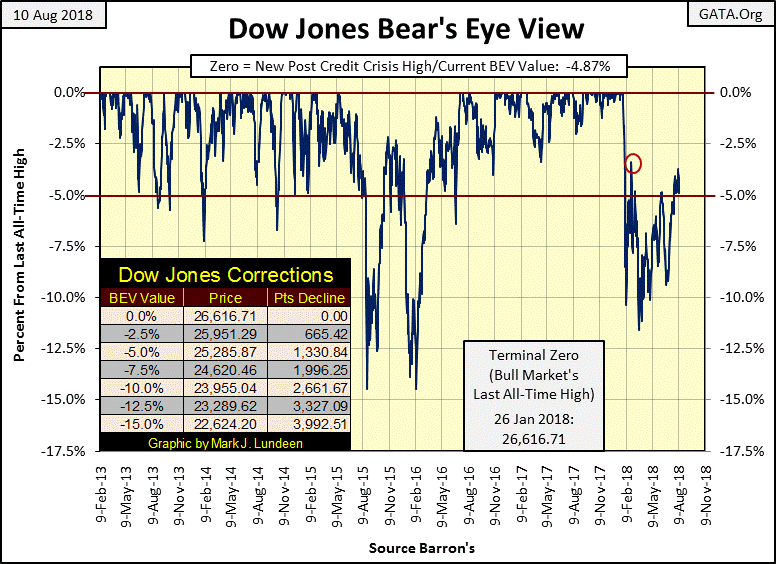
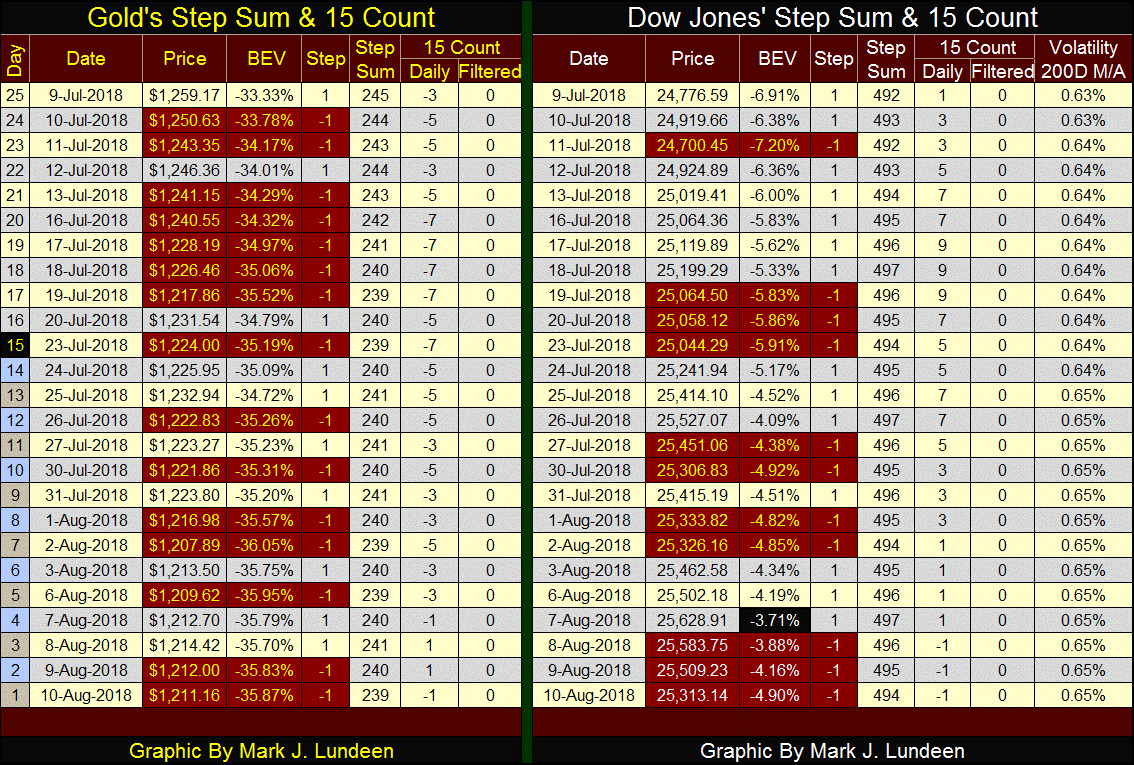
The stock market is in its dog-days of summer; for the past month the Dow Jones didn’t want to go up yet refuses to go down. Since July 16th (twenty trading days) the Dow Jones has remained in a tight trading range in the BEV chart below, from -3.71% down to -5.91%.
Comparing the low volatility of the past twenty trading sessions with the other similar periods in the BEV chart below shows the past twenty trading days as something unusual but not really rare. If the past is any guide, and it usually is, when the Dow Jones finally breaks out of its current quiescent state of trading we should see some excitement. Whether that’s to be a break out above its BEV -2.5% line or a decline below its -7.5% line is something we’ll just have to wait and see.
I still haven’t given up on the Dow Jones making a new all-time high. But from its close of today that would only be a gain of 4.87% in a market that I believe is at risk of declines of greater than 40% sometime in the next year. After a nine year, 21,000 point advance in the Dow Jones, buying shares now in the broad market is buying at the top of the market. In August of 2018 that’s just a fact, and buying at a market top is something I’m not going to recommend my readers do.
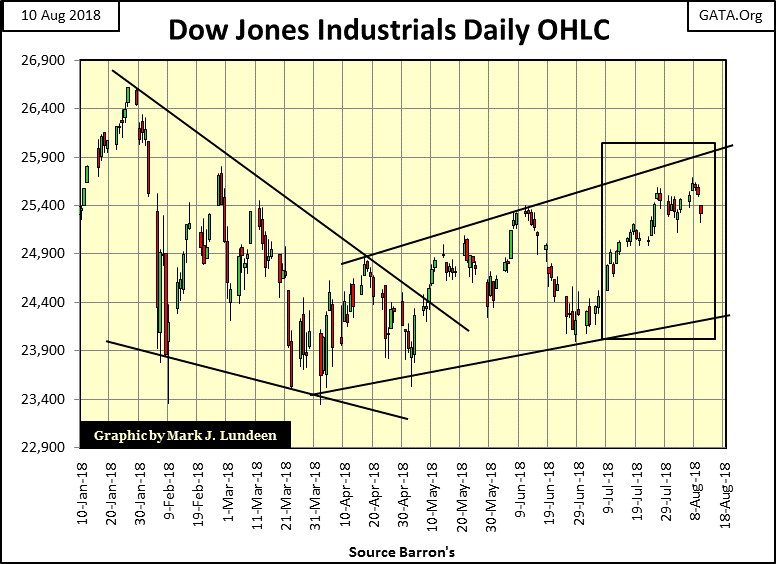
Looking at the daily bars below, the Dow Jones began the week well enough, but after Tuesday began leaking air. What this market needs is an “injection of liquidity” large enough to drive the Dow Jones up above its 25,900 line with authority. But will it get it?
Your guess is as good as mine. What isn’t conjecture is the Dow Jones isn’t going to remain in its current state of suspended animation forever. Somewhere ahead of us is a week or two of big daily moves that is going to put an end to this boring market action and most likely will show us the direction of the next big thing in the market.
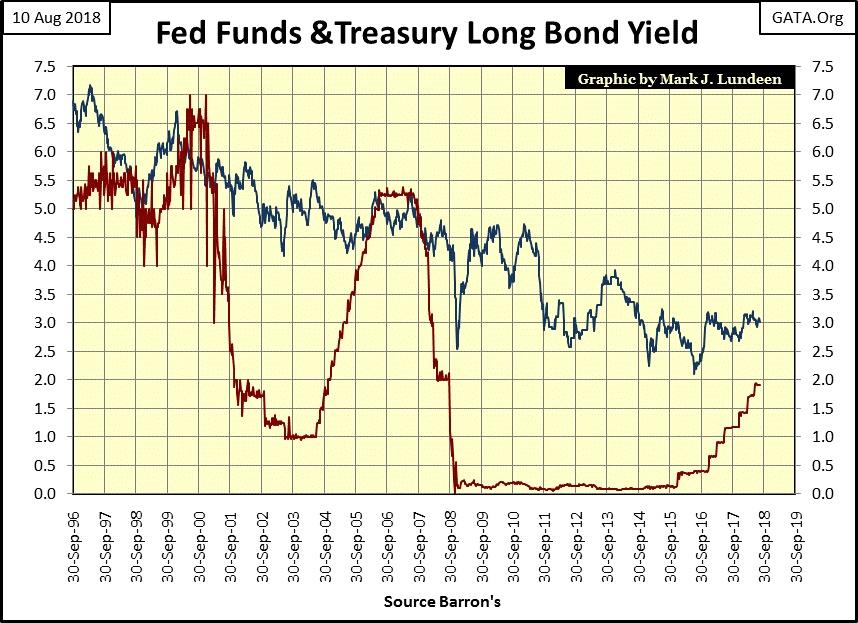
That interest rates and bond yields will be key to what the stock market’s next big move will be remains a logical assumption. In late 1999, seeing the Fed Funds Rate (Red Plot) rise above the long T-bond yield (Blue Plot), and again in 2006 signaled the end of a bull market in stocks. It won’t be any different this time when the FOMC once again inverts their Fed Funds Rate over the long T-bond yield.
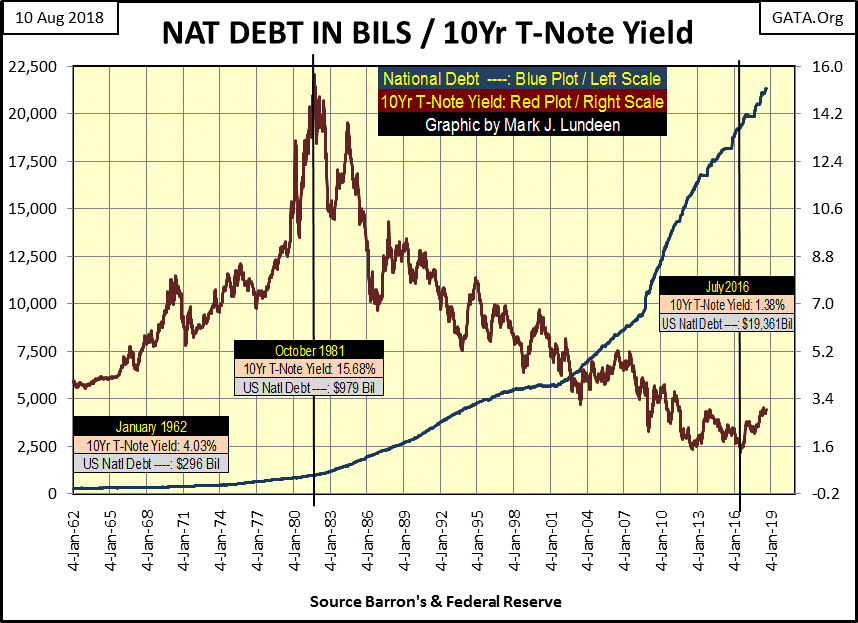
Last week I wondered how bond yields could be so low in a world groaning with the burdens of debt it now carries. Look at the chart below. Why did T-bond yields peak at over 15% in October 1981? Annual double-digit percentage increases in consumer prices were one factor. But seeing the US National Debt increase from an alarming $296 bil in January 1962, to a shocking $1 trillion in October 1981 was a big factor too. Back in 1981, people were wondering how the US Treasury was going to repay all that money?
Today who asks such questions? Does anyone wonder how students and consumers are going to pay back the debt they now carry? I don’t, because before the pending bear market concludes they’re going to default on most, if not all of it. This is what Mr Bear does when he pays Wall Street a visit; he stress tests everyone’s balance sheet. Inflated market valuations are deflated, unviable assets, such as but not limited to student and consumer debts are ultimately written off.
And if the US Treasury doesn’t default on its many trillions of dollars of obligations to its creditors, the dollar the Treasury’s debt is denominated in will become worthless. One way or another, the global debt markets are going to burn up like a Nebraska prairie fire.
But few people believe that is possible, while it’s actually inevitable. In the chart above, look at what happened from October 1981 to July 2016. In these thirty-five years the US national debt soared from $1 trillion, to $19 trillion as 10Yr bond yields dropped from over 15% down to 1.38%. Exactly how does that work? It’s a “policy” thing most people wouldn’t understand – or so we’re told. But Robert Bleiberg had it exactly right in his editorial of 11 June 1979 below.
“To serve as a central banker, as BARRON’S again reminded its readers early last year when G. William Miller took over at the Fed, one needn’t be a flim-flam man, but it helps.”
- Robert M Bleiberg: Barron’s Managing Editor, 11 June 1979
A reader (John S.) sent a link to me on an article by Trader Vic on the Treasury bond market. Trader Vic is a Wall Street legend who co-wrote Crashmaker, a Federal Affair, with Alvaro Almeida, a tremendous novel on the Federal Reserve which was actually fun to read. Here’s James Turk’s review.
https://www.fgmr.com/crashmaker-a-must-read-book/
Anyway, Trader Vic’s knowledge of the market is deep and anything he says I believe, as he has something the mainstream financial media lacks, something called credibility. Here’s the link John S. sent to me.
https://www.theepochtimes.com/the-rules-of-the-bond-game_2600435.html
I’m not going to review the article above. It’s a short read. I’m just going to say you’ll appreciate just how ethically challenged bankers and their regulators have become in their many decade long efforts to keep market valuations inflated, and Mr Bear far away from Wall Street. That’s not saying the Federal Reserve System is doing anything illegal. Lord knows the banking system has sent enough money into the personal coffers of our law makers to make sure that couldn’t happen.
But how long can the banking system continue bamboozling reality? Not forever is my answer. When this scam in the T-bond market concludes bond yields and interest rates are going to soar; and the Dow Jones, gold and silver are going to make history.
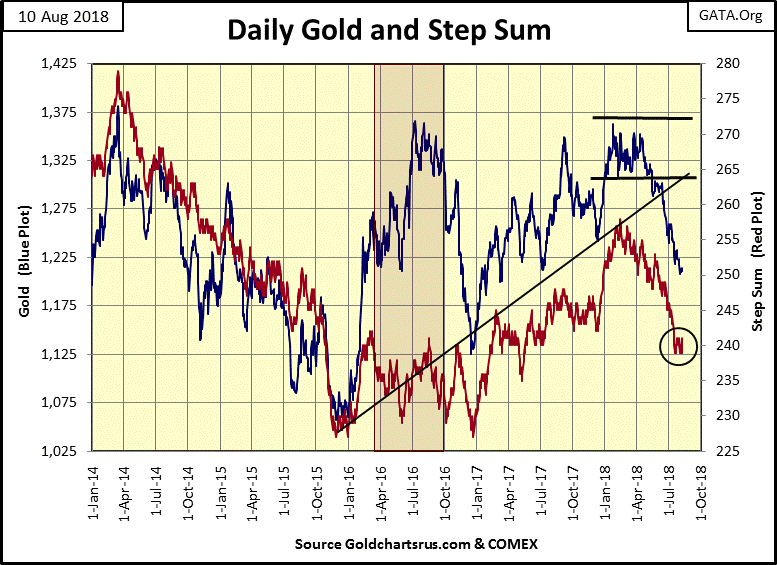
Not much in the way of relief has come gold’s way since early April. But seeing a four month decline as we see below tells me a reversal is due. I circled gold’s step sum, it hit 239 on July 19th and hasn’t been able to break below it in the past seventeen trading sessions. It may mean nothing; then again it may be an indication the current decline in the gold and silver markets is near their bottom, ready to rebound.
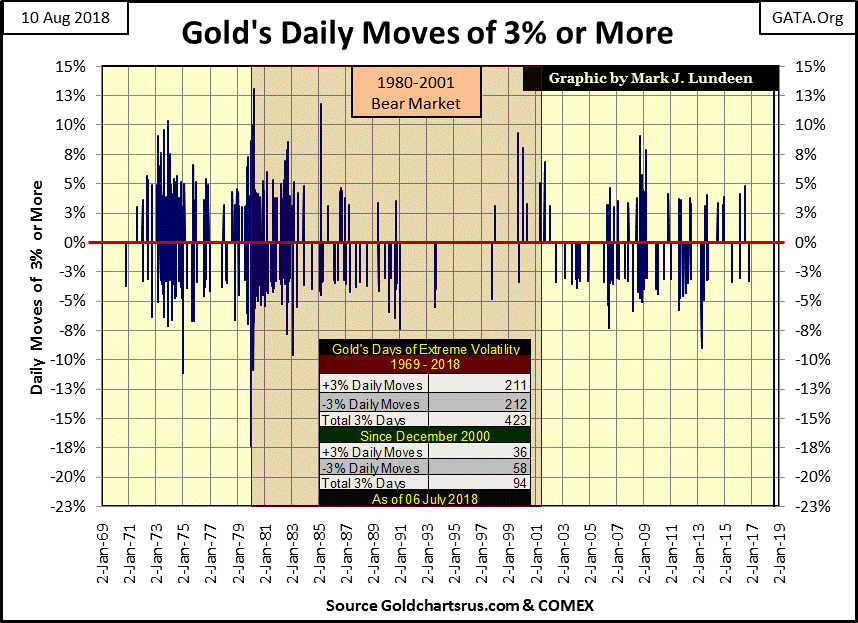
I haven’t covered volatility in the gold and silver markets for quite a while, as there hasn’t been much to write about. Like 2% daily moves for the Dow Jones, I look at 3% days for gold and 5% days for silver. These percentage values are arbitrary, so if someone decided to use different values there is nothing fundamentally wrong doing so, but these work for me.
In August 2018, I find it interesting how gold hasn’t see a day of extreme volatility, a 3% day since 04 October 2016 in the chart below. Just eyeballing the chart, this is the longest gap between 3% days gold has seen since the 1990s.
Below, silver’s last day of extreme volatility (5% day) was on 11 November 2016. That’s a long time too.
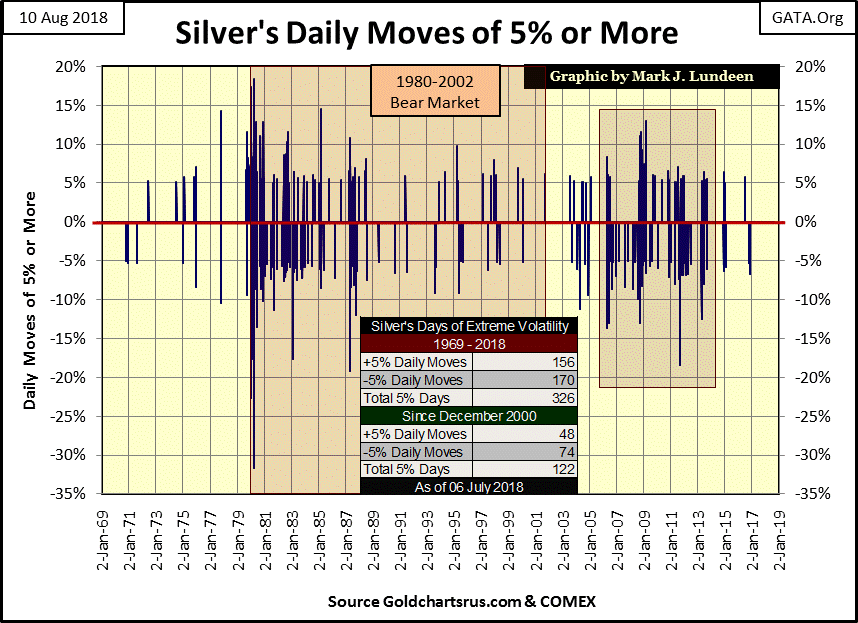
With the Dow Jones, extreme days are usually associated with market declines, though occasionally they happen in isolation during market advances. It’s different for gold and silver. With the old monetary metals, extreme days of volatility happen when the market is moving with authority to either the up and down side.
That gold and silver haven’t seen a day of extreme volatility for almost two years tells us how boring the market action has been for the metals since 2016. That’s not saying that the decline in gold and silver prices since April haven’t been grating on our nerves. It has been. I’m only pointing out that a >3% daily move in gold or a >5% daily move in silver are big market events that we haven’t seen for almost two years now.
Note the multitudes of extreme days gold and silver saw during their 2011-2015 market declines, extreme days the gold and silver market has been totally free of since their current declines began in April.
Like anything else in the markets, the current calm in the gold and silver markets isn’t a permanent condition. I’m going to begin watching for 3% and 5% days in the precious metals. Seeing gold and silver begin forming a new cluster of extreme days (both positive and negative) in their charts above come their next advance would be a very bullish situation.
As I mentioned days of extreme volatility for the Dow Jones I may as well show a chart for the Dow Jones 2% days too. The last Dow Jones >2% day was on April 6th of this year. That was only four months ago.
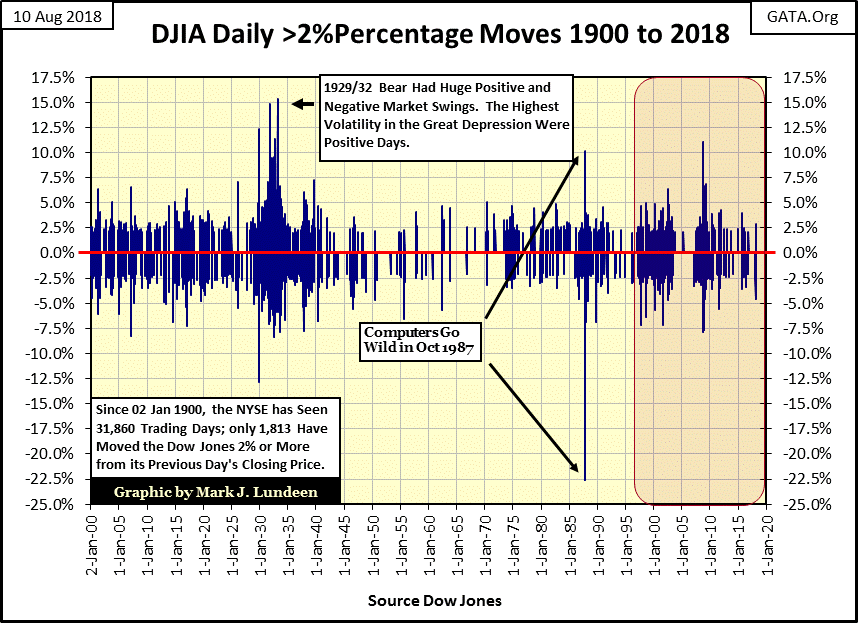
The Dow Jones’ 200 count is plotted below, or the number of (+/-)2% days the Dow Jones has seen in a running 200 day sample. This chart shows how toxic extreme volatility is to the stock market. Note how the current Dow Jones top of January 26th (26,616.17) corresponds with a rise in the Dow’s 200 count from zero to seven.
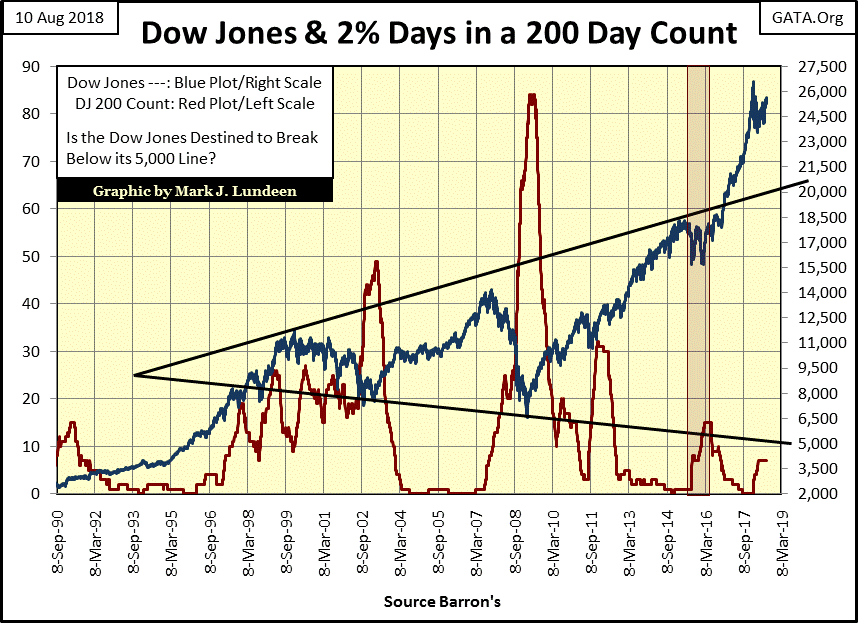
The first of these seven extreme days occurred on February 2nd and the last on April 6th. So for the past four months the market has been free of them. But if you look at the Dow Jones Step Sum Table below, note the Volatility 200 Day M/A column.
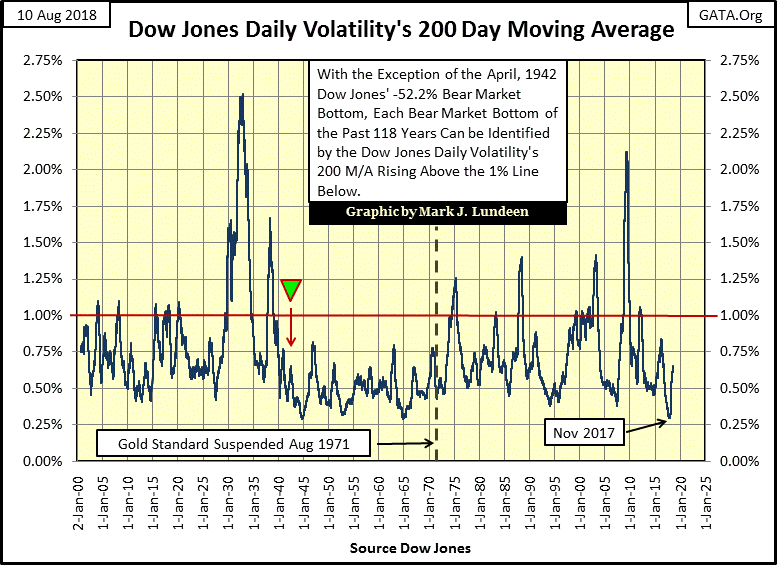
What’s being recorded in that column can be seen in the chart below plotting the daily volatility for the Dow Jones going back to January 1900. Note how volatility bottomed last November, two months before the Dows Jones made its last all-time high in January 2018.
We’ve seen the Dow Jones 200 count increase to only seven since January in the 200 count chart above, but looking at daily volatility for the Dows Jones below, its 200 day M/A bottomed at 0.30% last November and closed this week at 0.65%. This is a big increase in daily volatility, and soon after it began increasing in November 2017, the Dow Jones peaked two months later in January.
Should this trend in rising daily volatility continue, and push the plot above the 1.00% line, 118 years of market history seen below strongly suggests we’ll be in the third bear market since the beginning of the 21st century.
If your main source of news is from the mainstream media (MSM), you’re aware the major news topic is how the Russian’s colluded with Donald Trump in his presidential campaign of 2016. It’s all a lie. That the MSM has ignored evidence that Hillary Clinton colluded with Russian and British intelligence agencies in her bid to become president. That they have done so for over two years makes the MSM accessories after the fact to any crime Hillary has committed, or they should be.
You have to keep in mind the Federal Government, Wall Street, Hollywood and academia are big honey-pots of money that have attracted all the wrong people. People who for decades knew they were above the law, and took full advantage of this status. Massive crimes have been committed by powerful and influential people who now are feeling the heat of President Trump’s Justice Department, and they don’t plan on going down quietly.
For that reason I believe we’re on the verge of a civil war as the Anglo-American establishment comes under attack by President Trump. In this civil war there may not be any disturbances in the streets. That shouldn’t happen unless the US Treasury stops sending out checks. But the Federal bureaucracy, media and the way things work in Washington will be greatly altered should Trump be successful in draining the swamp.
After losing the last presidential election to Donald Trump, the Left has become deranged. In the coming November elections the Democratic Party is running on the impeachment of President Trump, for what high crimes and misdemeanors they know not after a year and a half after he came into office. Not that it matters, they know only that Trump must go.
But why? Greg Hunter has some thoughts on this in his weekly update at the link below. Greg says (and I’m sure he’s correct) the establishment has been committing criminal acts for decades, and they know President Trump intends to hold them accountable. When you know the Justice Department has the goods to send you to prison for life, what does it matter if you commit other crimes in an effort to prevent President Trump from setting your day in court?
Looking at the unhinged coverage the mainstream media has given Trump, even months before he won the November 2016 election, I’d be very surprised if the corporate officers of the MSM and key personal (such as their journalists) aren’t aware that they too are at legal hazard with Trump in the Oval Office.
Silicon Valley’s social media giants are openly censoring conservative opinion. My favorite YouTube channels have been deleted by GOOGLE. This is no different than when Nazi Germany burned books it disliked; Silicon Valley’s elite is censoring political thought in a thuggishly effective fashion; they simply delete those they disagree with. The mainstream media is applauding GOOGLE and Facebook for doing it. They slanders those who speaks against them as racist, islamophobic, gay hating, anti-transsexual Nazis.
When Hugo Chavez ran for president of Venezuela in 1998, I don’t know what he promised the masses. They must have been real whoppers because he won by a landslide. But long before citizens of Caracas slaughtered their zoo’s animals for food, they must have figured out that if the world was perfectible, it wasn’t going to be Hugo that would perfect it.
That’s pretty much it for those at the bottom of the social order, who throughout the 20th and now the 21st century, demanded, and sometimes took “direct action” to get people smarter than themselves to take control of the state and pass those laws needed to make the world a better place. In other words after getting what they demanded, ultimately they got what they deserved.
But what about the Leftists at the top? There are plenty of books on Hitler and Stalin for you to read. As for our current situation in the United States, in the post Hillary Clinton for President Campaign era, the Trump Justice Department has over 40,000 sealed indictments waiting to be executed. According to Qanon, some by military police who will then escort their charges to Gitmo for a military style tribunal for treason. I’m fine with that.
The following link goes to Pastor Steve Cioccolanti’s comments on what law is. Pastor Steve’s view point is one based on the Bible, but this was also the view point of the framers of the American Constitutions; that people with political power are dangerous. Understanding this provides a key to understanding the problems modern society has with its legal system, the recognizing the boundaries mere mortals should have in creating laws.
Examining the laws given in the Bible, one finds they are in the main negative laws – thou shalt nots. In such a legal system as long as you don’t break one of these prohibitions, such as thou shalt not murder, lie or steal, you’re okay. However in the 20th century, when Karl Marx superseded Moses and Christ in our education system, Marxist academics have provided government with the personnel, and the moral justification required to do what must be done to overthrow the old and bring in the new.
Laws in the main have become positive laws – you will stop doing that and begin doing this as politicians and academics, people who have no duty to God became the authors of the laws.
The unchecked use of the state’s police powers as prescribed by laws written by political parties is what made Communist Russia and Nazi Germany such tyrannies. You’re wrong if you think America would have been different than any other country infected with socialism had Hillary and her Democrats been voted into power in November 2016.
Anyway, Pasture Steve’s video is less than fifteen minutes and well worth your time.
Mark J. Lundeen


