Durban Deep a Top Performer in 2002


Durban Roodeport Deep (symbol: DROOY) is a stock that is very near and dear the hearts of thousands of traders and investors. When Durban is hot, it can be one of the fastest-moving, highest-rewarding stocks among low-priced gold shares. Its percentage gains during such times are sometimes nothing short of staggering. It remains a favored trading vehicle for gold stock traders and investors around the world.
Since writing our last long-term forecast of Durban Deep last summer on Gold-Eagle, Durban's share price rose some 400% and was a top-performing gold mining play of the past year. To update our outlook on Durban Deep, we are dedicating this article to examining how well Durban could perform in the weeks and months ahead in an environment of rising gold prices. Durban Roodeport Deep is a South African gold mine that has a long and storied history that spans over 100 years. It also sports one of the highest market cap/ounce reserve ratios of any gold stock in the world, as little as one-twenty-fifth the price of other world gold producers. It's past stock price performance has made fortunes for more than a few gold stock investors, including the famous Jim Blanchard (now deceased) who considered Durban to be one of his all-time favorite gold stock plays. Blanchard always pointed out that when the going was good for gold prices, the going got really good for Durban Deep.
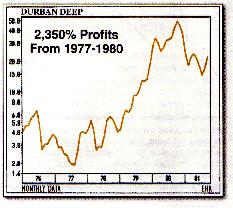
To quote Blanchard, "For over 30 years, 'DROOY' has been a favorite of U.S. 'gold bugs' because it is a marginal mine, a high cost producer that barely turns a profit when gold prices are low, but whose profits absolutely explode in a rising market. The benefits of a marginal gold stock are very simple. For example, if a company is just about breaking even and producing 500,000 ounces of gold, any $10 increase in the price of gold immediately adds $5 million in positive cash flow. That's a dramatic move from breaking even. In a major upward move of $100 an ounce, the company goes from breakeven to a positive cash flow of $50 million almost overnight! The result is that a 20% or 30% rise in gold often multiplies the price of a marginal share three or more times over." [Source: Gold Newsletter, September 1998] Note the reproduction of the Durban Deep profit chart below.
Added Blanchard, "It is these marginal producers that can become the ultimate winners in a healthy gold market-even better than gold exploration shares, because the marginals have already found the gold and in many cases have already spent the capital providing access and infrastructure."
The timeframe for this period of exponential profit growth that Blanchard spoke of is similar to the timeframe we are now entering in that the cycles and conditions are similar in many respects for the yellow metal. This means mines like Durban Deep will be especially poised to reap the rewards and return handsome dividends to investors who have the foresight to be at the right at place at the right time.
Let's start with Durban's short-term outlook. After an extraordinary upside run in the first half of the year, Durban peaked out in June and spent the summer months in decline and consolidation. After posting a bottom in late July, Durban has since crossed through two major lines of overhead supply and has just crossed above the benchmark $4.00 area, a major pivotal point. Note the reproduction of the daily chart below.
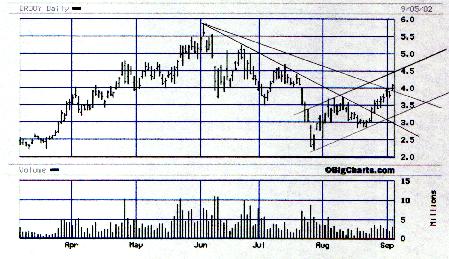
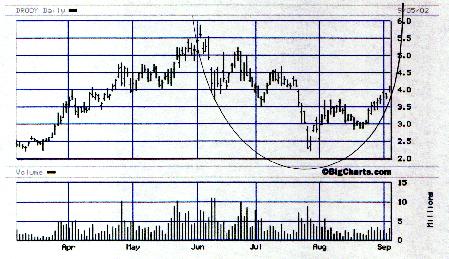
As this chart clearly shows, the current trend is still up and must be treated as such until the trend is broken. Note also from the above chart that Durban has overcome two lines of a potential "fan line" retracement. Durban in recent weeks has shown great strength in making higher highs and higher lows, the sign of a technically sound market. Also, note the daily chart with parabolic bowl still intact (below). This test of the rim of the bowl on Wednesday proved to be a successful one which accounts for the sudden reversal on Thursday. Basically, Durban Deep is being carried higher by the force of the parabola.
Every now and then it is good to step back and get a bigger perspective of the stock or commodity you are trading in, even if you are strictly a short-term trader. In this case, let's step back and look at Durban Deep's long-term chart, specifically the 10-year monthly bars. Examine the chart below.
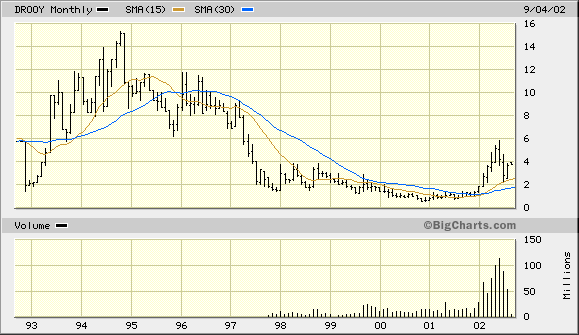
For this long-term picture of DROOY's price trends we chose to use the 15-month and 30-month simple moving averages. Why these timeframes? Because the 15-month MA comes close to approximating the sub-dominant trading cycle while the 30-month approximates the dominant trading cycle of less than three years duration. Notice that in the past decade only twice did the 15-month average cross above the 30-month average, in 1993 and again in 2002. Even though DROOY has sold off steeply form its June highs it is still above both moving averages and is currently being supported by the 15-month MA. Currently, the 15-month MA is at the area near $2.20-$2.25. The 30-month MA is just below $2.00. The most important feature of this configuration is that the shorter MA timeframe (the 15-month) is above the longer one, the 30-month, and both are in the ascending phase. Equally important, Durban's price line is above both moving averages and has been recently supported by them, underlying the strength of the current cycle. The key to a potentially explosive up-move in Durban in the months ahead (for intermediate-term-oriented traders) is the recent high of $6. This level serves as a pivotal point along its long-term chart. Overcoming this recent high on good trading volume would send the buy signal that should not be ignored and would harbinger a move to at least the $10-$12 area if not higher.
It is a fact that gold has a tendency to bottom and rally strongly in the timeframe between September and October. This has especially been true over the past 10-15 years, which correspond with the "hard down" phase of the K-wave. This bullish autumnal "seasonal" tendency has been documented elsewhere with respect to the precious metals market (including gold and silver equities), most recently in the fall of 2001 when the gold bull market last began. Looking back over Durban's trading history through the years, the months of September and October in particular have been propitious for DROOY. While we do not advocate trading stocks or commodities based strictly on seasonals, we have reason to believe that September-October could be big upside months for DROOY and the XAU this year.


