Epic Price Reversal For Commodities in 2014


If you want to know what happened in 2014 with regard to gold and oil, it’s important to appreciate the inverse relationship between the U.S. dollar and commodities. The following chart is a good place to start:
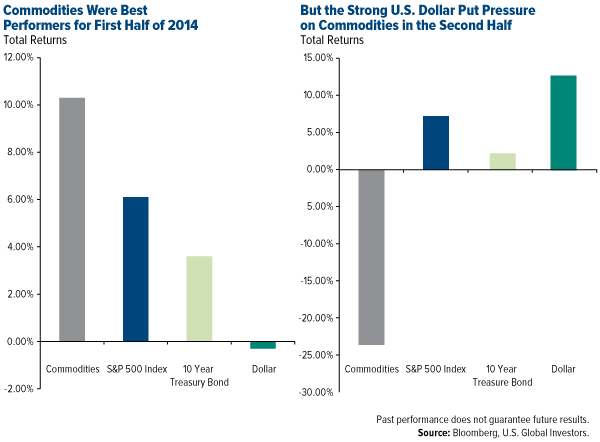
Whereas total returns for the S&P 500 Index and 10-Year Treasury bond stayed relatively stable throughout the year, commodities and the U.S. dollar both made an incredible about-face starting around late June, early July. If you don’t factor in China’s renminbi using purchasing power parity, the dollar is the world’s strongest currency. As I’ve written about on multiple occasions, this has weighed heavily on the commodities we track very closely and report on here at U.S. Global Investors, especially gold and crude oil.
According to BullionVault, in fact, 2014 was the worst year for commodities since 1986, when they gave back 8.85 percent.
That being said, let’s dive into the Frank Talk archives and look back at the most important commodity stories of 2014.
Oil Dropped Nearly 50 Percent Since the Summer
It should come as no surprise that oil dominated the news in the second half of the year. Since its peak in June, when West Texas Intermediate (WTI) crude was priced at around $105 per barrel, oil has tumbled nearly 50 percent to settle in the mid-$50s. We haven’t seen a decline such as this since the financial collapse of 2008 and 2009.
So how did prices get here? How did they fall so steeply, so unexpectedly?
It’s been a perfect storm, to be sure. For one, the U.S. shale boom has brought about what some call an oil glut in the market. The Saudis have resisted oil production curbs with the intention of undercutting the world’s competition, namely the U.S., Russia and fellow members of the Organization of the Petroleum Exporting Countries (OPEC).
Global growth and the Purchasing Manager’s Index (PMI) are also cooling, leading to tepid demand for oil. As I’ve mentioned on numerous occasions, when the one-month moving average for the global PMI falls below the three-month moving average, WTI crude has fallen 100 percent of the time six months later. Though past performance can’t predict future results, history illustrates a convincing trend.

And finally there’s the strong dollar, which has historically put pressure on commodities, most notably crude.

Granted, battered oil prices have led to cheap gasoline, giving consumers all around the globe a welcome tax break this holiday season—a $330 billion tax break, to be exact.
But many oil companies involved in hydraulic fracturing, which is a pricier process than more conventional drilling methods, are starting to feel the pinch. Several companies have already been forced to temporarily close rigs in pricier shale regions, including the Eagle Ford in Texas and Bakken in North Dakota.
As calamitous as this might appear, there are still investment opportunities aplenty. In this recent Frank Talk, I took a contrarian view, arguing that, because oil stocks are currently priced so reasonably, now might be the time to pick up some exposure to this space. As I wrote:
For far too many investors, by the time they gain back the confidence to put money into oil stocks again, the rally might have already taken off, making it challenging to capture the full benefit of the upswing.
And there’s reason to believe that prices will normalize sooner rather than later. Brian Hicks, portfolio manager of the Global Resources Fund (PSPFX), stated that “oil prices are below where they should be, and hopefully they’ll start gravitating back to the equilibrium price of between $80 and $85 a barrel.”
Gold Found the Support Where Oil Didn’t, Was the Second-Best Currency of the Year
Like oil, gold was punished in the second half of the year because of the strong dollar. In the following chart, from an October Frank Talk, you can see just how much of an impact the greenback has had on the yellow metal this year alone:

In this Frank Talk, posted in June, I wrote:
There is always an emotional bias against gold, whether it is soaring high or dipping low, and that is why it’s important to manage these emotions when positioning a portfolio. At U.S. Global Investors we look objectively at the action of both gold stocks and gold bullion by monitoring these long-term data points and paying attention to buy and sell signals based on the trend of mean reversion.
This, of course, was back when gold bullion was priced at above $1,300. Since then it’s slipped nearly 10 percent, which might have discouraged some gold bugs.
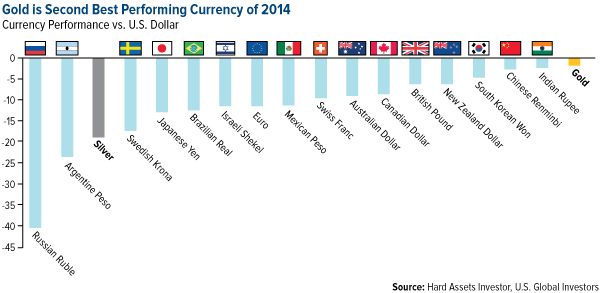
But according to a recent article from Hard Asset Investor, gold was actually the second-best-performing currency of the year, second only to the U.S. dollar:
Given the strength of the dollar, it’s surprising that gold has held up as well as it has. At current prices, gold is only down 2 percent year-to-date, which is actually the best performance of any of the major non-fixed currencies.
Before gold and other commodities began to slump, they were actually performing very well, as I mentioned at the beginning of the piece. Back in July, this is what it looked like when you compared gold spot prices and the NYSE Arca Gold BUGS Index:

For the first time in two years, gold mining stocks were beating bullion, which was good news for both the commodity and equities. When miners do well, gold has tended to follow suit.
But then in mid-summer, prices began to fizzle. When you chart the two asset classes for the remainder of the year, this is what you get:

The problem is that when spot prices are between $1,000 and $1,200 an ounce—which is now the case—it’s challenging for miners to break even in terms of cash flow. Gold royalty companies, however, continue to impress. Royal Gold has returned 39 percent year-to-date, while Franco-Nevada has delivered 22 percent.
According to Ralph Aldis, portfolio manager of the Gold and Precious Metals Fund (USERX) and World Precious Metals Fund (UNWPX):
Much of the gold mining industry is underwater and can’t make money with these prices. We’ve seen capital programs being significantly cut back, in terms of companies looking to expand and build new mines. That’s all been put on hold. Those companies have been sufficiently scared enough that, even when gold prices do recover, they’re going to hold off on expansions because they might have lost the appetite to risk capital on new projects.
But on a positive note, “Because of this, we might see prices firm up, and companies will be rewarded.”
As always, we recommend a 10-percent weighting in gold: 5 percent in bullion, another 5 percent in gold stocks. Then rebalance every year.
In a Time When Many Commodities Were Depressed, Diamonds Retained Their Glitter
I spend a lot of time writing and speaking about gold and, more recently, oil. But another commodity that we at U.S. Global Investors care about is diamonds. After all, the U.S. is the world’s largest diamond market, responsible for half of the world’s $72 billion in sales made annually.
 We hold luxury retailer Tiffany & Co. in our Gold and Precious Metals Fund (USERX). Although physical diamonds are a sound investment, diamond stocks can be even more of a prudent buy.
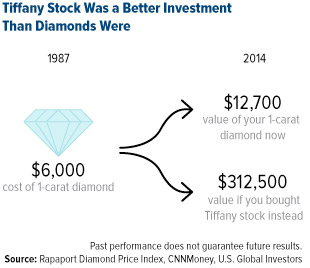
As you can see to the right, a $6,000 diamond purchased in 1987 would now be worth double that. But $6,000 in Tiffany stock purchased at the same time? Yeah, that would have returned 5,108 percent.
So guys, think about that next time you’re picking out a diamond ring or necklace for your significant other. Which do you think she might appreciate more?
In this Frank Talk from August, I discuss diamond exploration and mining company Lucara Diamond, held in both USERX and our World and Precious Minerals Fund (UNWPX). Lucara continues to be an attractive asset, returning 18.5 percent year-to-date. Since June, it has been paying dividends.
South African Labor Strike Brought Platinum and Palladium into the Headlines
Back in June, a five-month labor strike in South Africa, the country’s longest, was seriously threatening the world supply of platinum and palladium, used predominantly in the production of catalytic converters. The African country is responsible for 37 percent of the world’s palladium, 78 percent of the world’s platinum, with Russia largely taking up the rest of the slack. Every day the strike dragged on, thousands upon thousands of both platinum group metals were being lost.
Because of the strike and supply concerns, prices of the precious metals surged, platinum to $1,500 an ounce and palladium to $850 an ounce.
The conditions of the strike were finally resolved by the end of June—and not a moment too soon, as reserves were beginning to run dry. Since then, prices have stabilized. Platinum is now just above $1,200, palladium, around $815.
Solar Energy Will Increasingly Drive Silver Demand
Tom Werner, president and CEO of solar panel-maker SunPower, believes that solar energy could be a $5 trillion industry within the next 20 years. It’s easy to see why he feels this way, as demand for photovoltaic (PV) installation ticks up every year.

This news bodes well for silver, between 15 and 20 grams of which is used in every solar panel manufactured. In fact, for the first time in over a hundred years, silver fabrication demand in photography has been outpaced by this new-ish, burgeoning technology.
Once a pie-in-the-sky idea, solar has finally emerged as a viable, near-mainstream source of energy that will increasingly play a crucial role in powering residences, businesses and factories. Some of the nation’s largest companies, including Walmart, Apple and Ford, already depend heavily on solar to power many of their facilities.
And with solar installation prices falling all the time—year-over-year, they’ve declined around 9 percent—more and more businesses and homeowners will join them, which should support silver demand.
Good Times, Bad Times
As I write in my whitepaper, “Managing Expectations”:
A keen awareness of the ebbs and flows of historical and socioeconomic conditions, on both the macro and micro scales, allows our investment management strategy to be more proactive than reactive.
Everything operates in cycles, including the weather, gold seasonal trends, four-year election terms and more. The domestic and global markets are no different. Commodities might be down this year, but as recently as 2009 and 2010, they were the best-performing asset class.
According to our Periodic Table of Commodities Returns, a perennial favorite among Frank Talk and Investor Alert readers, oil was the second-best performer just last year, returning 7.19 percent, while gold had its worst year since 1981. Such is the nature of investing. Every asset class, as I often say, has its own DNA of volatility.

Speaking of the Periodic Table, we will be sharing the eagerly-awaited commodities returns for 2014 early next year. Subscribers to our Investor Alert will be first to see them, so be sure to subscribe if you haven’t already done so.
I wish you all a safe and prosperous 2015! A perfect New Year’s Resolution is to supplement your retirement income with investment-grade municipal bonds, which you can accomplish through our Near-Term Tax Free Fund (NEARX). Read my latest story, “A Little Pillow Talk Turned Her Husband on to Bonds,” to learn more!
Past performance does not guarantee future results.
********
Please consider carefully a fund’s investment objectives, risks, charges and expenses. For this and other important information, obtain a fund prospectus by visiting www.usfunds.com or by calling 1-800-US-FUNDS (1-800-873-8637). Read it carefully before investing. Distributed by U.S. Global Brokerage, Inc.
Gold, precious metals, and precious minerals funds may be susceptible to adverse economic, political or regulatory developments due to concentrating in a single theme. The prices of gold, precious metals, and precious minerals are subject to substantial price fluctuations over short periods of time and may be affected by unpredicted international monetary and political policies. We suggest investing no more than 5% to 10% of your portfolio in these sectors.
Though the Near-Term Tax Free Fund seeks minimal fluctuations in share price, it is subject to the risk that the credit quality of a portfolio holding could decline, as well as risk related to changes in the economic conditions of a state, region or issuer. These risks could cause the fund’s share price to decline. Tax-exempt income is federal income tax free. A portion of this income may be subject to state and local taxes and at times the alternative minimum tax. The Near-Term Tax Free Fund may invest up to 20% of its assets in securities that pay taxable interest. Income or fund distributions attributable to capital gains are usually subject to both state and federal income taxes. Bond funds are subject to interest-rate risk; their value declines as interest rates rise.
Foreign and emerging market investing involves special risks such as currency fluctuation and less public disclosure, as well as economic and political risk. Because the Global Resources Fund concentrates its investments in specific industries, the fund may be subject to greater risks and fluctuations than a portfolio representing a broader range of industries.
The S&P Stock Market Composite is a combination of major market indices used to gauge overall equity performance dating back to the earliest days of the market.
The S&P 500 Energy Index is a capitalization-weighted index that tracks the companies in the energy sector as a subset of the S&P 500.
The S&P 500 Materials Index is a capitalization-weighted index that tracks the companies in the material sector as a subset of the S&P 500.
The NYSE Arca Gold BUGS (Basket of Unhedged Gold Stocks) Index (HUI) is a modified equal dollar weighted index of companies involved in gold mining. The HUI Index was designed to provide significant exposure to near term movements in gold prices by including companies that do not hedge their gold production beyond 1.5 years.
Standard deviation is a measure of the dispersion of a set of data from its mean. The more spread apart the data, the higher the deviation. Standard deviation is also known as historical volatility.
The Purchasing Manager’s Index is an indicator of the economic health of the manufacturing sector. The PMI index is based on five major indicators: new orders, inventory levels, production, supplier deliveries and the employment environment.
Fund portfolios are actively managed, and holdings may change daily. Holdings are reported as of the most recent quarter-end. Holdings in the Gold and Precious Metals Fund, World and Precious Minerals Fund, Global Resources Fund and Near-Term Tax Free Fund as a percentage of net assets as of 9/30/2014: Apple 0.00%; Ford 0.00%; Franco-Nevada Corp. 6.44% in Gold and Precious Metals Fund, 1.16% in World Precious Minerals Fund; Lucara Diamond Corp. 1.07% in Gold and Precious Metals Fund, 1.58% in World Precious Minerals Fund; Royal Gold 3.44% in Gold and Precious Metals Fund, 1.01% in World Precious Minerals Fund; SunPower 0.00%; Tiffany & Co. 0.44% in Gold and Precious Metals Fund; WalMart 0.00%.
All opinions expressed and data provided are subject to change without notice. Some of these opinions may not be appropriate to every investor. By clicking the link(s) above, you will be directed to a third-party website(s). U.S. Global Investors does not endorse all information supplied by this/these website(s) and is not responsible for its/their content.
 Frank Holmes is the CEO and Chief Investment Officer of U.S. Global Investors. Mr. Holmes purchased a controlling interest in U.S. Global Investors in 1989 and became the firm’s chief investment officer in 1999. Under his guidance, the company’s funds have received numerous awards and honors including more than two dozen Lipper Fund Awards and certificates. In 2006, Mr. Holmes was selected mining fund manager of the year by the Mining Journal. He is also the co-author of “The Goldwatcher: Demystifying Gold Investing.” Mr. Holmes is engaged in a number of international philanthropies. He is a member of the President’s Circle and on the investment committee of the International Crisis Group, which works to resolve conflict around the world. He is also an advisor to the William J. Clinton Foundation on sustainable development in countries with resource-based economies. Mr. Holmes is a native of Toronto and is a graduate of the University of Western Ontario with a bachelor’s degree in economics. He is a former president and chairman of the Toronto Society of the Investment Dealers Association. Mr. Holmes is a much-sought-after keynote speaker at national and international investment conferences. He is also a regular commentator on the financial television networks CNBC, Bloomberg and Fox Business, and has been profiled by Fortune, Barron’s, The Financial Times and other publications. Visit the U.S. Global Investors website at http://www.usfunds.com. You can contact Frank at: [email protected].


