Is The Extreme High In The Gold/Silver Ratio Setting Up For An Extreme Reversal?
There are a few times in an investor’s life where, as Jim Rogers once put it, you see a pile of money sitting in a corner and you can go pick it up. In other words, an investment opportunity that’s not just obvious, but has a high reward-to-risk ratio.
It may not have been expected by many investors, but the gold/silver ratio (gold price divided by the silver price) has stretched to never-before-seen levels. It’s soared to not just a generational high, but a historic high. As in 5,000 years of history.
Does this extreme reading suggest there is a pile of money sitting in a corner that we can go pick up? At a minimum it suggests a highly compelling investment opportunity.
Let’s take a look at the ratio and see what message it might be sending…
Three Centuries of the Gold/Silver Ratio
To put the current gold/silver ratio into perspective, it’s useful to look at its long-term history. That can tell us where we sit today.
In various periods throughout history gold and silver prices have been fixed. Sometimes one or the other, sometimes both, occasionally neither. But this picture of the past 333 years puts a glaring spotlight on the extreme ratio we have today.
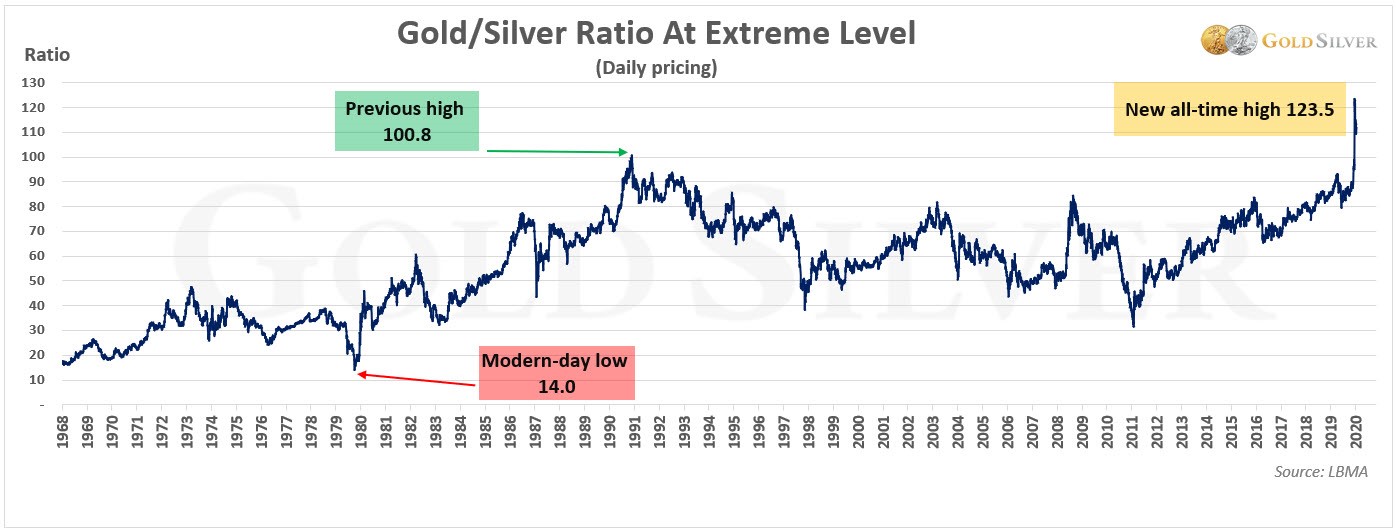
In all of recorded history, the gold/silver ratio has never registered a reading this high. The recent high of 123.5 was recorded on March 17, but it still remains highly elevated in historical context.
Let’s zoom in on the past few decades for a closer look. The following chart shows the modern day high and low, along with the current reading.
The prior record high was 100.8 in 1991. The new high is now 22.5% above that all-time high. In contrast, you can see that in 1980 it bottomed at 14.
The gold price has climbed in response to Covid-19 headlines, while silver has not. Gold ended the first quarter of 2020 up 5.6%, while silver fell 22.8%. In fact, it was silver’s worst quarter since 2013.
Perhaps this is not surprising: investors rushed to gold as fears of the black swan event spread, but since that event was deflationary they didn’t turn to silver. As much as 88% of silver is used in non-monetary applications—jewelry, industrial, silverware, religious objects, etc., implying demand would fall for those items in an economic pullback.
It may take inflation to reverse silver’s lagging performance and begin to outperform gold (and thus push the ratio down), or perhaps some other monetary event, but what we do know is that if the ratio did not reverse it would be the first time in history.
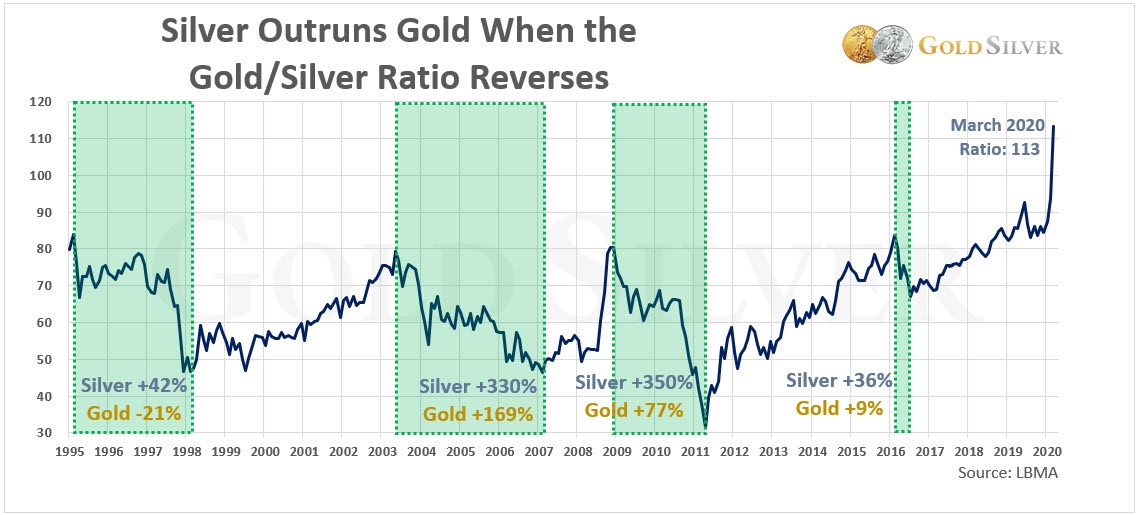
What might silver’s gains look like? Here’s an analysis of some of those prior reversals…
What a Declining Ratio Means for Silver Performance
You notice from the above charts that there are plenty of times where the gold/silver ratio soars and plenty of times where it drops. When it falls, silver is outperforming gold—that can be because it’s falling less than the gold price is falling, but it’s usually because it’s climbing more than gold.
Check out silver’s gains over gold in the four most recent declines in the ratio.
Silver outperformed gold anywhere from one to over four times. And that was with the ratio falling from 80 to 40 or 30. With the ratio now over 110, history suggests a snapback rally could be enormous, meaning silver’s outperformance of gold could easily be measured in hundreds of percent.
- The gold/silver ratio may not be done climbing, but the value offered by silver, relative to gold, is hard to overstate.
History suggests that the extreme levels in the gold/silver ratio won’t last. And that the reversal, whenever it comes, could be breathtaking.
So, to answer our earlier question… Yes, you might even say that buying silver at this juncture is akin to seeing a pile of money sitting in the corner and walking over to pick it up.
*********


