A Follow Up on Our Gold Trades


Judging from the emails I receive from the public, there are more traders than I expect who pay attention to my commentaries, and therefore, I feel somewhat obligated to provide ongoing guidance, and our course of action. A reader emailed me this week, asking if I still have the same outlook according to my analysis in one of my commentaries published in July. Folks, the markets are dynamic and subject to constant change. Technical analysis as Carl Swenlin puts it, is a winsock and not a crystal ball. If you are keen on following my work, please remember that we trade our signals and set ups, not our analysis. Technical analysis is nothing more than an educated guess, and is often wrong. Trading requires a signal, which is based on a certain technical parameter, and a set up, which is based on risk and money management. We only enter or exit the markets based on our signals and set ups, and not our analysis.
Our last week's trades are perfect example of what we do and how we do it.
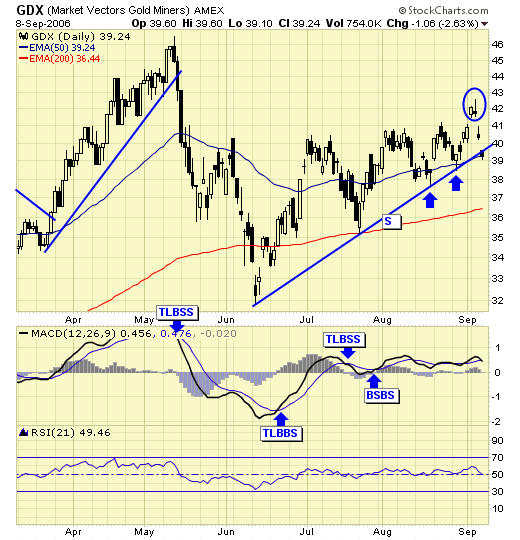
GDX - we bought GDX at $39.35, in anticipation of the breakout. We did have a breakout, but was quickly reversed on a gap down. We took partial profits at $40.30, and got stopped out on the remaining positions with a stop at breakeven. Trendline support is violated and we took a small profit and went back to cash.
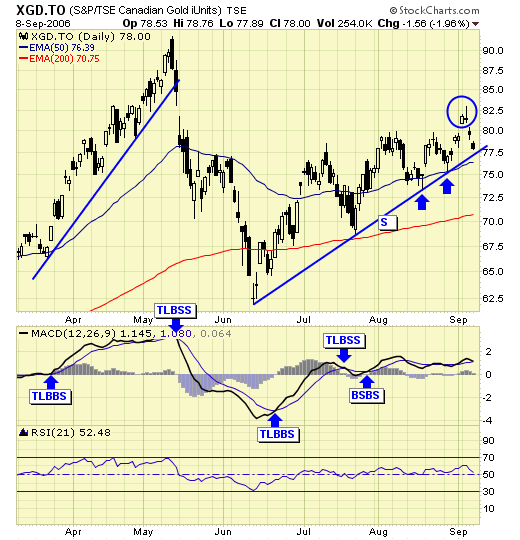
XGD.TO - Canadian traders bought XGD at $77, and we took partial profit quickly when the breakout failed to follow thru, at $79.56. We placed a sell stop at breakeven on remaining positions and are still in the trade. We will exit on a trendline break unless we get stopped out first.
A flash back
The current situation in the gold sector is very similar to the events during April 2004 and should be watched closely. The most dangerous time in trading is when a breakout fails to follow thru, thus resulting in a sharp breakdown. Is this one of those times? You make the call.
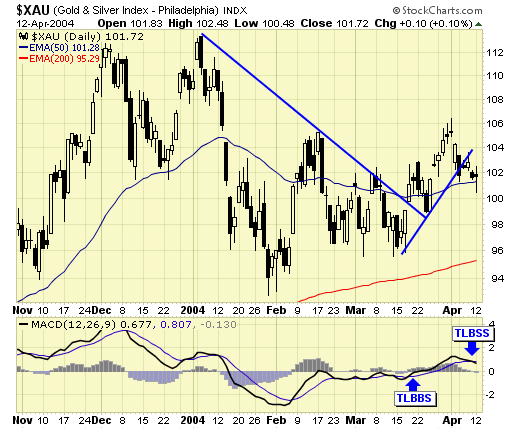
2003 was a very profitable year for us, and the quick sell off in early 2004 has corrected much of the excess bullishness. We had a buy signal in mid March and a breakout by April. Everything was looking real good but on 4/12, our model gave us a sell signal. General consensus was very bullish, with 2003 still fresh on everyone's mind.
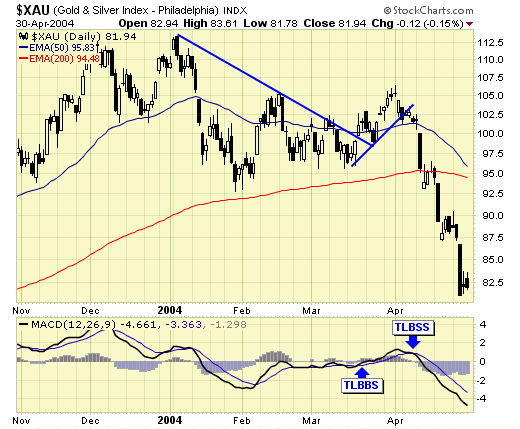
And the free fall began shortly after our sell signal. Will history repeat?
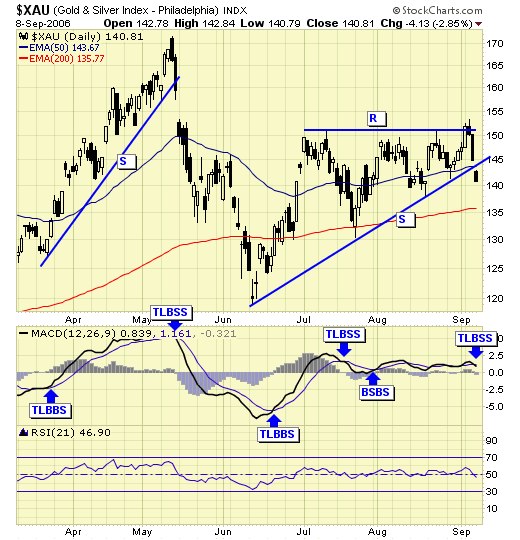
This is the current $XAU chart. We also had a quick sell off after the awesome rally ended in May. Appeared to be a breakout early this week, but quickly reversed down and we have a sell signal by Friday. Price action is the best indicator and current price action deserves some respect.
Summary
Will this sell signal result in another free fall? Who knows. The prudent thing to do is to exit the markets on a sell signal, and re-enter when we have a buy signal and set up. Holding and hoping is not an alternative.
********

Jack Chan is the editor of Simply Profits, established in 2006. Chan bought his first mining stock, Hoko Exploration, in 1979, and has been active in the markets for the past 37 years. Technical analysis has helped him filter out the noise and focus on the when, and leave the why to the fundamental analysts. His proprietary trading models have enabled him to identify the NASDAQ top in 2000, the new gold bull market in 2001, the stock market top in 2007, and the US dollar bottom in 2011.


