Forecast: Gold Confirms Key Cycle Turn


 Recapping The Action
Last week's trading saw Gold forming its low in Tuesday's session, here doing so with the tag of the 1803.40 figure. From there, strength was seen into later in the week, with the metal pushing all the way up to a Friday high of 1836.90. For the five-day period, Gold ended higher by 38 points overall - a decent net gain from the prior weekly close.
Gold, Short-Term
As mentioned last weekend, the 10-day cycle was back in topping range, and with that was looking for another short-term retracement. Here again is that 10-day wave:
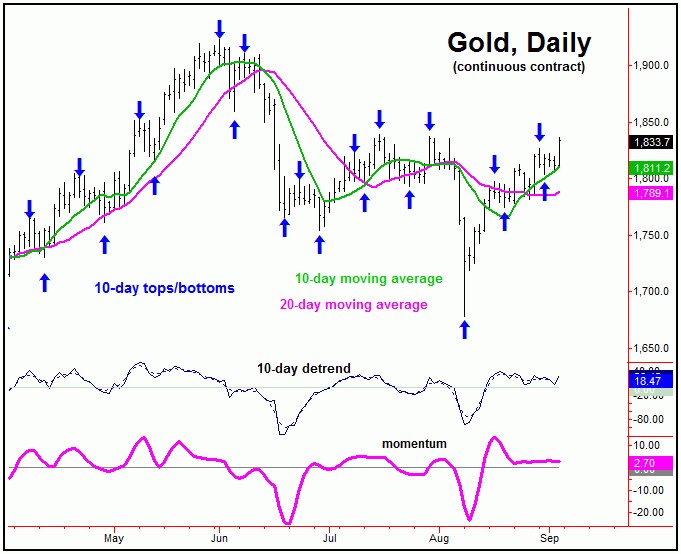
From last weekend: "our 10-day cycle is now 6 trading days along, and with that is looking for another short-term top in the coming days. From that peak, the metal is likely to see another retracement back to the 10-day moving average, before giving way to higher highs for the swing on the next upward phase of this wave."
The peak for the 10-day wave was made with Monday's tag of the 1826.50 figure. From there, our call was for a drop back to the 10-day moving average, which is a normal expectation for the downward phase of this component. This was seen in the days that followed, with that decline ending up as more of a sideways-to-down affair.
With the above said and noted, the current upward phase of this 10-day cycle is only 3 trading days along, with the probabilities favoring a right-translated peak - one made on or past the 5 trading day mark. From there, another short-term dip will likely be seen, once again taking prices back to our 10-day moving average magnet.
Gold's Stepped-Back View
Stepping back, as mentioned in prior articles, more key was whether the metal would confirm something bigger to be in force.
From last weekend: "any daily close above the 1829.40 figure - if seen at any point going forward - would tend to favor a 'momentum' upturn with the 72-day cycle. In turn, that action would favor additional strength on up to the 1860-1880 region - though the move would be favored to end up as a countertrend affair (i.e., holds below the June peak), due to the position of a larger 154-day cycle that we track."
As noted last weekend, the probabilities favored a countertrend dip with the 10-day wave, one that would be followed by higher highs on the next upward phase of the same - which we have now seen met with Friday's action.
More key, however, is the fact that Gold finally registered a daily close above our key level of 1829.40 (December, 2021 contract). This action triggers a 'momentum reversal' to the upside with the larger 72-day wave, which is shown on the chart below:
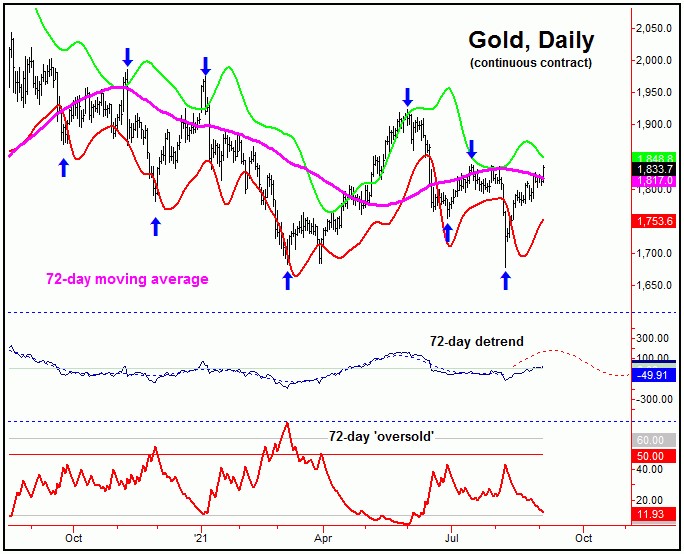
In terms of price, the daily close above the 1829.40 figure is our best indication of a turn higher with the momentum portion of our 72-day wave. With that, the ideal path is looking for additional strength in the days/weeks ahead, before the next key peak attempts to form - and coming from this same 72-day cycle.
Stepping back further, until proven otherwise, our larger 154-day cycle is last seen as having topped back in early-June. With that, the ideal path is looking for the current rally phase of this 72-day component to end up as an eventual countertrend affair.
Of key note is that our 72-day 'oversold' indicator in red is moving towards its lower reference range - something seen closer to tops with this cycle (this indicator moves inverse to price action). Even said, the odds should favor additional strength in the days ahead, before this wave next peaks.
For the bigger picture, with the action seen in recent weeks, there is a discrepancy in regards to the larger 310-day wave, which is shown on the chart below:
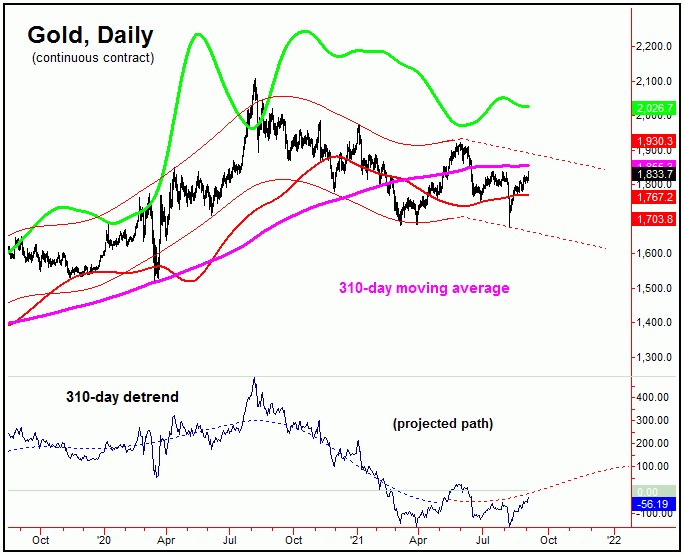
That is, the recent break below the March bottom would favor the June peak as a contracted high for this wave, with its downward phase currently in force off the same. Having said that, the break of the March lows came in overnight trading - apparently with a large hedge fund unwinding a big position.
Adding to the notes above, if we look at the daily chart of the GLD - the Gold-tracking ETF - a drop below the March bottom was not in fact seen. Here is that chart:
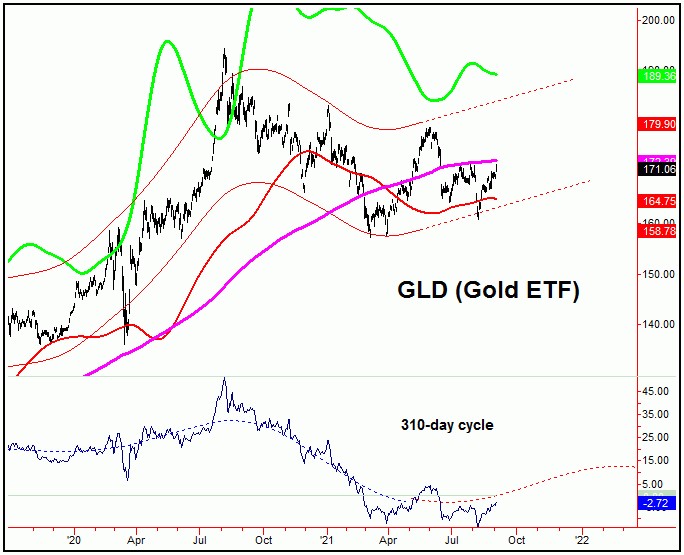
With the above said and noted, the detrend that tracks this 310-day wave on the GLD is still showing the March bottom as the last low for this component, and with that projecting higher prices for the coming months. Thus, we have a discrepancy between the price of Gold, and what the GLD is suggesting.
The overall feeling is that the truth with the above may lie somewhere in the middle, and we won't likely have a better idea until we get into the October or November timeframe - as the next trough with the 72-day cycle forms. More on this as we continue to move forward.
Jim Curry
The Gold Wave Trader
http://goldwavetrader.com/
http://cyclewave.homestead.com/
********


