Forecast: Gold & US Stocks


 With the action seen over the past week, Gold has continued to push to higher highs for the swing, with the metal running up to an early-Friday high of 4392.00 (December, 2025 contract) - before backing off the same into the weekly close. Short-term, the metal is positioned for what should be a countertrend correction.
Gold's 10-Day Cycle (Topping)
For the very short-term, we can take a look again at our smallest-tracked wave, the 10-day cycle in Gold:
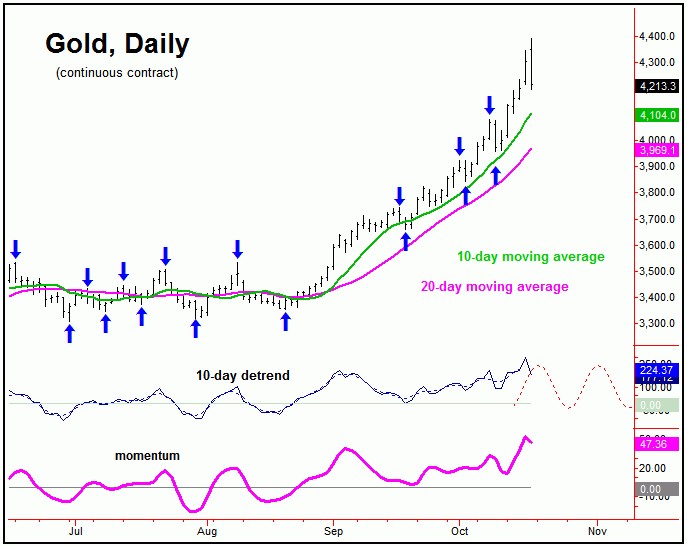
This 10-day cycle is on the lookout for a correction in the coming days, with any reversal below the 4190.80 figure (December, 2025 contract) being the trigger for the same. In terms of price, taking out that number would put the 10-day moving average as a potential magnet, though more recent corrections with this cycle have managed to hold slightly above the same.
Until proven otherwise, the next correction phase of this 10-day wave could end up as another countertrend affair, due to the position of our larger 72-day cycle, which is the most dominant cycle in the Gold market. Having said that, there is some potential this bigger wave has seen its high - though this can't yet be confirmed.
Here again is that 72-day cycle in Gold:
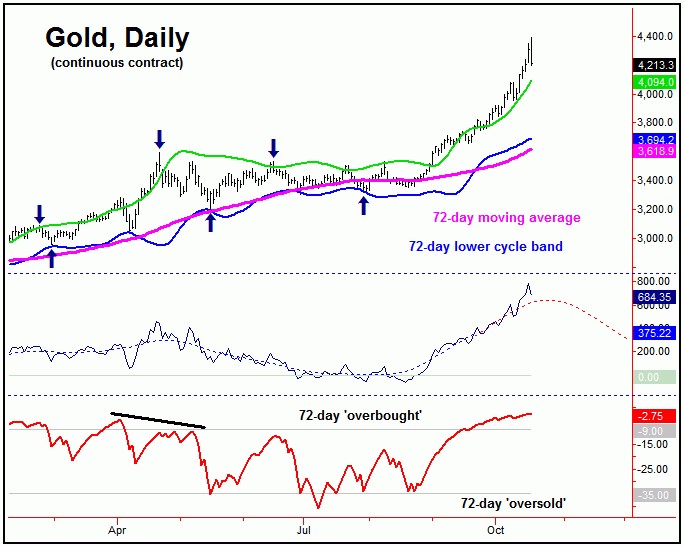
Back in early-September, the upward phase of this 72-day wave (chart, above) was deemed to be back in force, having confirmed an earlier-than-forecast bottom, made back in late-July to early-August.
In terms of time, the upward phase of this 72-day cycle was then projected higher into this late-October timeframe, with each of the short-term pullbacks having been expected to end up as countertrend.
Having said the above, at some point this 72-day wave will top - and turn south - and will give way to a sharp correction, with most of the decline phases with this wave making a hard attempt at the lower 72-day cycle band before bottoming.
With Friday's action, as mentioned earlier there is at least some potential for this 72-day cycle to have topped, though this can't yet be confirmed. We should get a new downside 'reversal point' for this wave soon, which will be posted in our thrice-weekly Gold Wave Trader market report.
Stepping back further, the next trough for the aforementioned 72-day wave is projected for the late-November timeframe, but with a large plus or minus variance, a move which is assumed to be countertrend - against the upward phase of the bigger four-year wave. If correct, a push back to higher highs would be expected on the next 72-day cycle upward phase, ideally lasting into February of next year, or later.
Technical Considerations
With the position of our 72-day cycle, we should look at a key momentum indicator that we track, the Gold Timing Index - and which is shown on the chart below:
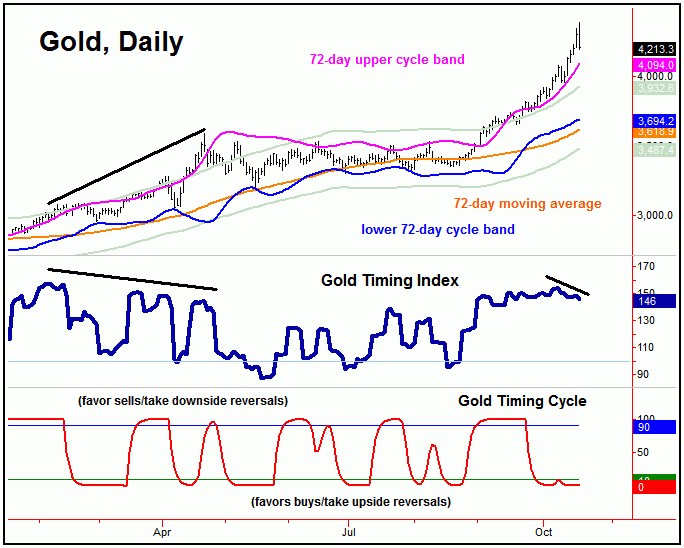
As mentioned last weekend, at 72-day (or greater) cycle tops, the Gold Timing Index tends to diverge from price action - which it had yet to do - thus favoring additional strength into last week, which we did see.
Having said the above, as the push to higher highs was being seen, the Gold Timing Index has started to diverge from price, the first such divergence in a good while. This action is viewed as a technical negative, and supports the idea of peak forming with this wave, if not already in place.
Lastly this weekend, our Gold Timing/Cycle indicator dropped below its lower reference line back in late-September (i.e., 3855, December contract), a bullish signal - which was supportive of strength. The prior drop below its lower reference line was seen back in early-August, which was also supportive of a sharp rally - which we did see.
With the action into last week, the Gold Timing/Cycle indicator actually remains below its lower line, seen as a mild net positive - but against the backdrop of a divergence in our Timing Index, more of a technical negative.
U.S. Stock Market Update
The last time we looked at the U.S. stock market was back in July of this year. As noted all the way back in June of this year, a major low had formed on the S&P 500 Index (i.e., the 'SPX'), registered in early-April - near where it was projected to form:
From my 7/15/25 article: "mentioned back in June, the combination of these (180/360-day) waves were seen as pushing higher, with the bigger 360-day component ideally moving up into early next year. In terms of price, the average rallies with this 360-day cycle have been some 40% from trough- to-peak, which suggests the potential for a push up to the 6800 SPX CASH figure (or higher) before this wave tops."
With the action seen in past months, the SPX has nearly met the average rally suggested by the 360-day cycle, which is shown on the chart below:
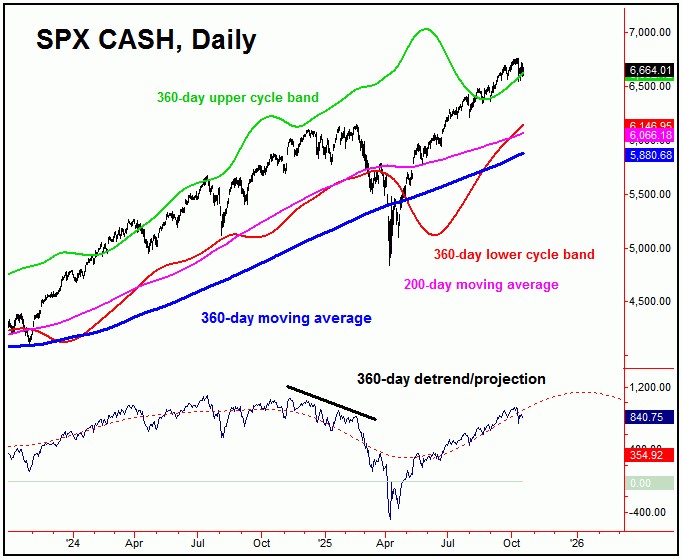
The next larger-degree peak in U.S. stocks should come from this 360-day time cycle. In terms of price, we have since upgraded our targets for the SPX, with the potential to reach up to the 7300-7500 region, before topping the market for what is anticipated to be a bigger percentage (17-30%) correction into the Autumn of next year, plus or minus.
For the longer-term view, a correction with the 360-day wave into the Autumn of next year - if seen as outlined - should give way to a major rally, expected to be 100% or more off of whatever low that forms into that window. That rally should be a multi-year advance, taking the SPX up to a larger 18-year top, ideally made around the year 2029.
U.S. Stocks, Near-Term
For the near-term view, several corrections should play out in-between now and when our 360-day wave tops, with the most current coming from the combination of our 45-day time cycle, as well as the seasonal patterns. That decline is favored to end up as an eventual countertrend affair, before turning back to higher highs on the next swing up.
Here is that 45-day cycle on the SPX:
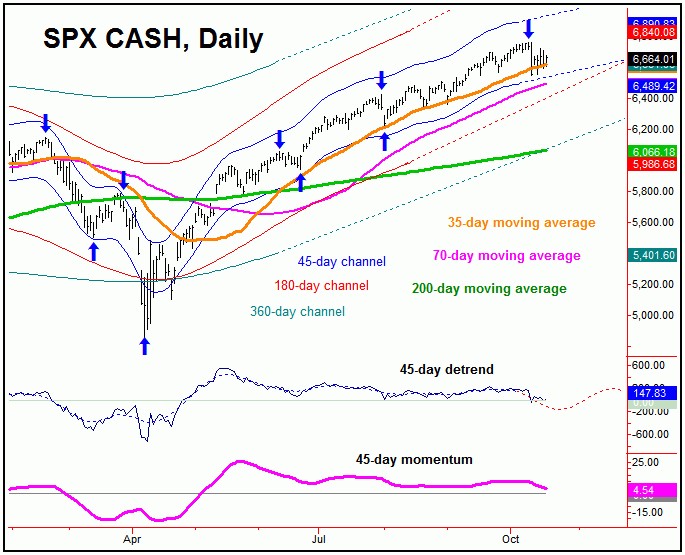
The last peak for this 45-day cycle in U.S. stocks was the 6764.58 swing top, registered on October 9th. Its next trough is due anytime between now and late-October.
As mentioned, the correction with our 45-day wave is expected to end up as countertrend. If correct, what follows should be another sharp rally, taking the SPX up to a potential test of the 7300-7500 region into early next Spring, before setting up our next mid-term peak, coming from the bigger 360-day cycle.
Technical Action
In terms of market breadth, the NYSE advance/decline line confirmed each of the rallies seen through the mid-September window - which was viewed as bullish for the SPX, and supported the bigger uptrend with price:
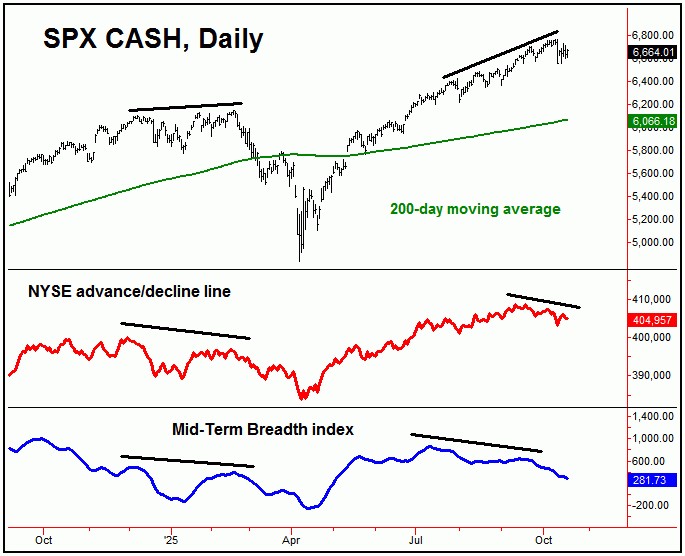
Having said that, the advance/decline line began to diverge from price action around mid- September, which was viewed as a technical negative - and with that supported a correction playing out with our 45-day wave.
Adding to the notes above, our Mid-Term Breadth index (in blue) was also supportive of a correction, with this indicator starting to diverge all the way back in August. With that, until proven otherwise, the correction phase of our 45-day cycle is still deemed to be in force, and with that the potential for additional weakness before bottoming.
Market Sentiment
Lastly this weekend, our stock market sentiment index (chart, next page) currently is on a mid-term buy signal, with this signal coming all the way back on 9/22/23, at the 4320.06 SPX CASH figure, and shown on the chart below:
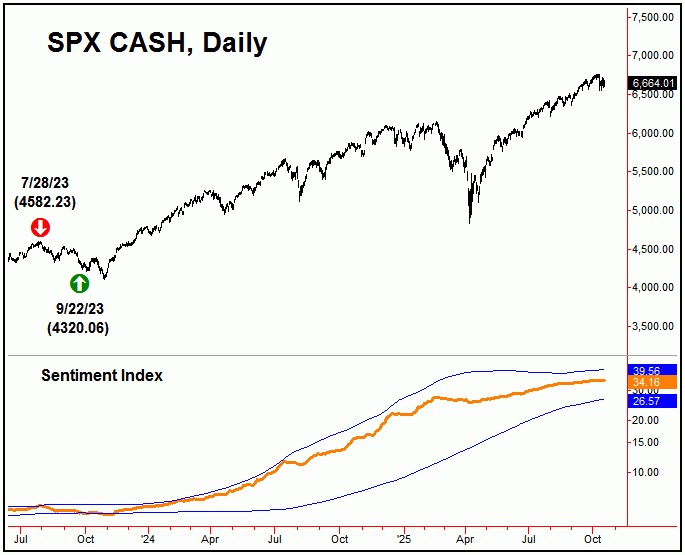
With the action seen into last week, the indicator has actually seen a drop, and with that remains below its upper reference line - thus keeping its current signal in place. It will take a push back above the indicator's upper band, in order for a new sell mid-term signal to be generated.
The Bottom Line
The bottom line for U.S. stocks is that a correction is currently in force, coming from at least the 45-day cycle. In terms of patterns, this correction is favored to end up as a countertrend affair. If correct, what follows should be another 13-14% rally phase, lasting well into the Spring of next year, before forming our next larger-degree peak with the bigger 360-day cycle. Stay tuned.
Jim Curry
The Gold Wave Trader
Market Turns Advisory
http://goldwavetrader.com/
http://cyclewave.homestead.com/
*******


