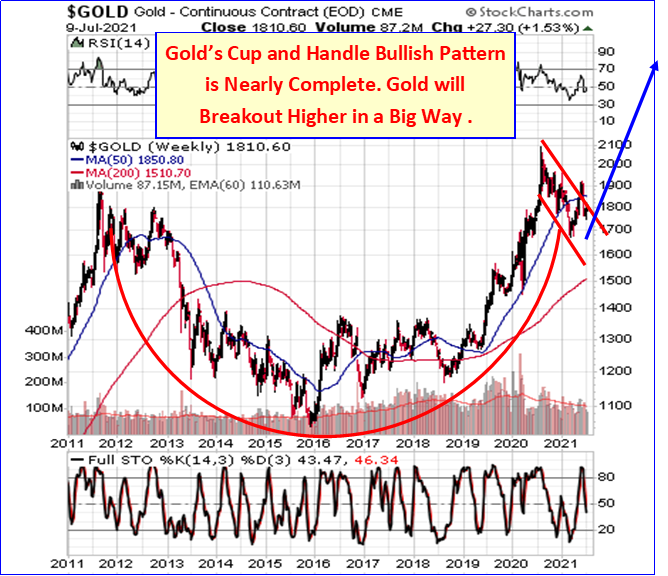
Gold’s Massive, Bullish Cup and Handle Pattern An Update


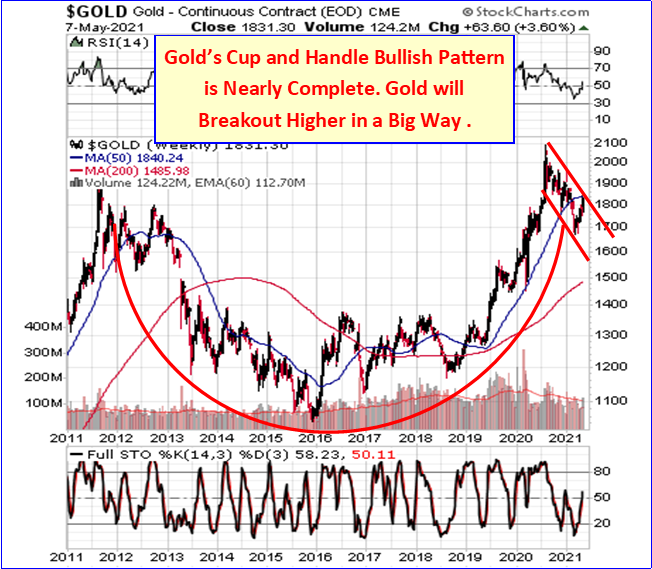
Gold has formed and nearly completed a Massive Cup and Handle Bullish pattern that started at its September 2011 peak and has continued through now, July 11th, 2021. This ten-year pattern is nearly complete. This pattern has a minimum projected upside price target of 3,000. Gold closed Friday, July 11th at 1,811. This pattern is forecasting a nearly 1,200-point, 67 percent, rise from current levels – at least.
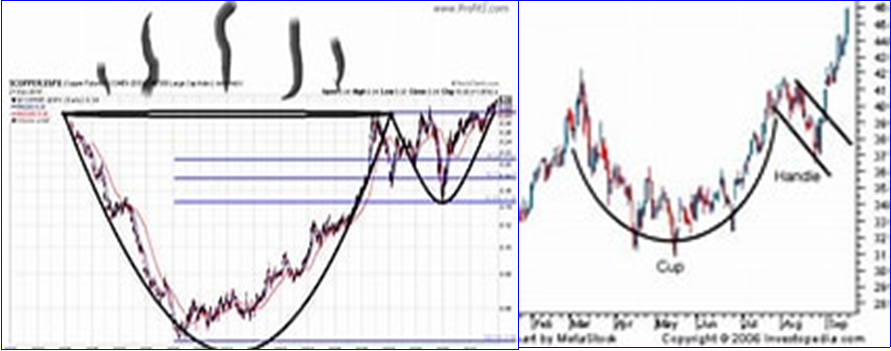
A Cup and Handle chart pattern is where we see a drop in the price after a significant high (such as we saw back on September 2011) followed by a rise back up to the original peak value, which is then followed first by a smaller drop, and then a rise past the previous peak. It is an indication of bullish sentiment in the market and likely further price increases. It is a continuation “pause” pattern in a long-term Bullish trend. Gold started its long-term Bullish trend back in the 1970’s, and temporarily topped on September 6th, 2011 at 1923.70. It then fell into a late 2015 bottom on December 3rd, 2015 at 1,045.40, then rose back to approximate 2011 levels last August 7th, 2020 at 2,089.20.
The unique shape of this pattern, typically, is a rounded bottom like the bottom of a tea cup. But what is important is that this pattern needs a “Handle.” After prices return to their original high (such as occurred in August 2020), once they rise back to that same approximate level, a decline must form that is short in both time duration and depth, relative to the steepest decline into the Cup’s bottom. Once this “Handle” bottoms, prices should break out higher back to the original high. Once prices rise above that original high level, it is off to the races for prices.
Below is an example of this pattern from the Technical Analysis Science of Market Forecasting Textbooks:
Now we can see that Gold may be close to finishing its decade long Massive Bullish Cup and Handle pattern here in July, 2021, as it has nearly completed the final portion of the pattern, the Handle.
Check out this next chart as of Friday, July 11th, 2021:
But does this pattern actually accurately forecast future rising prices for Gold? Well, it sure did back in April 2019. At that time, we saw this same pattern, but at a smaller degree of trend, a Bullish Cup and Handle pattern that we presented to our Subscribers at that time. Based upon this pattern, we forecasted a strong breakout higher for Gold. Here is the chart for that smaller degree Cup and Handle back in April 2019:
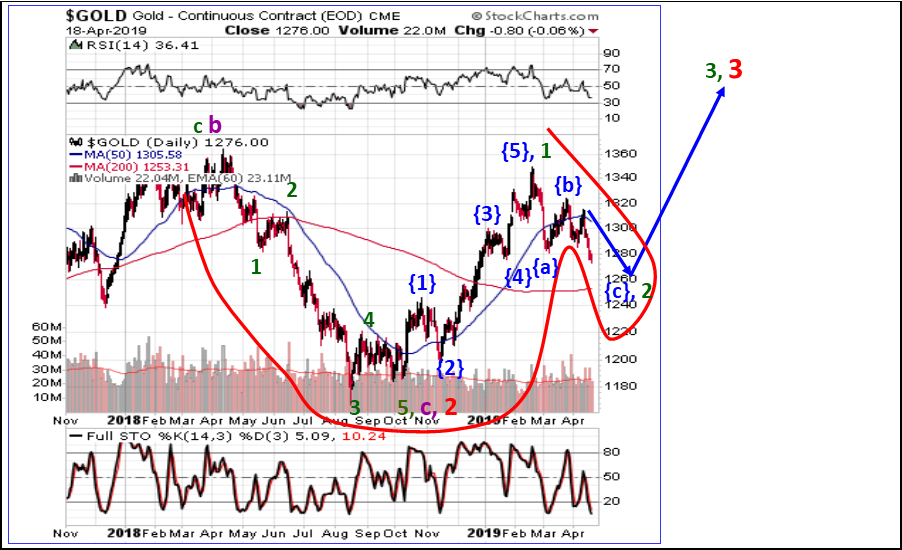
By June 2019, a few months later, Gold had risen out of its Handle and was ready to explode.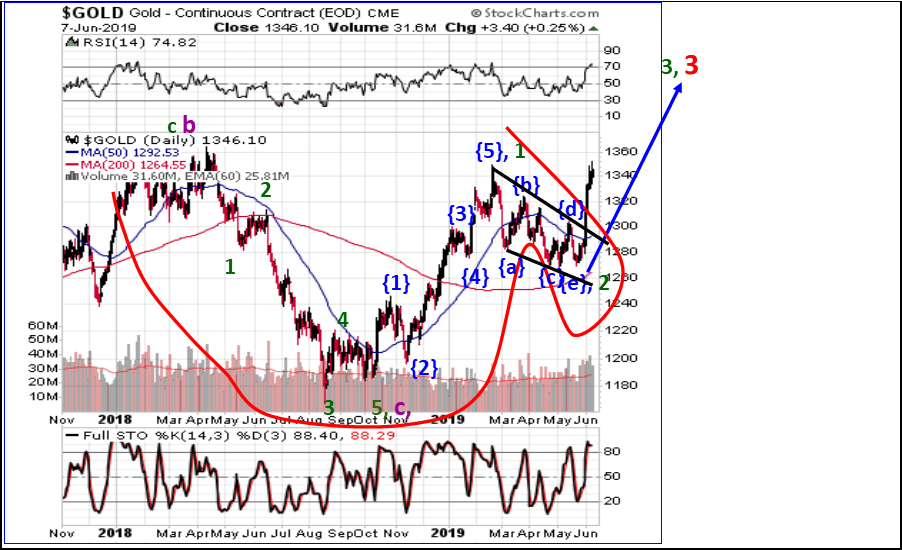
Then, over the next fourteen months from June 2019 to August 2020, Gold rose approximately 800 points, or 64 percent (marked by the blue arrow) until the next larger degree Cup’s Handle started! How is that for forecasting accuracy?
Great news at long last for Gold bugs. Probably not so good for the stock market, hyperinflation, or for world peace and security, as this Gold pattern is warning trouble could be coming.
So when can we expect Gold’s current large degree Handle to complete? These next two charts show Elliott Wave mappings that show where Gold is likely headed over the short run:
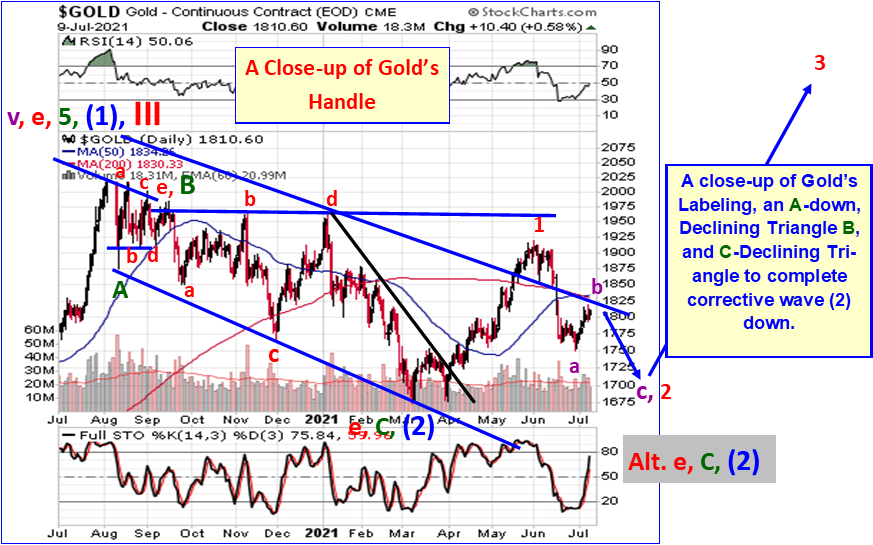
Above we see a close-up for Gold’s Handle portion of its Cup and Handle Bullish pattern from 2011.
Gold looks to have completed wave e-down of C-down of a Declining Triangle pattern, serving as a large portion of the Handle, to finish Primary degree wave (2) down. A powerful rally looks to have started, wave (3) up.
Inside wave (3) up, Gold looks to have completed wave 1-up, and is inside an a-down, b-up, c-down move for Minor degree 2-down.
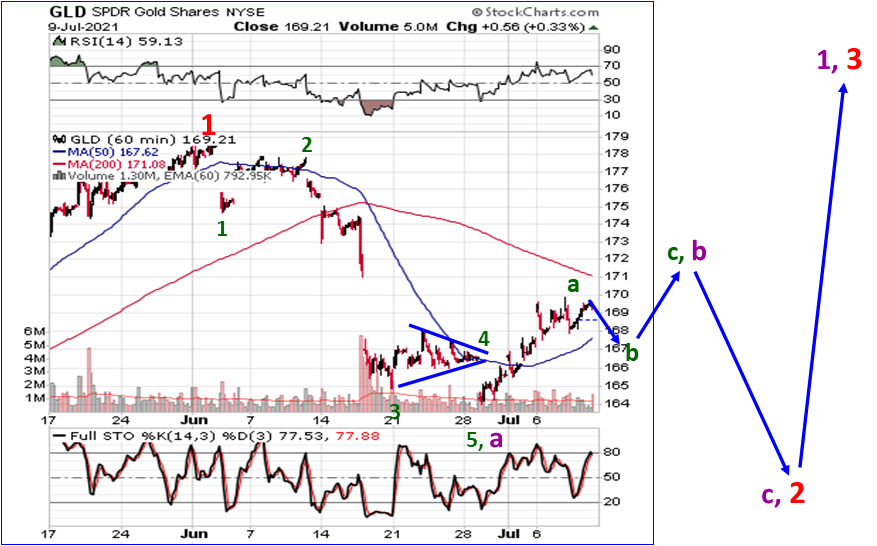
Zoning in closer, we show the very short-run view for Gold in the next chart. This next chart shows that Gold has completed Minor degree wave 1-up in early June 2021, the start of larger degree (3) up, and has since started a corrective wave 2-down. Within wave 2-down, which is an a-down, b-up, c-down zigzag of minuette degree, wave a-down has completed, and b-up is in process.
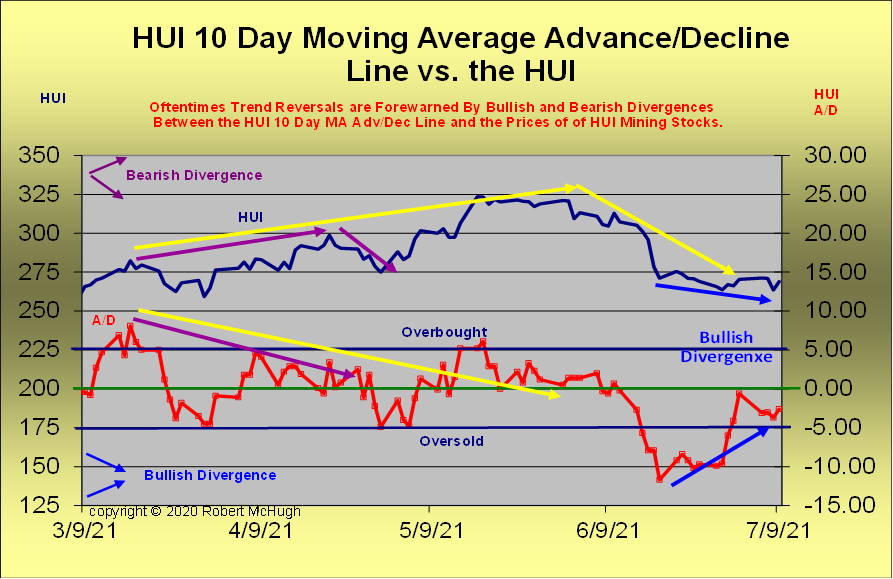
We also use momentum key trend-finder indicators for the HUI Mining stock index, which we show to subscribers in our newsletters. We have found that Gold tends to track these Mining stock Buy / Sell Indicators. One of the charts we like is to look for Bullish or Bearish divergences between the HUI and its 10-day average Advance / Decline Line Indicator. This gives us an early heads up of coming new short-term trends. Next is the latest chart, and it is showing a Bullish divergence is starting. This confirms that Gold’s bottom is approaching and the next strong rising trend is not far off.
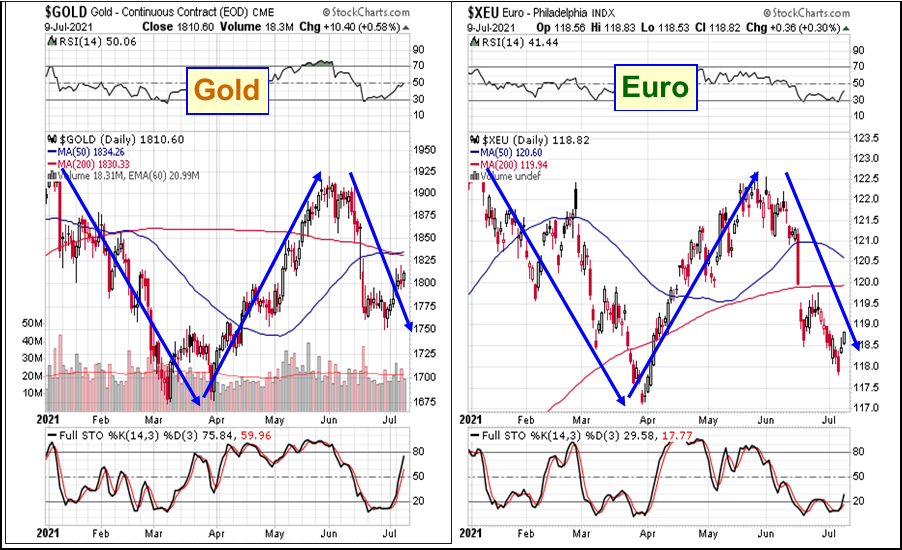
The above two charts show an interesting strong direct correlation in prices, both trends and depth of moves, between Gold and the Euro during 2021.
At Dr. McHugh’s www.technicalindicatorindex.com we track the short-term waves that make up these larger degree trends, and chart them in our forecast newsletters, and have developed several proprietary Buy/Sell indicators that help us identify when the next significant move is starting for the major stock indices, as well as for Gold, Silver and Mining stocks, and in which direction the move will develop. We publish these indicators in every Newsletter to subscribers. We offer education on how to trade markets up or down, based upon these indicators, patterns, and the overbought / oversold conditions that they identify.
********


