Gold – Healthy Pullback Provides New Opportunities


It´s been a tough six weeks of deep corrective price action in the gold market since our last analysis “Gold – Rally is losing momentum” had been published. From its top on February 2nd at 1,959 USD gold sold off 7.91%. Last week saw a first reaction to that sell-off and gold was able to recover from 1,804 to 1,858 USD rather quickly. This week however brought more whipsawing price action after a hawkish Fed followed by softer employment data.
Review
Since reaching an all-time high of 2,075 USD on August 7th, 2020, the price of gold has consolidated for over two years between roughly speaking 1,680 USD and 1,980 USD. Initially, the support zone around 1,680 USD had withstood all bearish attacks, while all attempts to break above 2,000 USD also failed. However, in September 2022, the highly tense situation in financial markets caused a temporary breakthrough to the downside in the price of gold, too. But the dip below 1,680 USD did not lead to any further sharp sell-off. Instead, a triple bottom at 1,615 USD in early November marked the beginning of a sharp recovery wave that propelled gold prices to 1,959 USD in just a few months. The false breakout below 1,680 USD is a strongly bullish signal in the big picture and justifies medium to long-term optimism.
However, following the top at 1,959 USD on February 2nd, a sharp reversal pushed gold prices relentlessly lower throughout February. Only since Tuesday, February 28th, have buyers been back in the majority, and starting from 1,804 USD gold staged a first bounce towards 1,858 USD. However, while Fed chairman Powell testified in front of congress, those gains quickly melted away like ice in the sunshine. Yet, in the meantime it seems that gold bulls are once again trying to push the price higher. If they succeed, this week’s low (1,809 USD) would be slightly higher than last week’s low (1,804 USD). Hence, gold could now be in a 3rd wave up in terms of Elliott wave theory. Such a third wave is the most visually standing out wave and should deliver strong price appreciation.
Gold bull market comparisons
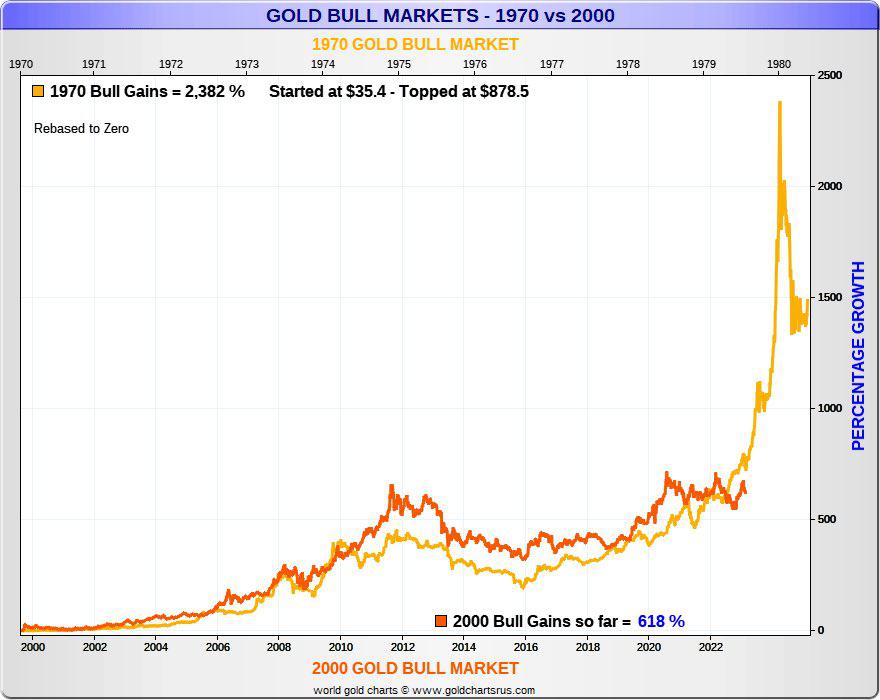
Gold Bull Market Comparisons – 1970’s vs 2000 as of March 1st, 2023. Source: Goldbroker
In that case, the breakout above the resistance zone between 1,950 and 2,050 USD remains the decisive next step for the gold market. Comparing the bull market of the 1970s with the bull market that began in 2001 with the famous “Gordon Brown double bottom” at 250 USD, the decades-long patience of gold bugs could finally be rewarded in the coming years. “Only” a sustainable breakout above 2,075 USD is needed for the energy that has been building up since the August 2011 high at 1,920 USD to be released in a spectacular surge. Even though gold is not there yet, and the fragile situation in financial markets could still delay the breakout, in the big picture, the breakout is only a matter of time.
Chart Analysis – Gold in US-Dollar
Weekly chart: Higher low confirms new uptrend.
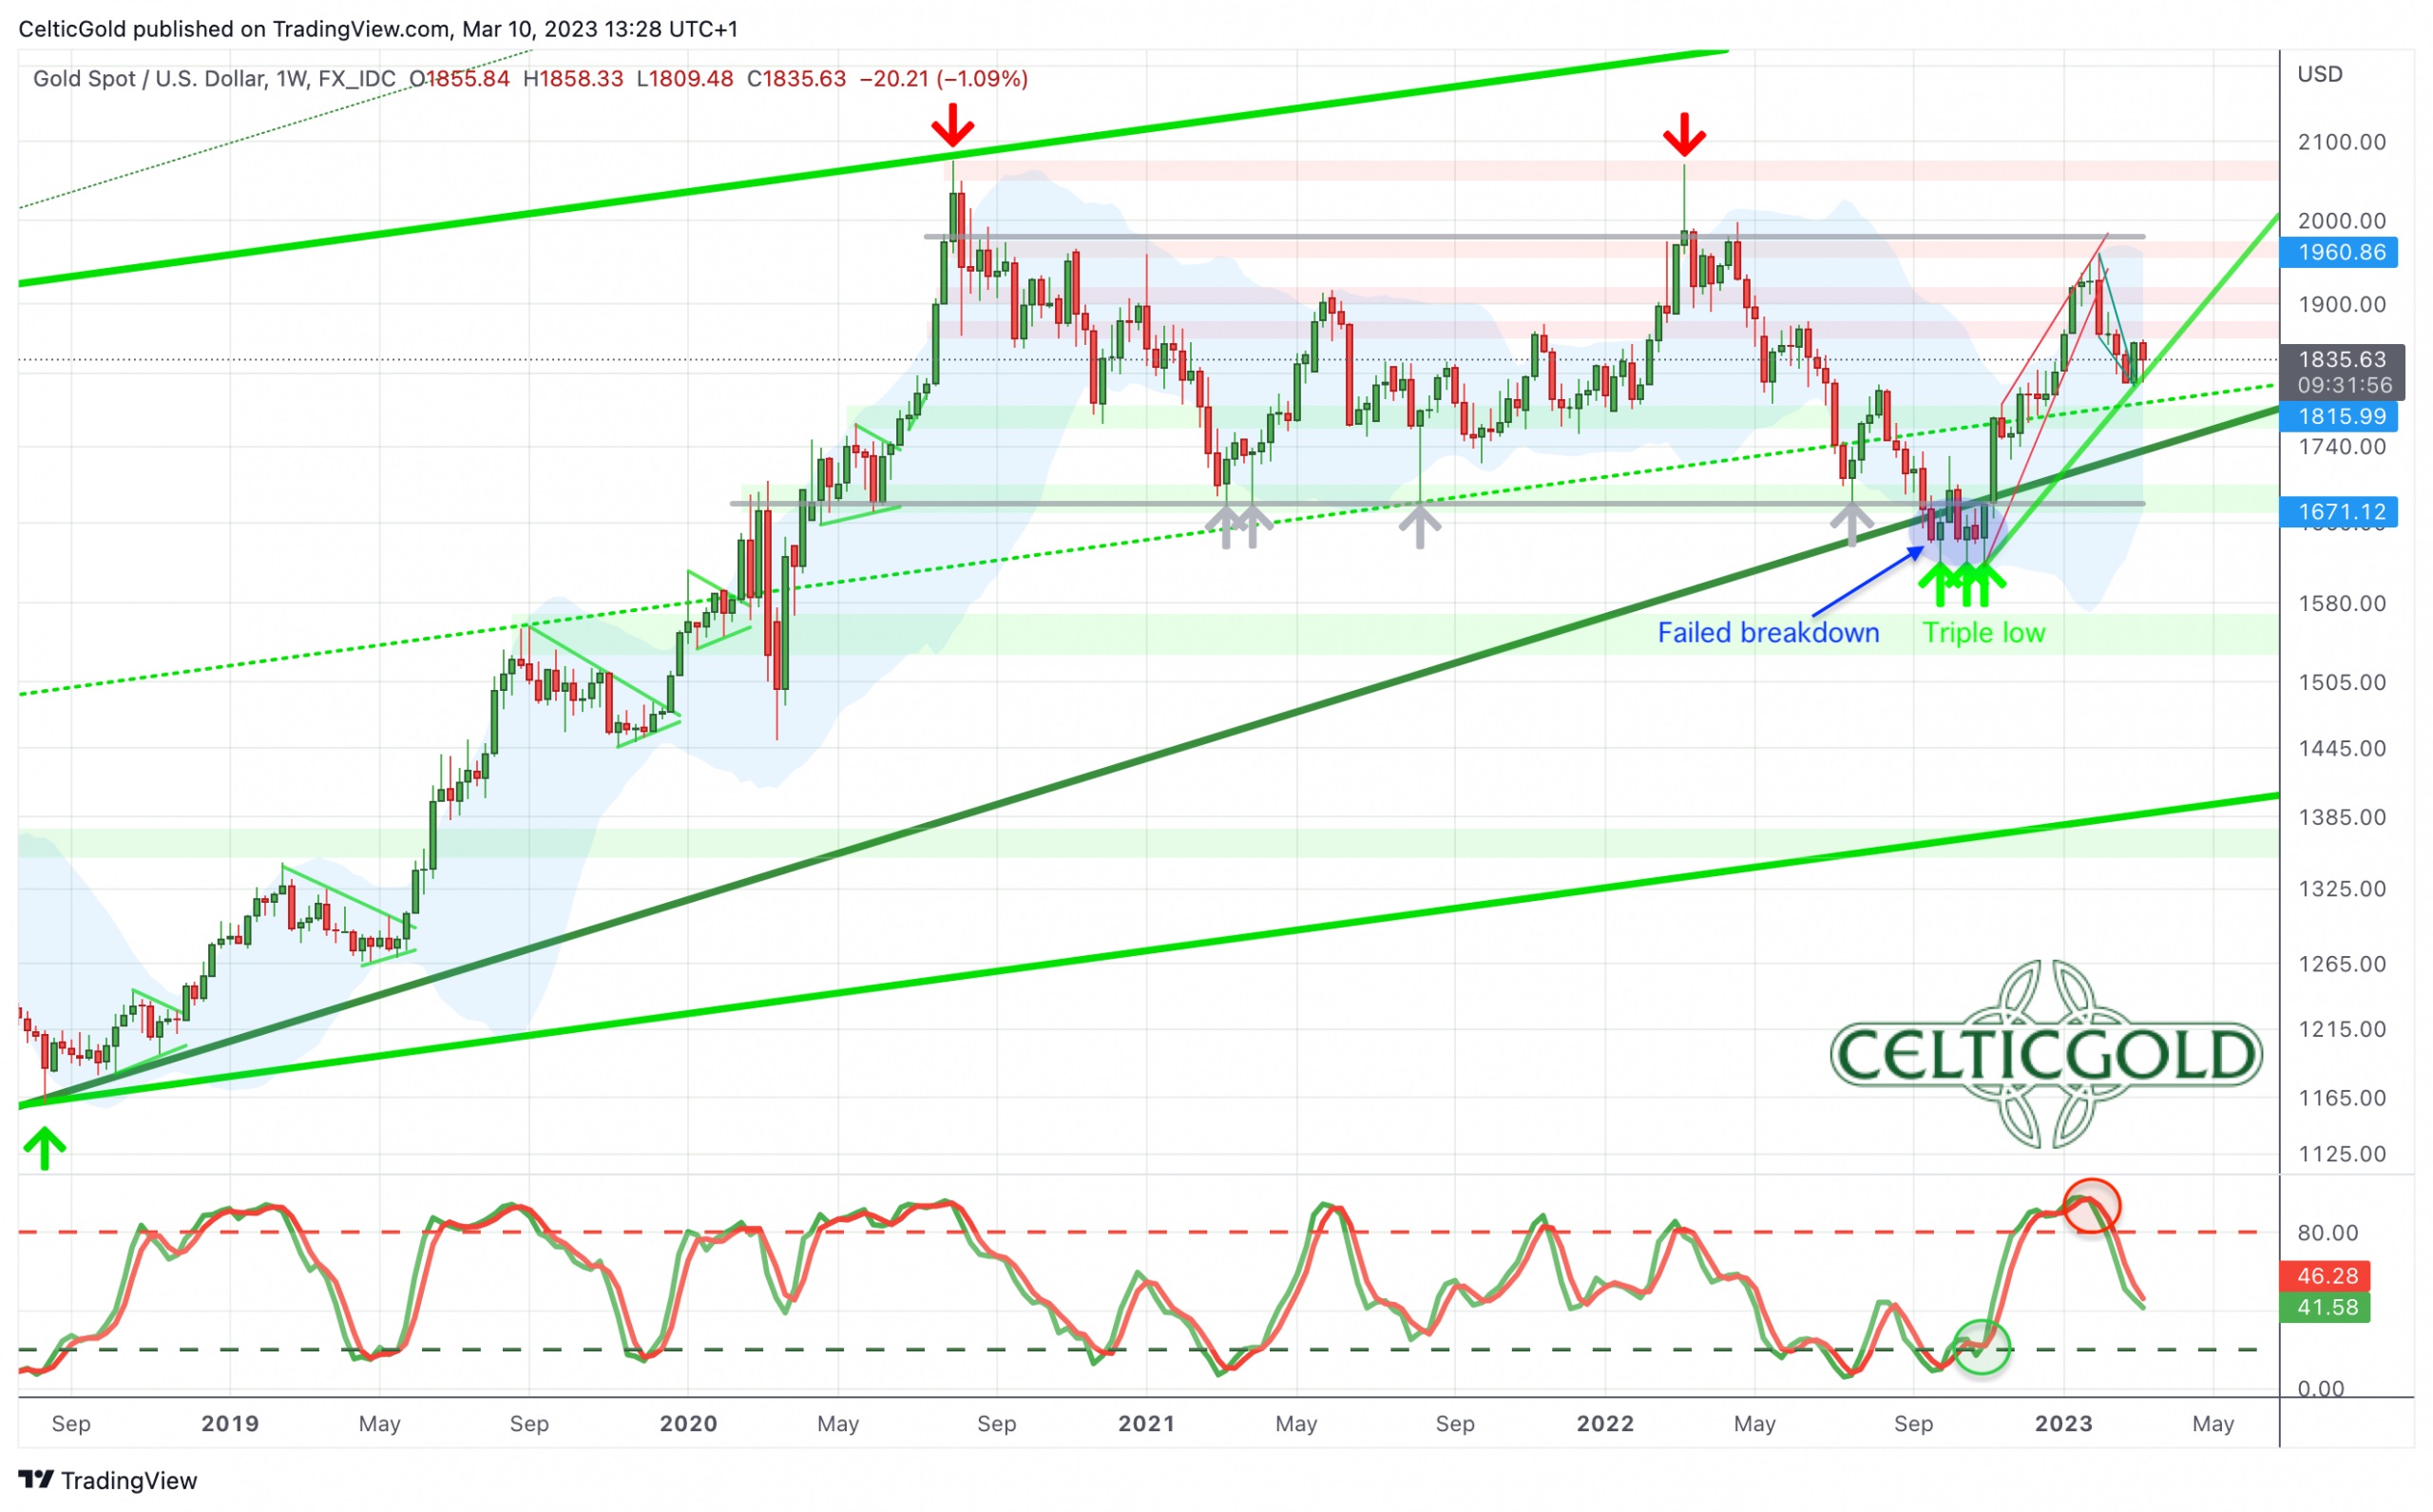
Gold in US-Dollar, weekly chart as of March 10th, 2023. Source: Tradingview.
The false breakout below 1,680 USD, along with the ongoing consolidation over the past two and a half years, represents a strong signal for the gold price. While the correction over the last five weeks has been sharp and relentless, it has also cleared the overbought weekly chart. So far, prices have managed to hold above the middle Bollinger Band (1,807 USD), which could confirm a new uptrend with a higher low compared to the November low.
However, the weekly stochastic still provides an active sell signal. Therefore, a bottoming process could take several weeks and could cause more confusion than clarity. If gold were to break out in the third or fourth quarter of this year, however, prices would have to start moving towards 1,950 USD and above rather soon.
Overall, the weekly chart is still slightly bearish or neutral, but not far from a trend reversal. If more corrective price action should be needed due to renewed stress in financial markets, gold should ideally stay above 1,740 USD and especially above 1,680 USD. Otherwise, the technical picture would suffer greater damage.
Weekly chart: Turning point above the 200-day moving average.
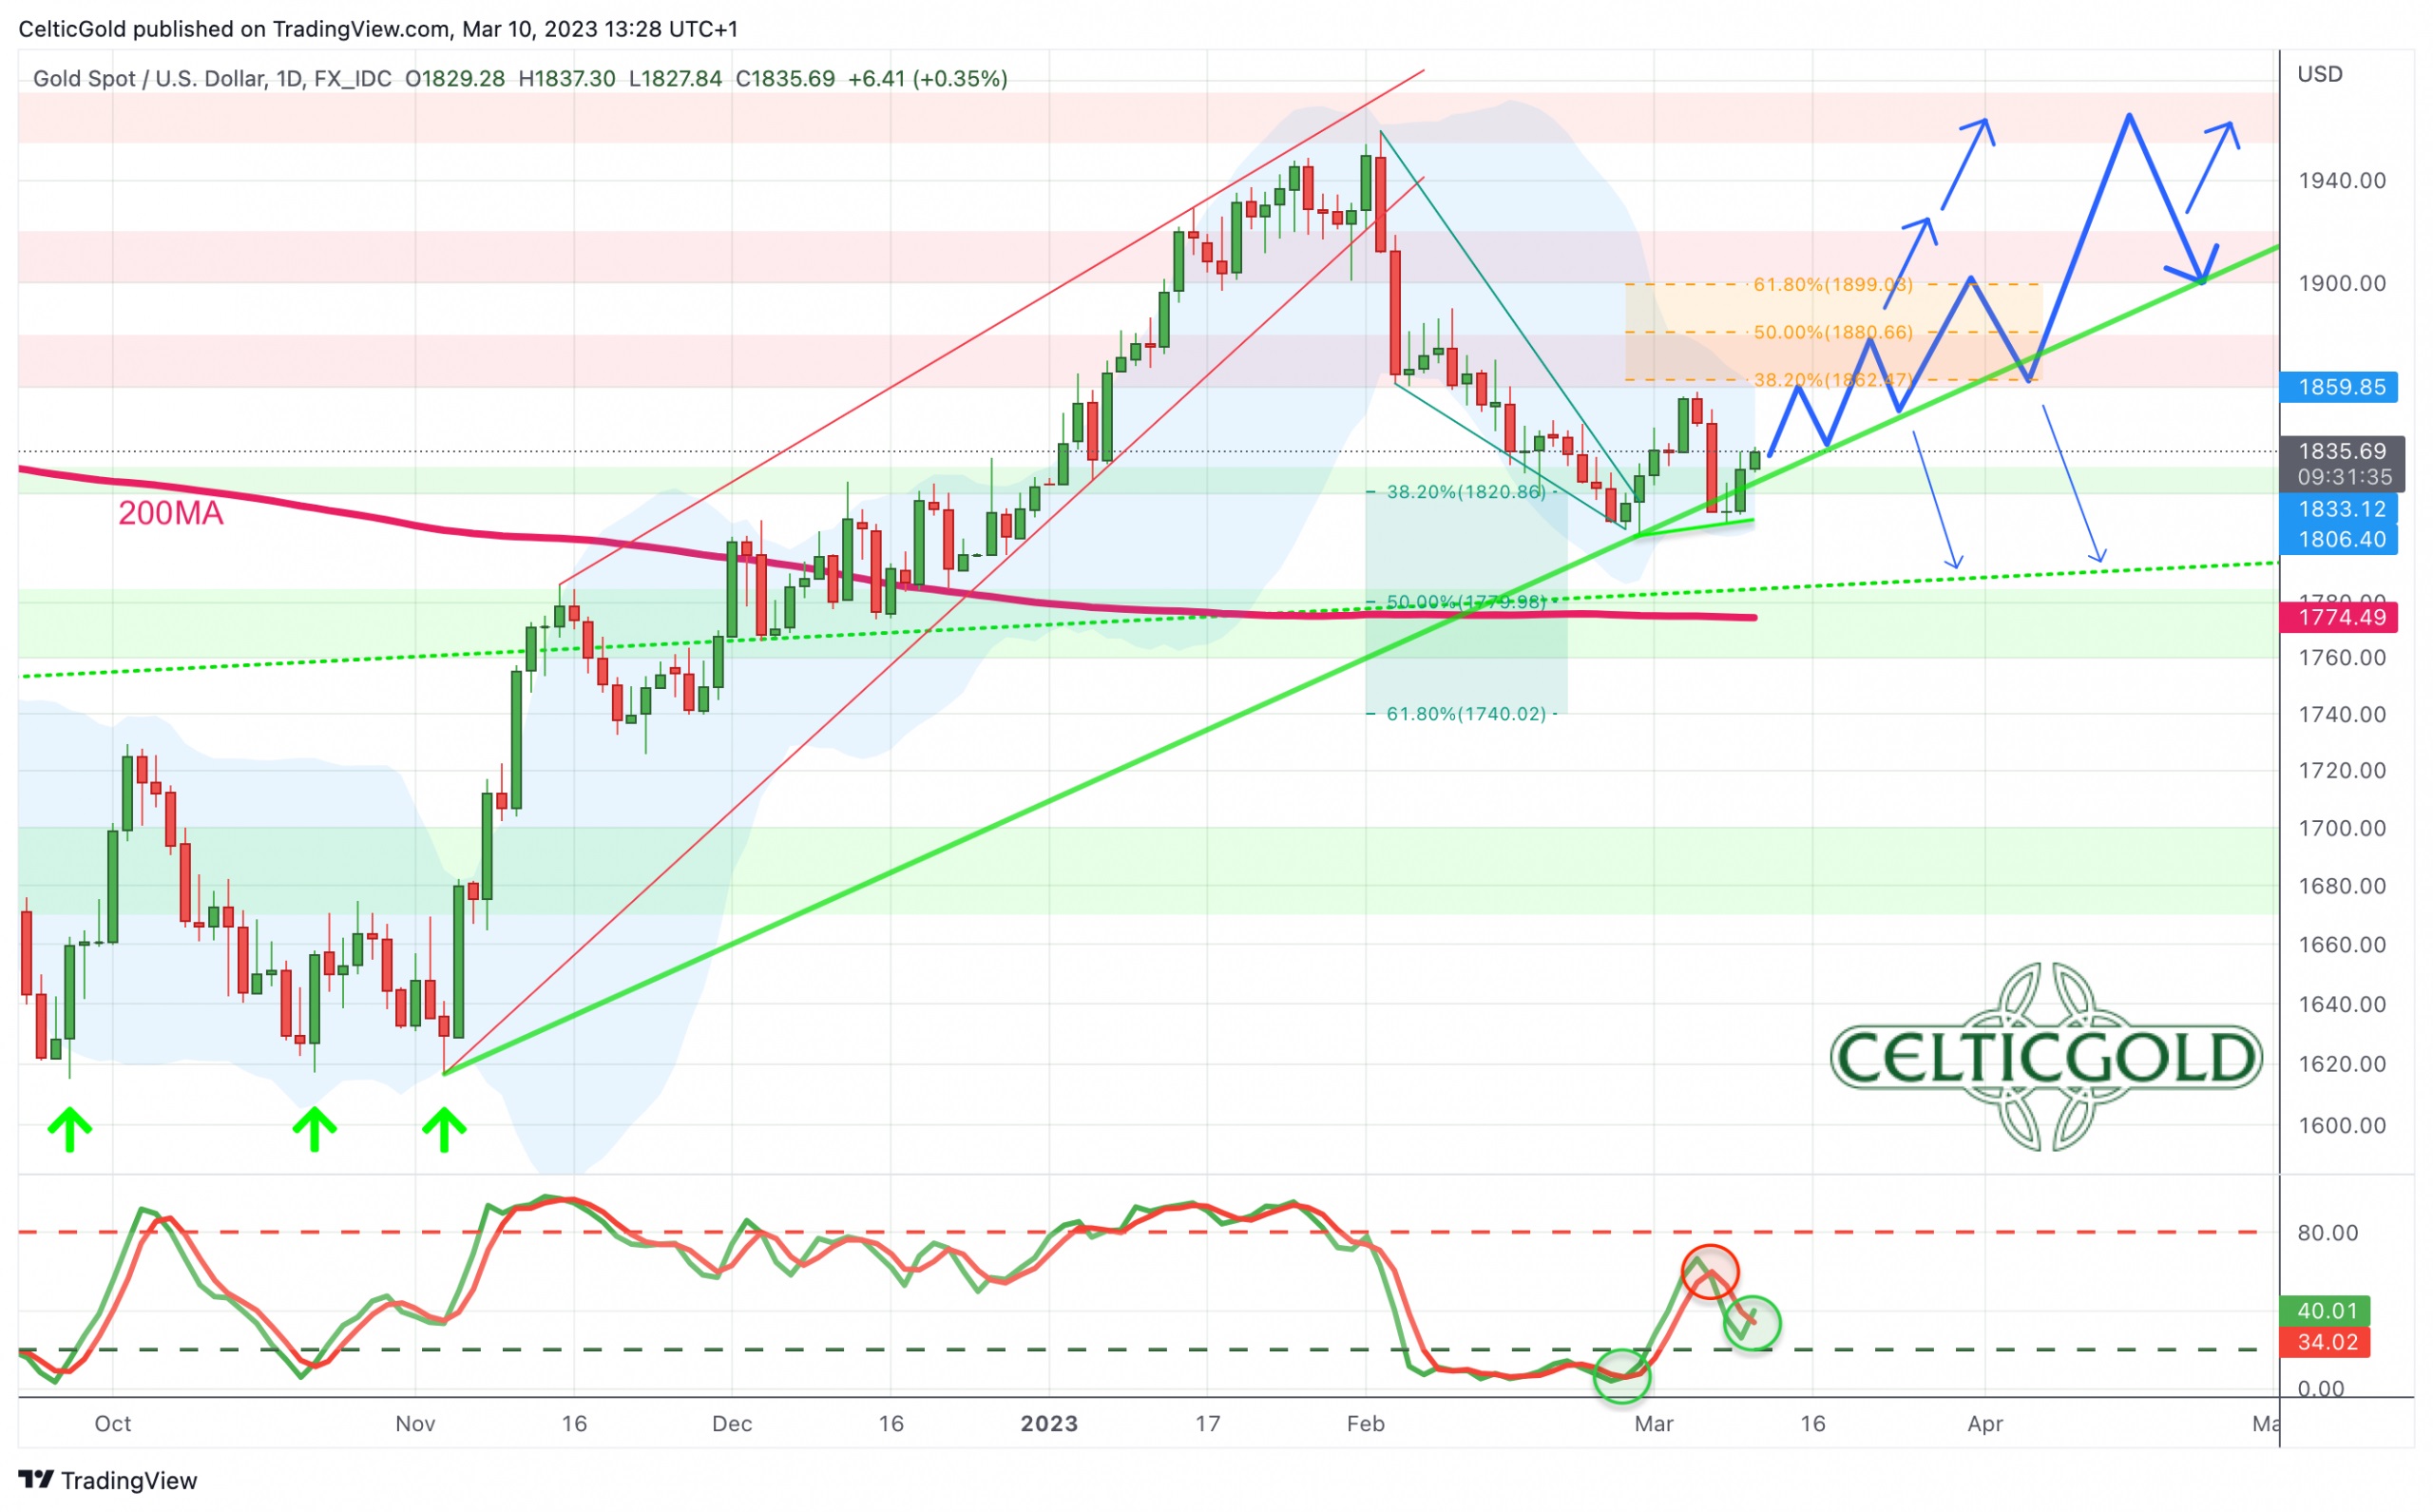
Gold in US-Dollar, daily chart as of March 10th, 2023. Source: Tradingview.
On the daily chart, gold has made a first substantial recovery in the prior week, almost completely freeing itself from its bearish position. In particular, the Stochastic oscillator had turned clearly upwards, providing a new buy signal. However, bears came back with vengeance on Monday, missing last week’s low by 5 USD. Hence, gold might have posted a slightly higher low, which is bullish!
In the context of the strong wave up that started at 1,615 USD in early November combined with the premature spring high at 1,959 USD in early February, the sharp pullback of the last few weeks can be viewed as somewhat healthy and rather mild. In fact, this pullback could have brought the buying opportunity that market participants had been waiting for in vain for three months. Ideally, gold will now continue its recovery towards the 38.2% retracement (1,862 USD), its 50-day moving average (1,870 USD), and the upper Bollinger Band (1,860 USD) on the daily chart. If these resistances are overcome, the way towards 1,950 USD would be clear.
In sum, the daily chart is acting more and more bullish. A rally to around 1,865 USD to 1,885 USD can be expected and would signal that the pullback in February is most likely done.
Commitments of Traders for Gold – Neutral
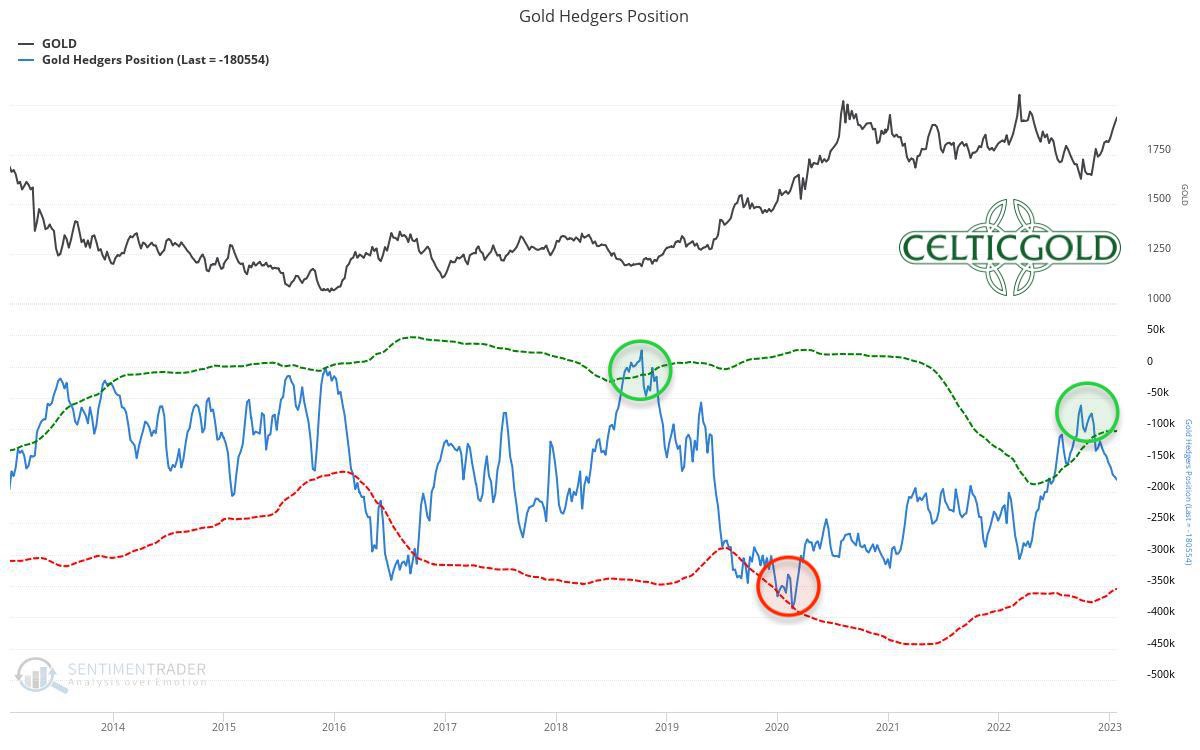
Commitments of Traders (COT) for gold as of January 27th, 2023. Source: Sentimentrader
Unfortunately, since end of January, the US regulatory authority CFTC did not release any up-to-date CoT report on US futures trading. The reason given was a cyber-attack on a data service provider. All missing reports are supposed to be submitted by mid-March.
The CoT report currently available is not relevant due to the strong price correction in recent weeks.
Sentiment for Gold – Healthy pullback provides new opportunities
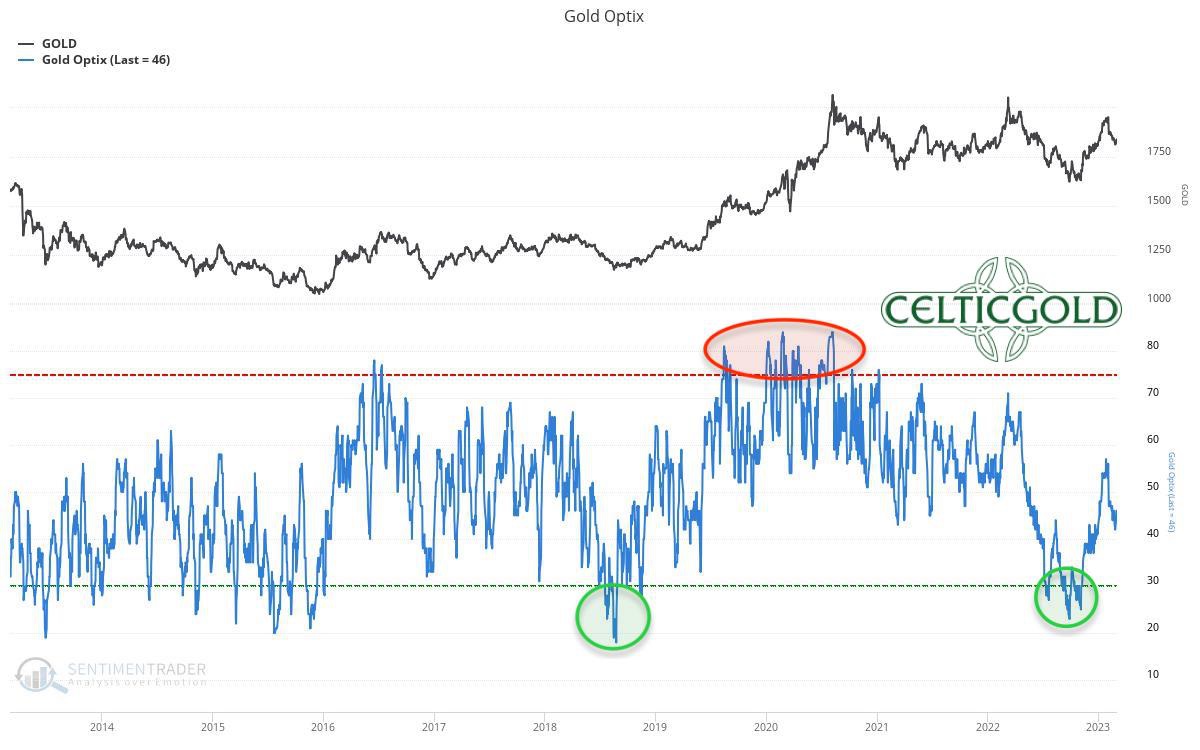
Sentiment Optix for gold as of March 3rd, 2023. Source: Sentimentrader
Due to the strong recovery, the sentiment analysis revealed a significantly increased optimism in early February. However, overall sentiment among market participants was still balanced. Due to the sharp pullback in recent weeks, the sentiment index has shifted a good way back towards pessimism, without showing any signs of extreme fear or panic.
Overall, the sentiment is neutral.
Seasonality for Gold – Rather unfavorable until July
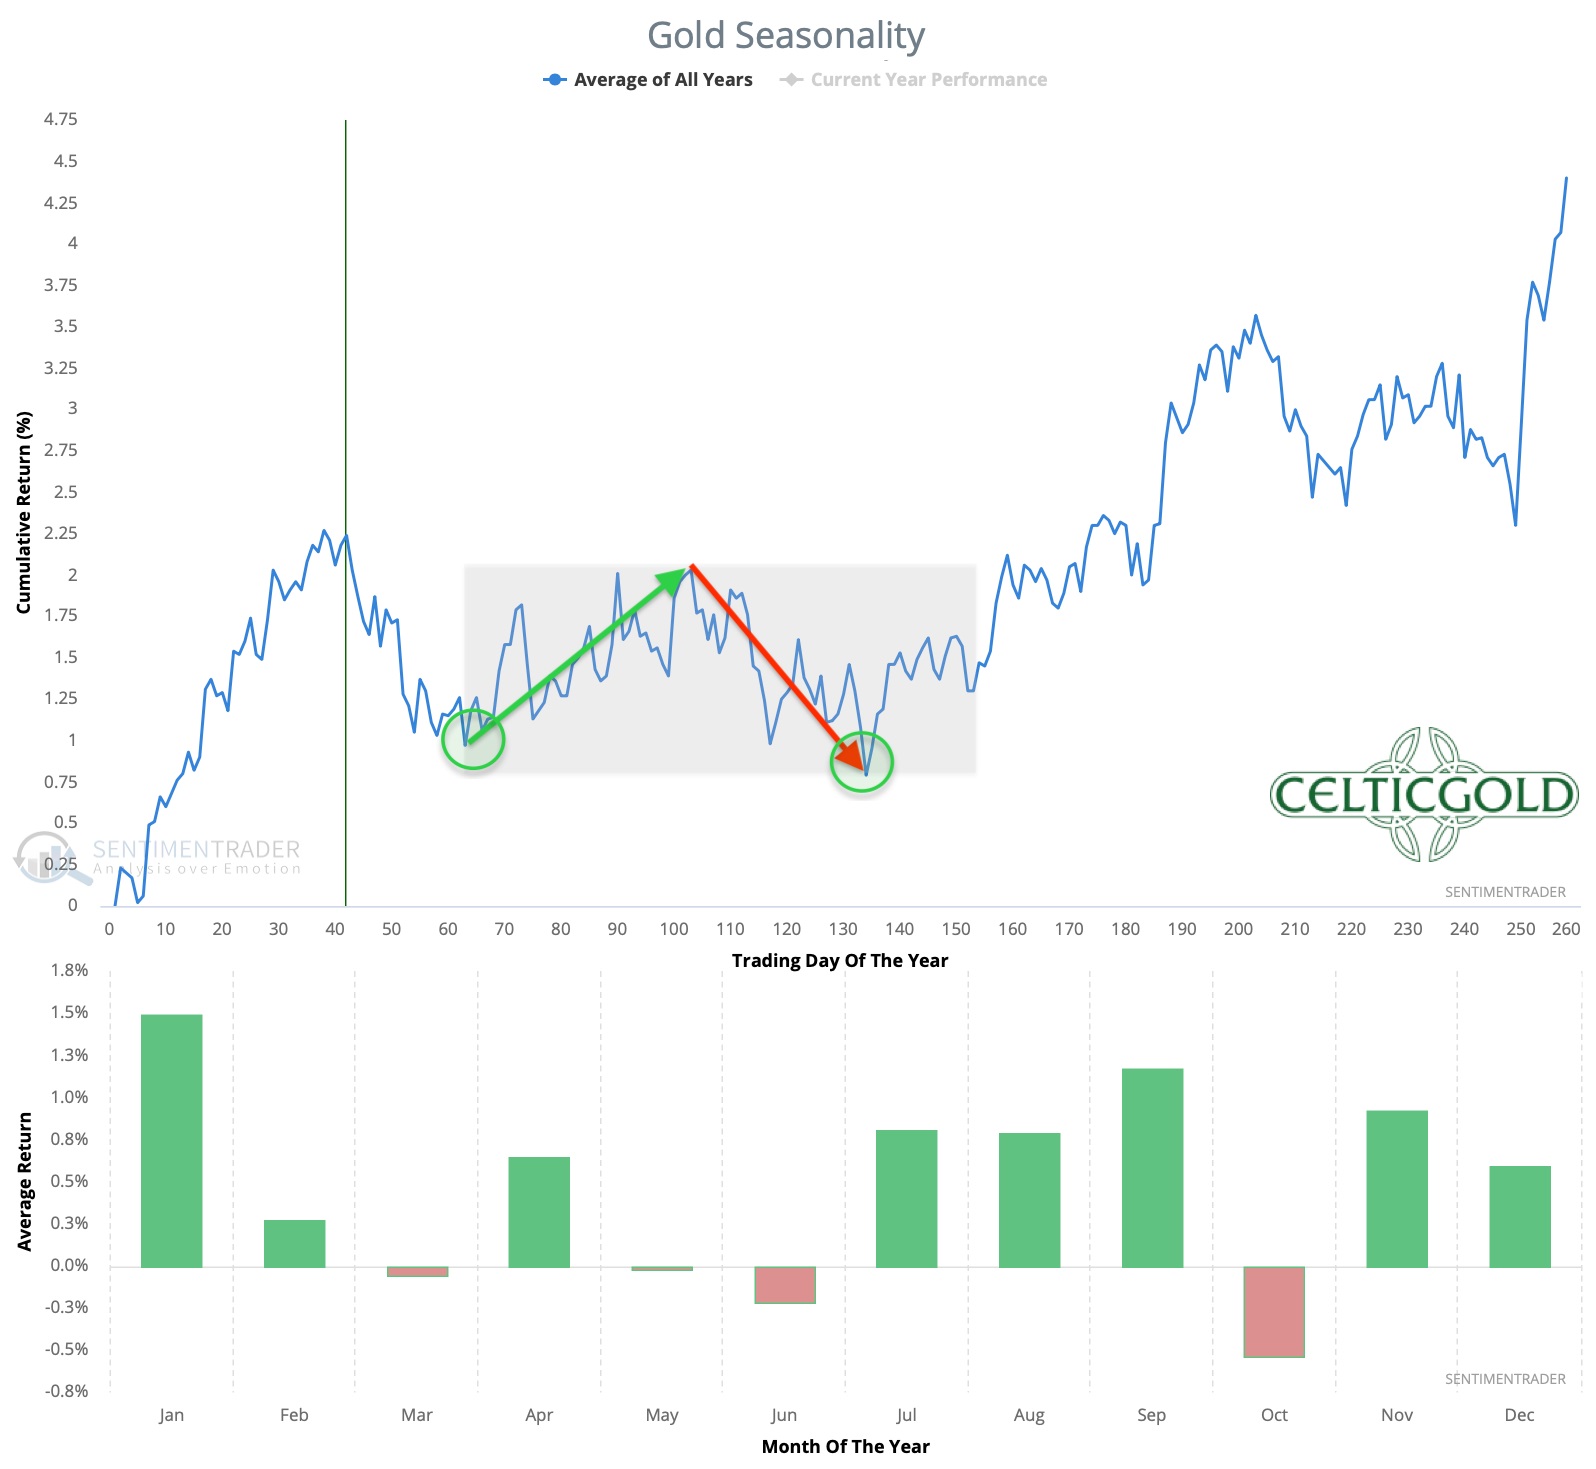
Seasonality for gold over the last 54-years as of March 3rd, 2023. Source: Sentimentrader
So far, it seems that gold had already reached its typical spring high in early February. This would shift the seasonal pattern forward by about a month this year. Hence, gold should now have at least good chances of a several-week recovery. Historically, gold price recoveries between March and May are usually moderate and rather sluggish, though.
If gold ignores this pattern this year, it would be another indication of an impending breakout above 2,000 USD. However, the seasonality only becomes really bullish again from late summer onwards, with gold typically marking a very important low point in June or July before that.
Seasonality currently allows for a recovery, but overall remains rather unfavorable until July.
Macro update – Commodities super-cycle
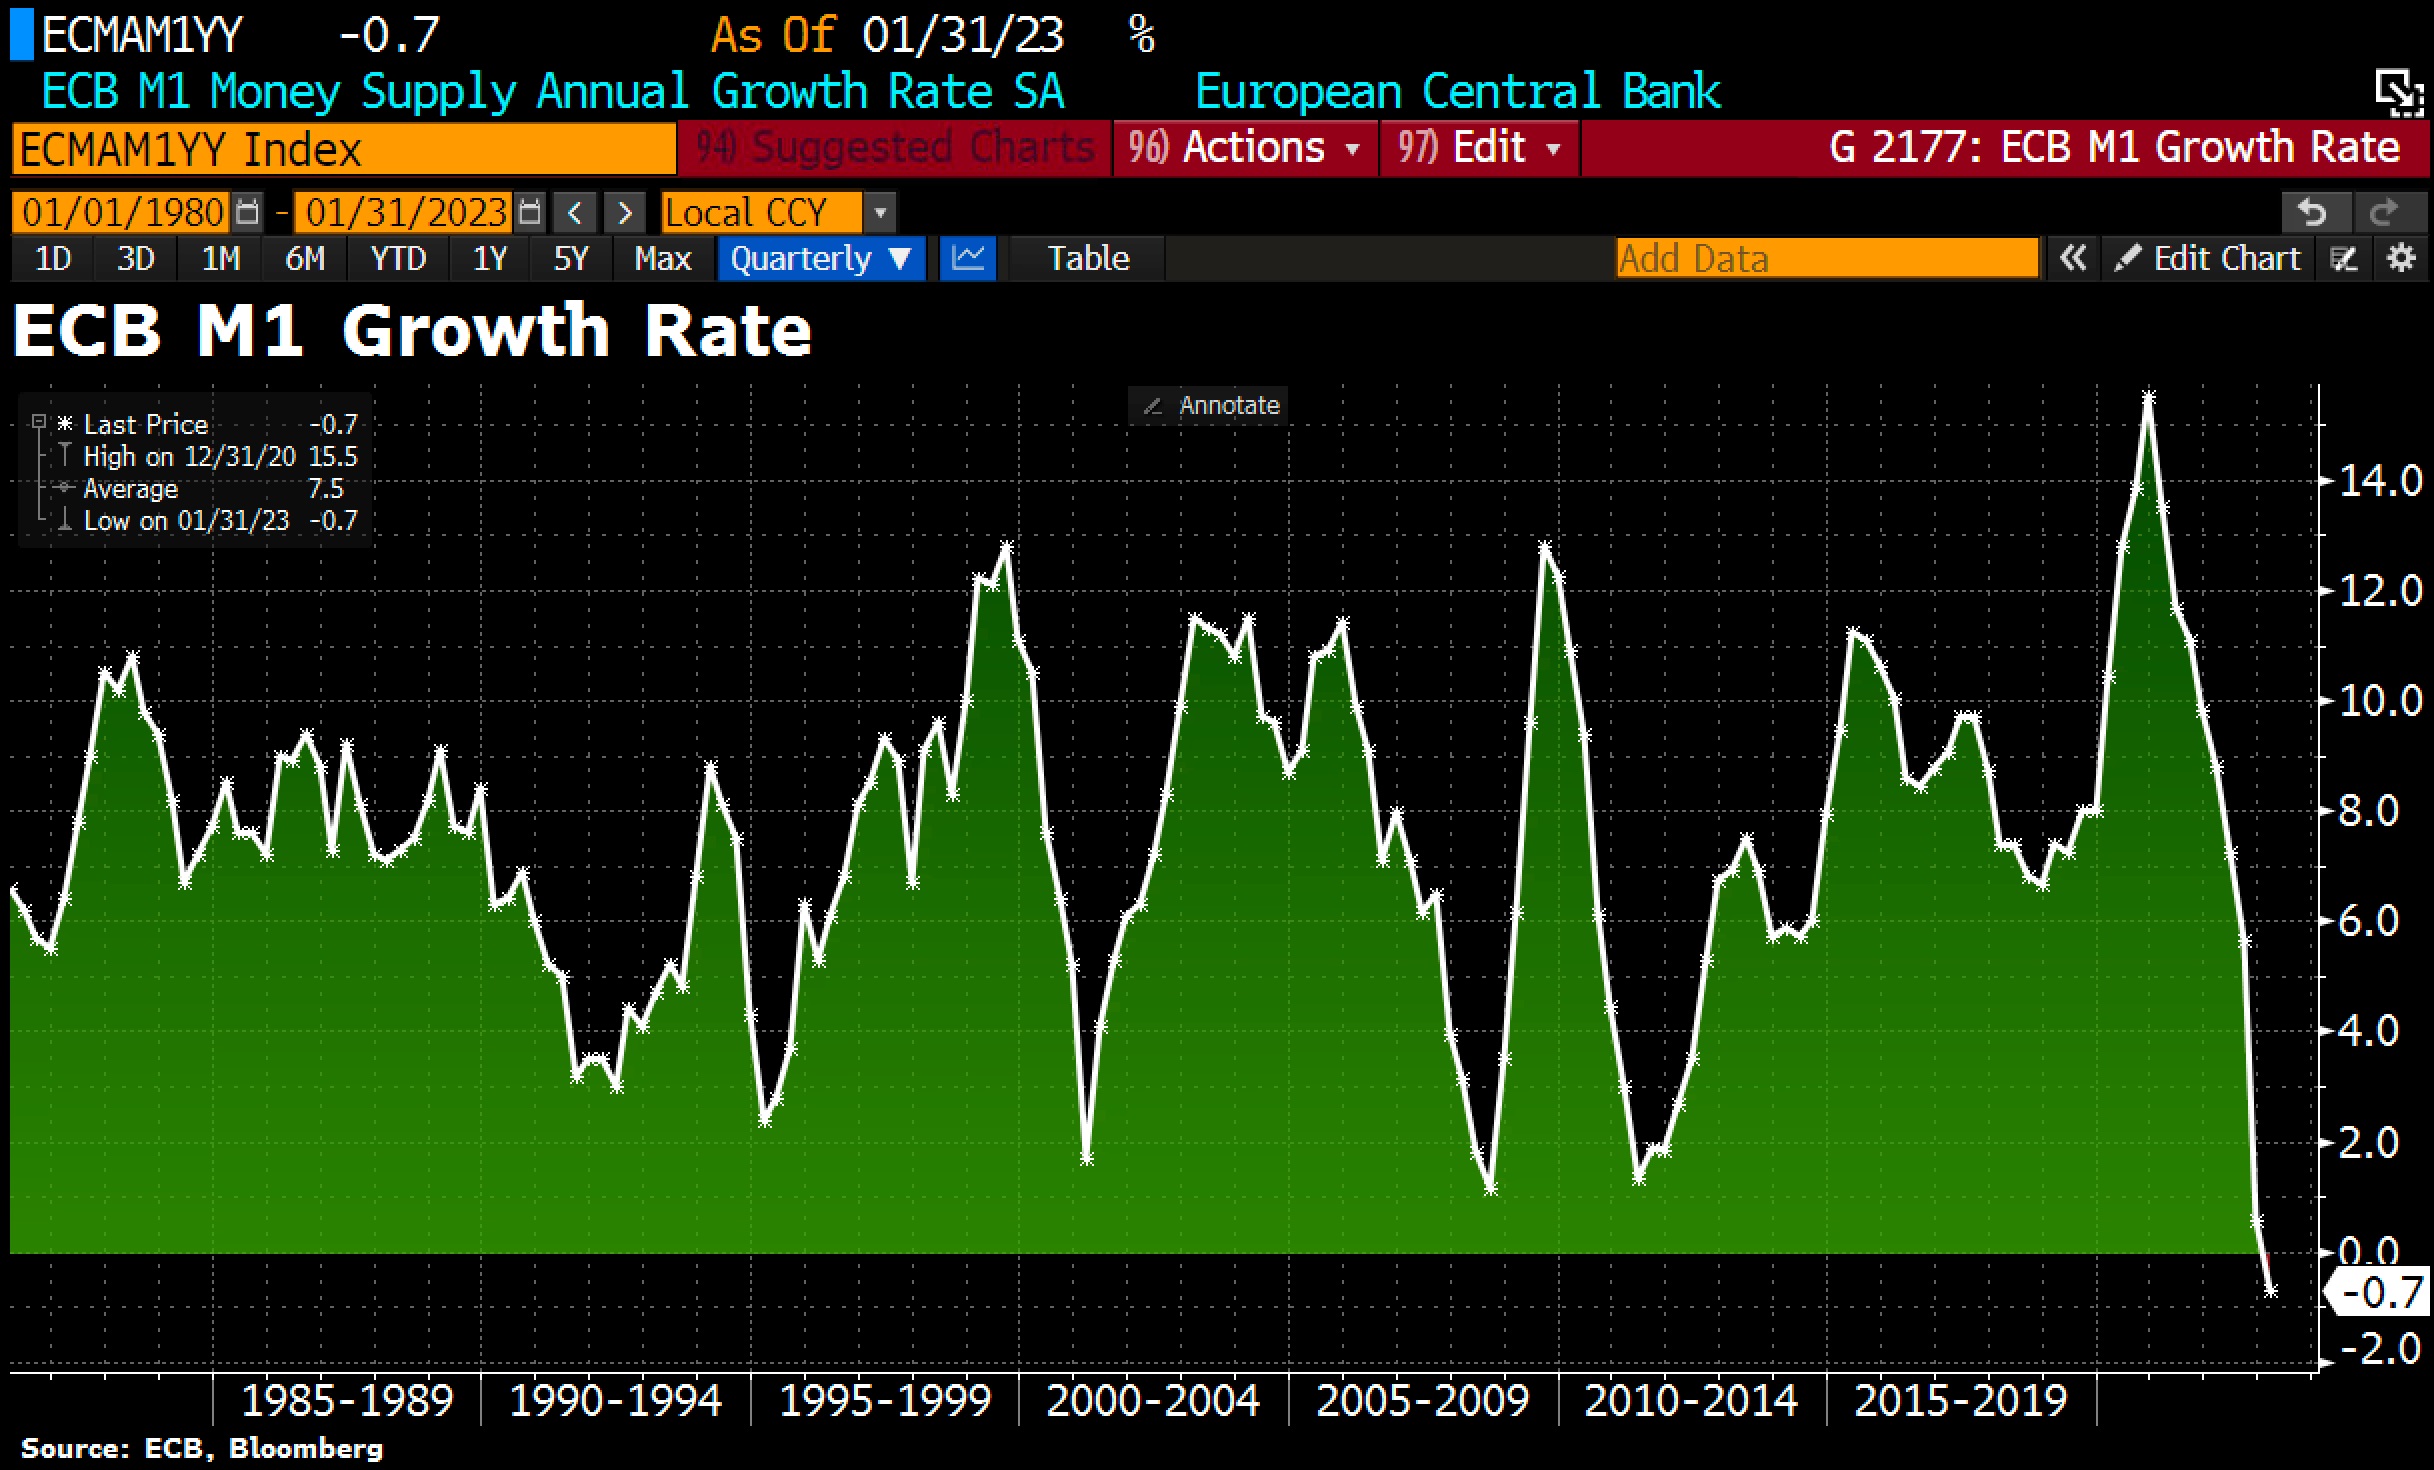
M1 money supply in the Eurozone as of February 27th, 2023. Source: Holger Zschäpitz
Independently of all the important fundamental developments, the most aggressive interest rate hikes of all time and the latest inflation data continue to determine the sentiment of market participants. Despite the drastic central bank policies, high inflation has not yet clearly subsided. According to the FED Watch Tool, the majority (55%) expect US interest rates to rise to 5.25-5.50% or higher by mid-June to combat inflation. In the Eurozone, the ECB will also continue to raise interest rates to fight inflation. The current consensus is for a rate hike to 4.5% until this summer.
However, the massive balance sheet reductions by the FED and the ECB that are still outstanding have been deliberately ignored over the past four months. For example, M1 money supply in the Eurozone was negative in year-on-year comparison for the first time since the beginning of the statistics. The annual growth rate of the narrower M1 money aggregate fell to -0.7% in January 2023 from 0.6% in December 2022, while M3 money supply slowed to 3.5% in December from 4.1%.
Quantitative tightening continues
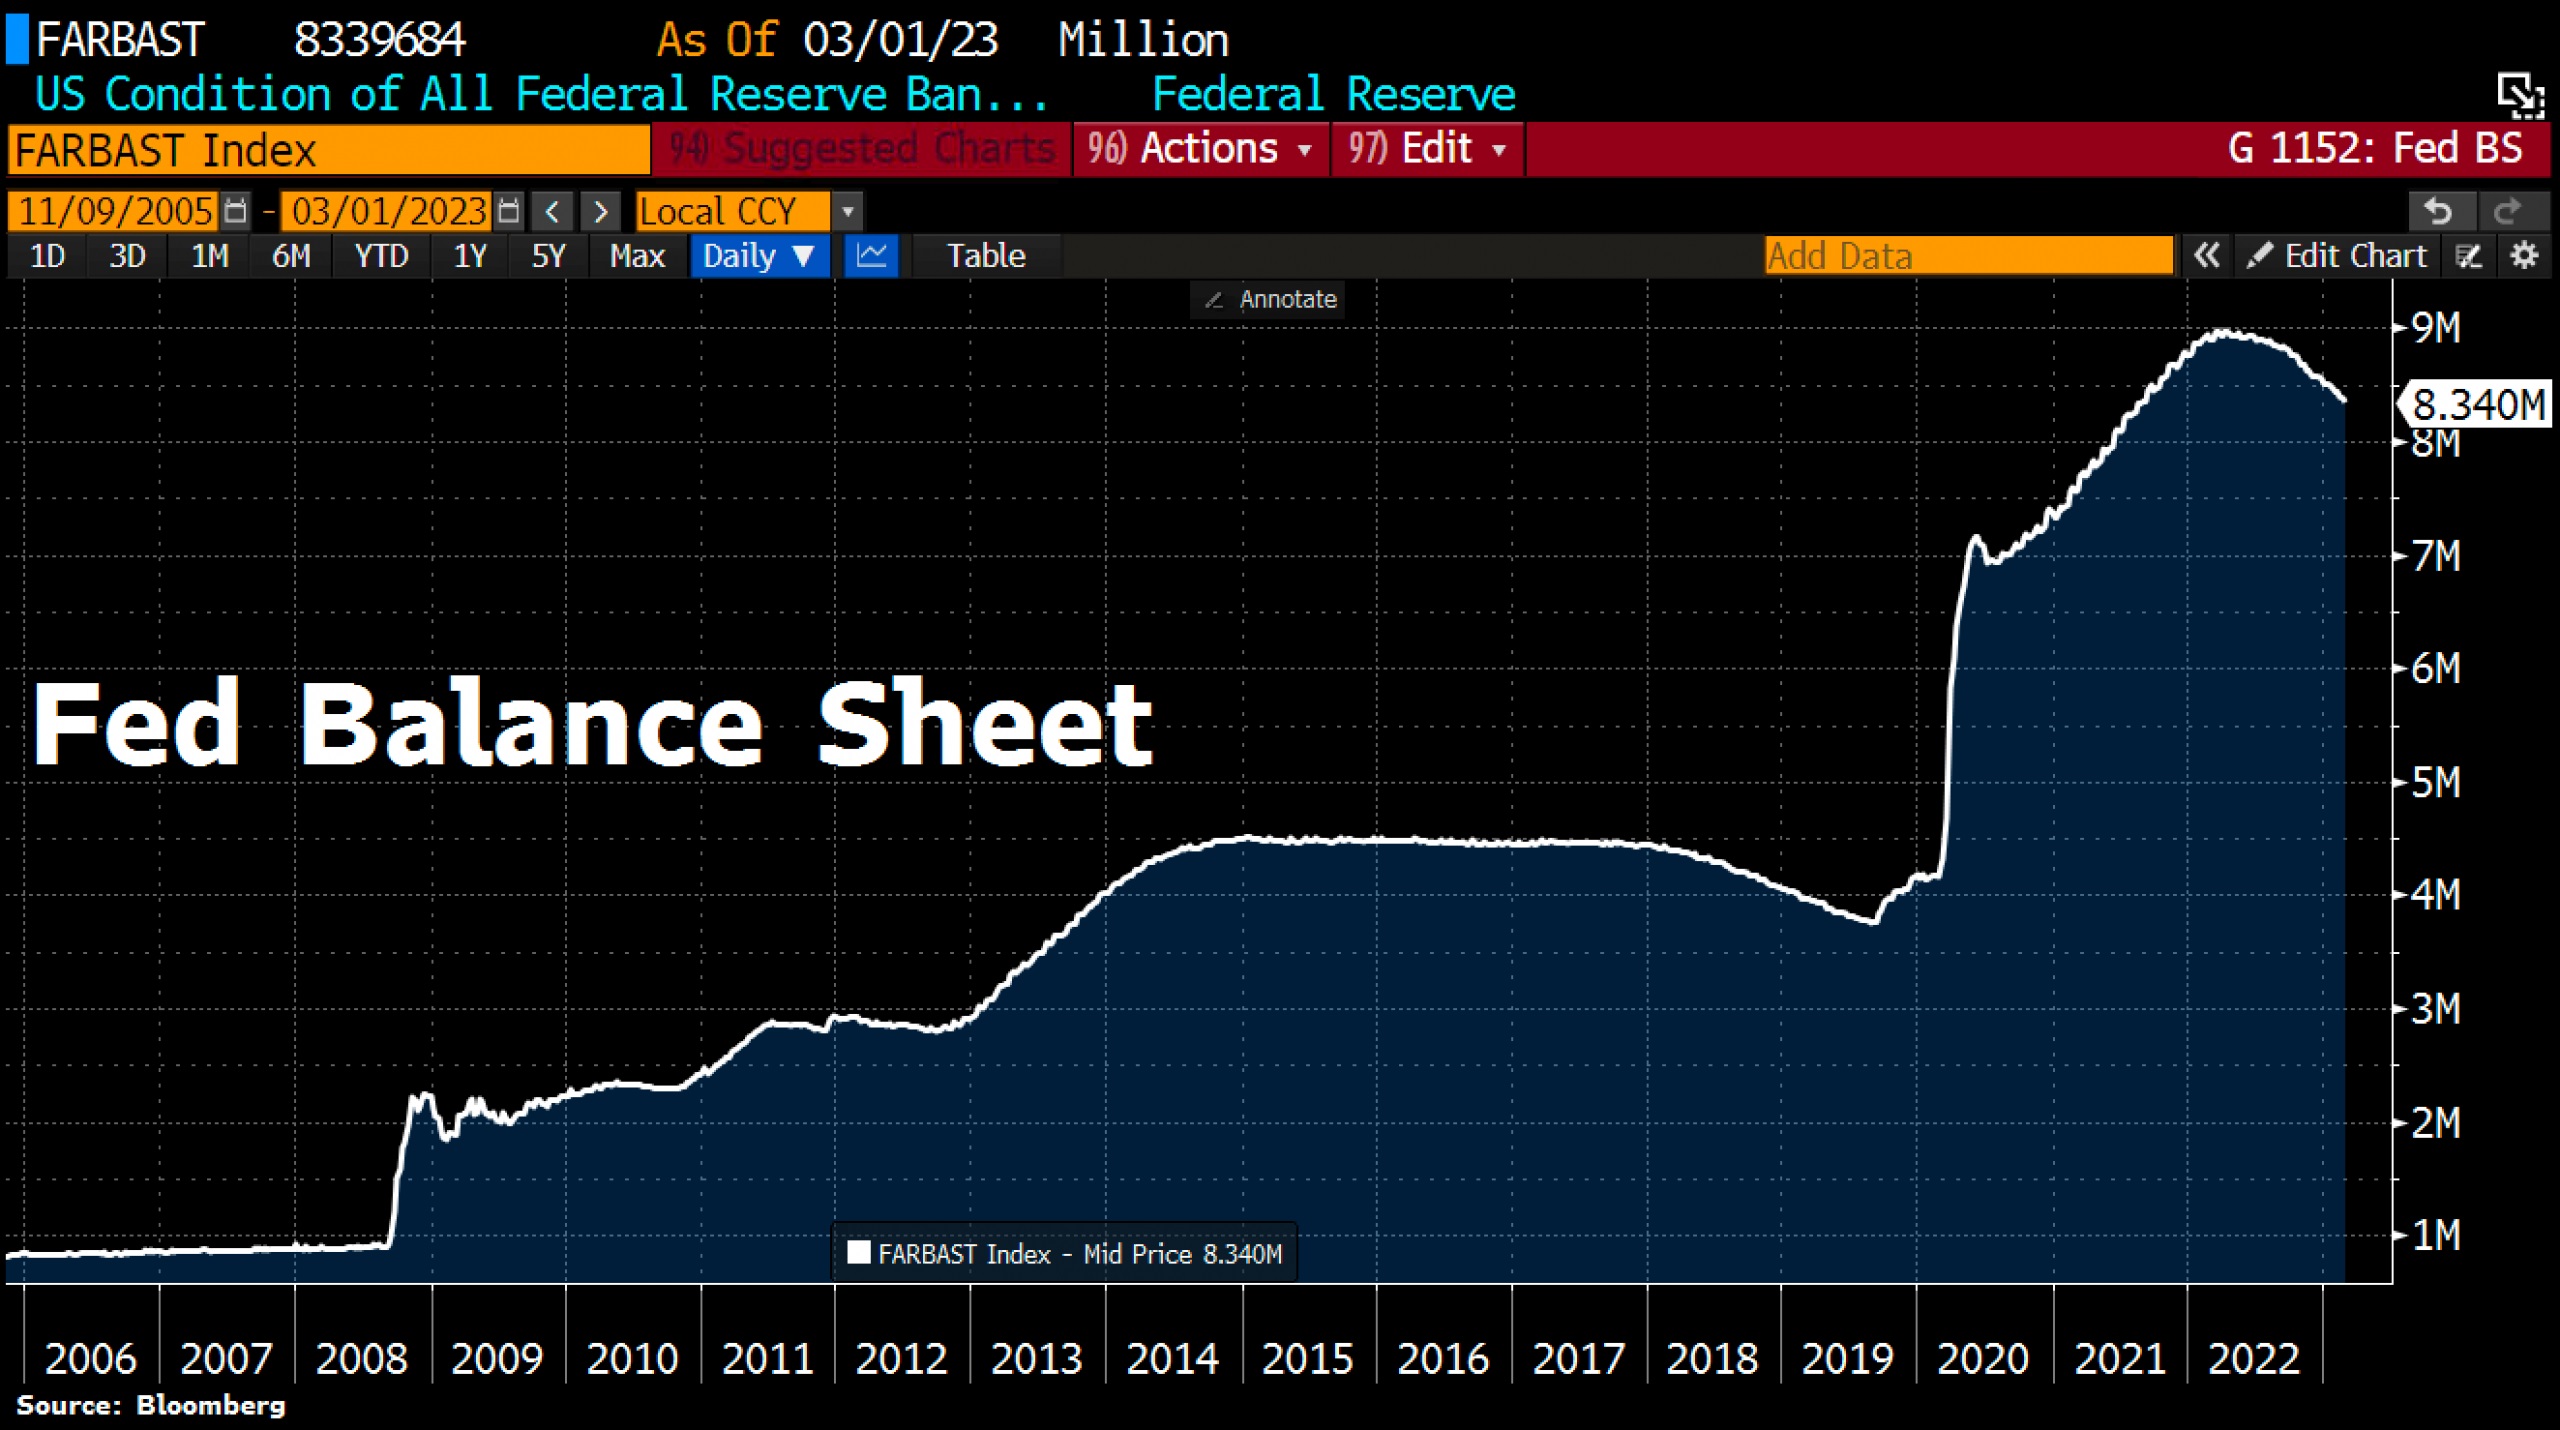
FED balance sheet as of March 1st, 2023. Source: Holger Zschäpitz
Likewise, the FED’s balance sheet has fallen further by 42.5 billion USD to 8,339.7 billion USD in the prior week. This is the lowest level since August 2022. Total assets now represent 32% of US GDP compared to 60% for the ECB, 113% for the SNB, and 132% for the BoJ. Together with rising interest rates, this is actually not a good sign for the markets because liquidity should continue to dwindle.
However, since the Chinese central bank in particular has resisted the worldwide monetary tightening with a massive infusion of liquidity, stock markets have been able to perform strongly since October. In addition, the majority of market participants had either bet on falling prices or were not invested at all.
Inflation, de-dollarization and Cold War will unleash a Commodities super-cycle
Ultimately, inflation caused by supply chain issues, scarcity and the expansion of the money supply is certainly not something that can be solved in this way. In addition, the breakdown of the unipolar world order, where East and West are increasingly aggressive and relentless towards each other like during the Cold War, is also a factor. For decades, the US dollar has been the undisputed world reserve currency. Now, industrial rivalry is likely to not only cause a global de-dollarization but also fuel a commodity super-cycle.
A commodities super-cycle can be described as a period of consistent and sustained price increases, usually driven by decreasing supply or strong demand for raw materials, manufactured materials, and energy, lasting more than five years.
On the one hand, the enormous geopolitical shifts mean that the BRICS+ economic bloc will gradually detach itself from the petrodollar system. On the other hand, years of underinvestment in mining projects and structurally higher capital costs will severely limit the supply of commodities.
Gold for oil
With the “Belt and Road Initiative” and currency swap agreements, China is trying to increase the international importance of its currency. Gold is also likely to play a key role in this. For example, Saudi Arabia now sells its oil to China for renminbi and can then easily exchange the Chinese fiat currency for gold bars at the gold exchange in Shanghai. This gradual shift will deflate the ongoing western paper gold manipulation. In this context, the ignorance in the US and the Eurozone towards commodities and precious metals is extremely dangerous. Gold has been flowing from west to east for two decades now. The wake-up call will be bitter and force an inevitable capital rotation towards underrepresented commodities and precious metals in institutional portfolios.

Although the US dollar may potentially show more stability against weaker fiat currencies such as the euro in the medium term, it is highly likely to depreciate against commodities, precious metals, and commodity-backed currencies such as the Brazilian Real or the Canadian Dollar. In the short term, a weaker dollar supports stock markets.
What is missing in this explosive cocktail is a clear breakout of gold above the psychological level of 2,000 USD. There are increasing signs that this could happen in the summer or fall of this year. Investors are therefore well advised to use any weakness in precious metal prices to increase their physical holdings. It is also recommended to hold commodity stocks of large mining companies with high dividend yields such as Rio Tinto and BHP Group.
Conclusion: Gold – Healthy pullback provides new opportunities
Although the sharp pullback in the gold market immediately reminded many gold fans of last year’s months-long deep correction, the current situation is quite positive, though. With last week’s bounce and this week’s second leg to stand on, the zone around 1,805 USD to 1,815 USD has proven to be strong support. Given the active buy signals, the recovery should have room to move up at least towards 1,865 USD to 1,885 USD.
Of course, a continuation of the correction towards the 200-day moving average (1,775 USD) can still happen. As well, further disturbances until early summer would not be a surprise either, as the seasonal window for the next three months is not very supportive.
Gold – Healthy pullback provides new opportunities
But at the same time, there are many signs that the next attack on the zone of 1,950 USD to 2,050 USD is imminent. This would clearly indicate that the gold price is poised to break out to new all-time highs later in the year. Overall, the sharp pullback in February has ensured that surprises are once again to be found on the upside.
---
Analysis initially published on March 4th, 2023, by www.celticgold.de. Translated into English and partially updated on March 10th, 2023.
Feel free to join us in our free Telegram channel for daily real time data and a great community. If you like to get regular updates on our gold model, precious metals and cryptocurrencies you can also subscribe to our free newsletter.
Disclosure:
This article and the content are for informational purposes only and do not contain investment advice or recommendations. Every investment and trading move involves risk, and readers should conduct their own research when making a decision. The views, thoughts and opinions expressed here are the author’s alone. They do not necessarily reflect or represent the views and opinions of Midas Touch Consulting.
*********
 Florian Grummes (born 1975 in Munich) has been studying and trading the Gold market since 2003. In 2008 he started publishing a bi-weekly extensive gold analysis containing technical chart analysis as well as fundamental and sentiment analysis. Parallel to his trading business he is also a very creative & successful composer, songwriter and music producer. You can reach Florian at: [email protected].


