Gold and Dollar


It's been a while since we looked at the relationship between gold and the dollar. These two have always had an inversed relationship with each other, if one is up, the other is down. But in 2005, the dollar rallied while gold remained firm, at times both were rallying together. This gave the impression that a new relationship has begun, and now a year later, what next?
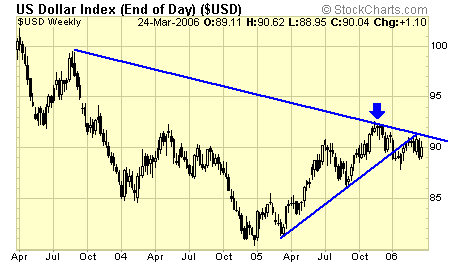
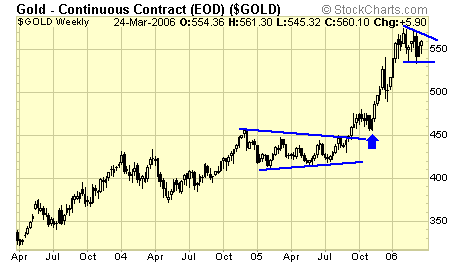
In retrospect, the dollar's rise in 2005 has only put gold in a sideways consolidation, and when the dollar topped in Nov, gold exploded for a quick $100 rally. These past few weeks, the dollar bounced back to test resistance, and once again, gold went sideways. Therefore, two things are apparent: the inverse relationship between the two is alive and well, and, if the dollar cannot break resistance and falls, gold will blast up once again.
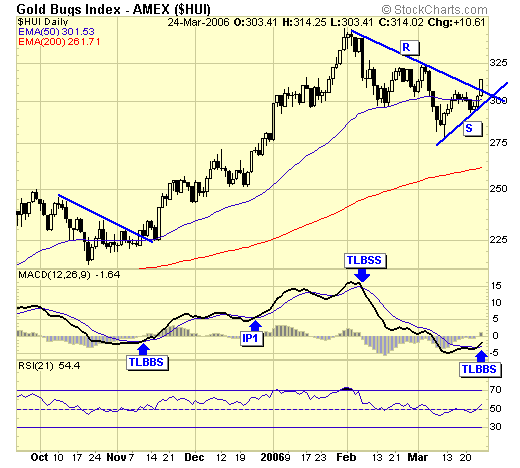
To get a glimpse of the future, gold stocks often play a leading role. We had a buy signal in early November, before gold and dollar went their separate ways. Now after a two month correction, we have a buy signal again in stocks, and if history repeats, the dollar will fall hard while gold rises out of the current consolidation.
In previous analysis, I have expected a trading range to develop in gold stocks, a corrective phase which could last a few months. Two things happened this past week which convinced me that the rally from May 2005 is not complete. #1 - our proprietary BPGOLD has reversed up this week, indicating more gold stocks are breaking out, which suggests a trend continuation, and not the beginning of a trading range. (BPGOLD chart not shown here, for subscribers only.)
Non-subscribers who wish to receive this week's report can send me a note, a one time offer only, at : [email protected]
#2 - our breakout model did not violate trendline support, therefore, also suggesting a trend continuation.
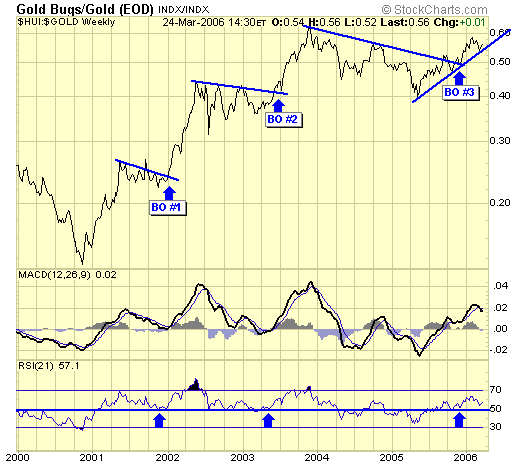
Our breakout model confirmed our major buy signal in November and December, and has now turned up again after testing trendline support. What makes this BO #3 special is that both BO #1 and #2 went parabolic after the breakout, and then suffered a multi month correction within a large trading range; but that is simply not the case with the current breakout. The current rise is at a perfect 45 degree which is very sustainable and could rise much further than the previous two.
Summary
Markets are dynamic and subject to constant change. The advantage of technical analysis is gaining the ability to focus on price action and see these changes in a timely fashion to stay with the markets. But most importantly, is to learn to differentiate between a signal and an analysis. We trade our signals, and not our analysis; always. Being in the market is about making profits, and not so much about being right or wrong.
Jack Chan at www.traderscorporation.com
25 March 2006

Jack Chan is the editor of Simply Profits, established in 2006. Chan bought his first mining stock, Hoko Exploration, in 1979, and has been active in the markets for the past 37 years. Technical analysis has helped him filter out the noise and focus on the when, and leave the why to the fundamental analysts. His proprietary trading models have enabled him to identify the NASDAQ top in 2000, the new gold bull market in 2001, the stock market top in 2007, and the US dollar bottom in 2011.


