Gold And Silver Commercial Traders Begin To Cover Short Positions


Does the trend change in the short position of commercial traders signal a bottom for precious metals?
Gold and silver prices posted a strong start to the year in 2017, despite the December rate hike. This was a repeat of last year, when the December 2015 Federal Reserve rate hike was followed by a massive rally in precious metals. However, both gold and silver have pulled back sharply over the past few weeks. Gold is down $60 or 4.5% to $1,200, while silver is down $1.40 or 7.5% to $17 per ounce.
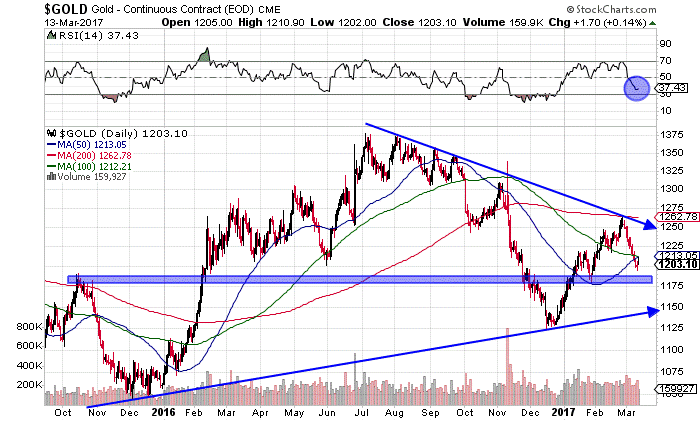
The gold price chart shows the symmetrical triangle, most often a continuation pattern for technical analysts. This suggests a continuation of the prior uptrend in place since late 2015. There is support around $1,180 and the 50-day and 100-day moving averages have converged at $1,212. A close above this price point would be very bullish for gold. The RSI has a bit more room to drop as traders await the FED’s decision.
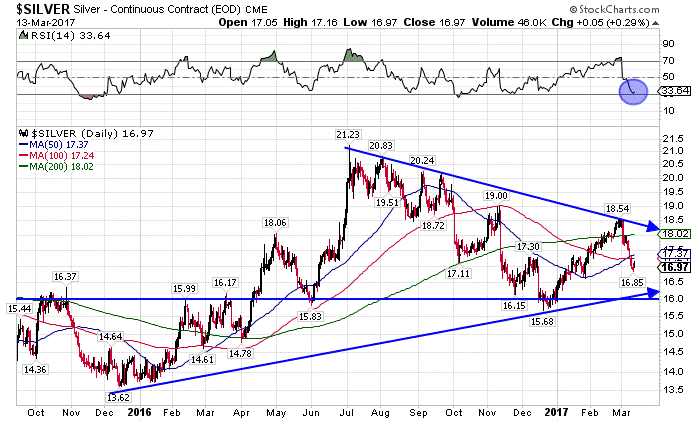
The silver chart shows a similar pattern with room to continue lower before hitting trend-line support. However, the RSI is very close to overbought, so it is unlikely that silver will continue much lower. Silver has strong support at $16, but I doubt the price will drop that low or stay there long if it does.
This correction has been driven primarily by increasing expectations of another rate hike coming out of the March 15 FED meeting. We will find out Wednesday if they decide to raise interest rates again. I think a hike of 25 basis points is largely priced into the market at this point. Even if gold and silver slip lower on a hike, I think the downside will be limited. We are more likely to get another price rally as investors that sold the rumor, cover and buy the news.
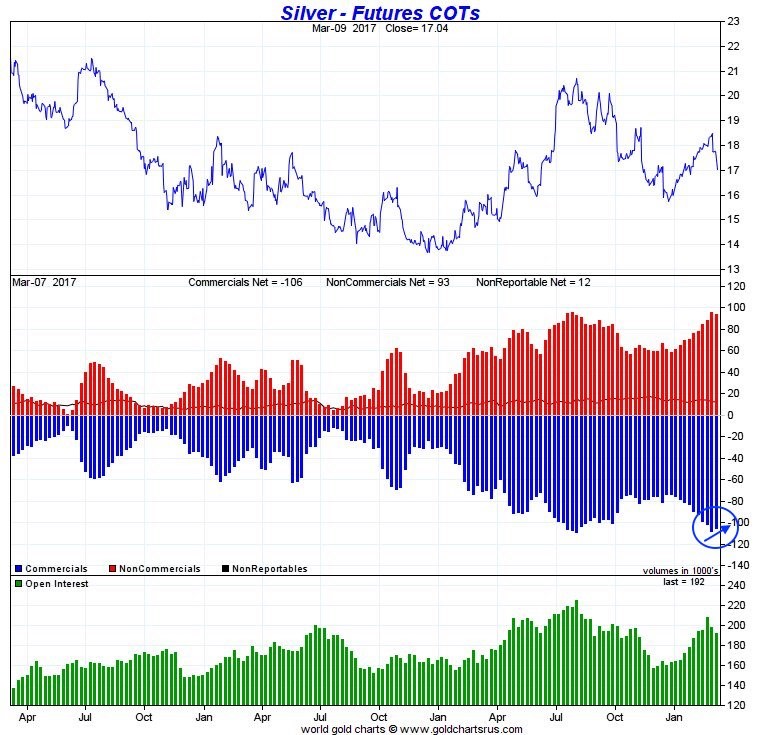
Speaking of covering short positions, commercial traders reduced their short positions on both gold and silver last week. The latest commitment of traders (COT) report for March 10th shows slight reductions in short positions on both metals, breaking a multi-week trend of increasing short positions. This trend change often signals a bottom or exhaustion of the price correction in precious metals. Notice the blue arrows on the chart reversing the prior trend of increasing short positions by commercial traders.
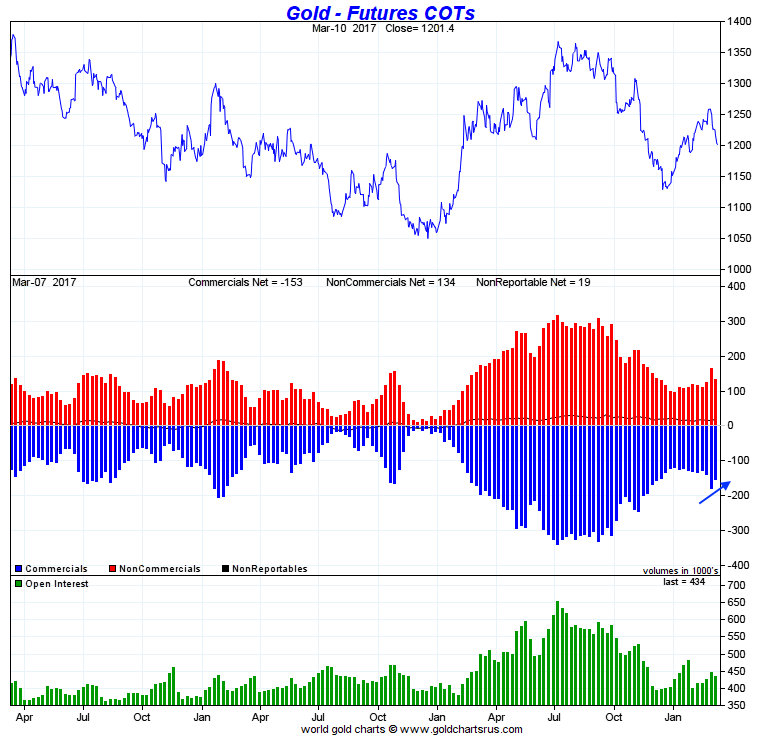
Also, it is worth noting that the silver short position by the commercials was the largest in history last month. If these shorts are forced to cover this substantial short position against silver, it could cause a short squeeze and massive spike in the price ahead.
We reduced our exposure to mining stocks over the past few months and have plenty of power dry to buy this dip. Once the bottoming pattern is confirmed, it will be time to back up the truck and buy the dip aggressively.
********
You can follow which stocks we hold in the GSB model portfolio, receive trade alerts when we are buying or selling, get the monthly contrarian newsletter and profit alongside us by clicking the subscribe button below. You can get started for just $45 and pay around $1 per day for the annual subscription.

Jason Hamlin is the founder of Nicoya Research and has been publishing investment research at goldstockbull.com since 2006. His background is in data analytics for the world’s largest market research firm. Jason consulted to Fortune 500 companies around the globe, including Nestlé, Johnson & Johnson and Del Monte. Jason eventually left the corporate world and leveraged his analytical skills to trade stocks successfully full-time. Jason is a contrarian, cycles investor and student of Austrian economics. He is a proponent of sound money, limited government, decentralization of power and the non-aggression principle (NAP). His website is at nicoyaresearch.com. You can reach Jason at: https://nicoyaresearch.com/contact-us/.


